The Dynamical Model of Information Diffusion in Social Networks Considering the Effects of User Behavior
Abstract
User behavior directly influences the speed, spread, and content of information diffusion on social networks. Social networks can be regarded as social, complex, dynamic, and networked systems. Mathematical models are a powerful tool for better understanding the system behavior better, identifying key factors, predicting future behaviors, and developing management policies. This paper presents the susceptible-exposed-infected-recovered-susceptible with quitted and addicted (SEIRS-QA) model, a dynamic framework that effectively captures user behavior in social networks over time. By incorporating addiction, popularity, and user awareness, this model offers insights into the dynamic nature of social network usage. The analytical model serves as the foundation for characterizing social networks, considering three key factors that shape their impact. The equilibrium points of the model are studied, and their stability is assessed using the Routh–Hurwitz criteria and comparison principle. The model’s dynamic behavior is influenced by the basic reproductive ratio, which is determined using the next-generation matrix. To validate the theoretical results, numerical simulations are conducted, confirming the accuracy and reliability of the proposed approach. Through analytical and stability analyses, along with numerical simulations, this study provides a theoretical foundation to advance our understanding of information diffusion dynamics in social networks.
1. Introduction
The development of information and communication technologies, which fundamentally altered the world, is significantly aided by social networks. Over the last few years, people have interacted with friends and shared information, memories, news, and other content on social network platforms like Facebook, Instagram, LinkedIn, and YouTube [1]. Despite the recent success of Facebook and Twitter, past years also provided numerous examples of social networks have risen and fallen in popularity. These networks have become an essential part of our daily lives and are known as a platform for international interactions [2]. Social networks are a significant piece of technology when used properly because they give people access to knowledge, problem-solving abilities, business skills, and other essential abilities. Because of this dependency on these networks, researchers have begun to focus on social network analysis, which includes information dissemination, community detection, rumor propagation, link prediction, and other functions [3]. Information diffusion in social networks is a tool for expanding knowledge and awareness among users. On the other hand, it can be used to spread rumors. Therefore, investigating how information is distributed on networks is a practical issue in control and management [4]. When new information is spreading within a network, social network analysis is crucial for identifying social influence. This analysis gives us details about social influence, including the most prevalent user opinions, user opinions following social influence, and maximum social influence. Social influence refers to a person’s altered behavior as a result of network users. The degree of social influence is influenced by some variables, including user similarity and difference, the strength of user relationships and trust, and network member characteristics like age, background, religion, and level of education [5].
Popularity in social networks relates to the social dynamics of visibility, influence, and engagement metrics among users. The extent of information diffusion on social network platforms is directly related to their popularity. Platforms that impose fewer restrictions and provide greater security for users tend to become more popular [6]. Addictions, including those connected to social media and digital media, are unquestionably at high risk of growing. Social network popularity may have contributed to an increase in usage, which is related to the idea that such an abnormal situation might have clear psychological repercussions. Various aspects of daily life, including work, academic performance, and social and interpersonal relationships, are impacted by this psychological dependence [7]. User awareness is a key factor in regulating behaviors and usage of social networks. By enhancing awareness about time management, security, psychological impacts, and algorithms, users can adopt a more purposeful and healthier approach to social networks. Public education, management tools, and platform transparency are key methods for enhancing user awareness.
There are various methods and mathematical analyses to measure the social relations of humans. Modeling is the only practical approach, and mathematical modeling plays a significant role in comprehending and providing an effective branch of science to predict and examine the dynamics of social networks. Studying epidemic models on networks can help us better understand which network characteristics have the greatest impact on users and how public health interventions like immunization, diagnosis and treatment, isolation, travel restrictions, and so on can help reduce addiction [8]. User awareness has a significant positive impact on addiction reduction and aids in disease prevention. In social network modeling, awareness, broadly defined as information diffusion, plays an important role in the formation of user dynamic functions. Also, by considering the popularity of platforms in various situations, a user will choose the platforms that are current, recent, or will become popular. The way network users interact influences the network structure and information diffusion. Epidemic models are used to explore the dynamics, demographic structure, and changes in the states of network members [9].
This study uses the susceptible-exposed-infected-recovered-susceptible with quitted and addicted (SEIRS-QA) model to mathematically model the information diffusion in social networks. To investigate how the proposed model behaves dynamically in social networks, user awareness, popularity, and addiction are taken into consideration. To illustrate the impact of effective factors on the suggested model and the influence of various parameters, numerical simulations are presented. Additionally, to manage addiction in social networks, the basic reproduction number is derived, and the free equilibrium point is calculated.
This paper has the following organizational structure. A summary of the relevant work is given in Section 2. In Section 3, the suggested information diffusion model is presented and explained, along with information about its popularity, user awareness, and addiction. Also, in Section 4, the analysis of the SEIRS-QA model and the stability of its equilibria are discussed. In Section 5, the theoretical analysis is supported by a set of numerical simulations, which also examine the effects of variables and the impacts of factors in the suggested model. The last section of this study presents the conclusions and the findings.
2. Related Work
The dynamics of social network users are just one of the many real-world issues that mathematical modeling helps us understand and solve. Epidemic models are often used as the foundation for social network analysis research because the rate of social network usage and the spread of diseases are similar. Due to the rise of infectious disease in the 19th century as a topic of general interest, the epidemic model had a significant impact on both daily life and national politics. This model explains how contagious diseases spread from one person to another. The Susceptible-Infected-Removed (SIR) model is the fundamental compartment model of epidemics. In 1927, Kermack and McKendrick developed the SIR model in conjunction with differential dynamic equations [10]. The SIR model is currently the most well-known and widely used model to describe the epidemiological growth of social networks. It can be used to model the transmission of various news and rumors as well as virus infections in computers [11]. In social networks, individuals can exchange or spread information. There is a wealth of latent information that can be extracted from this diffusion process. It has a variety of applications, including market forecasting, rumor suppression, and opinion tracking. Diffusion models and methodologies, however, are essential to the study of these applications [12]. Researchers have developed and analyzed many mathematical models to enumerate the characteristics and dynamics of social network users. With adoption being compared to infection and abandonment being compared to recovery, to examine user adoption and churn in social networks, Cannarella and Spechler used a SIR epidemiological model. [13]. Zhu et al. applied the SIRS epidemic model to demonstrate user adoption and leaving the process in social networks. They anticipated how the demographics of online social networks would change [14]. Infectious diseases and network services have similar growth and decline dynamics. Tanaka et al. explained the growth and decline of social networking services by using the SIR epidemiological model [15]. Proskurnikov and Tempo discussed classical models of dynamic social networks and their relations in multiagent systems [16]. The structure of social networks influences the information diffusion and dynamical behaviors of members. Cai et al. proposed an epidemiological information transmission model in complex social networks [17]. Studying the information diffusion mechanism in advertisements helps to understand information diffusion systems. Jin et al. considered an advertising dynamic model of information diffusion by combining system dynamics and uncertainty theory [18]. Delegge and Wangler used the SIRS model to analyze population changes and the potential for users to stop using Facebook [19]. The SIRS mathematical model of social media popularity was applied by Purwati and Amalia using a typical incidence rate. They looked into the population growth and potential exodus from the social network [20]. Alemneh and Alemu developed a SEARQ mathematical model of social media addiction with an optimal control strategy. They found out how stakeholders and policymakers must implement effective control strategies on the social network over a period of time [21]. To evaluate the part that media reports play in game communication and achieve the best control of online game addiction, Li and Guo produce the SIPQ model with both positive and negative media coverage [22]. They also investigated the stability of online game addiction and considered three kinds of control measures simultaneously to achieve the best effect [23]. Information spread in social networks is similar to the way viruses spread through a population. Sivaraman et al. studied the spread of hashtags over Twitter by using the nature of an epidemiological model [24]. One of the appropriate strategies to control and reduce the risks reduction by users in social networks is to increase user awareness. Chen et al. proposed a model based on population dynamics to study the dynamics of crisis information diffusion in online social networks [25].
Social networks can be compared to an epidemic spreading process. Both users who are carriers of the pathogens and users who are susceptible to the pathogens participate in the transmission of epidemics. The desire to use social networks can spread from the communicator to the recipient in the same way that the virus can spread from infected users to susceptible users. Therefore, it is expected that growth and decline can be explained using epidemiological models. During the transmission of infectious disease, communications and advertisements play a significant role in reporting the characteristics of the disease to ameliorate an individual’s knowledge and change the individual’s behavior. Similarly, in the process of social network usage, there are various reports on social networks, which are different from infectious diseases. Some news and information reports the harm of social network addiction and advocate for the prohibition of social network addiction. At the same time, many activities attract more people’s attention to social networks. To investigate social networks, it makes sense to learn from the basic epidemic models. In this article, we discussed the measurement and approach of social network analysis and its information diffusion model by comparing it to the epidemic model used to represent the spread of infectious diseases.
3. The Model Formulation
In this section, a mathematical model for information diffusion in social networks is proposed. On social networks, users can communicate with their friends. So if needed, they can use existing social networking applications. Since users typically join social networks by receiving invitations from friends who are already members, a practice similar to the spread of infectious diseases, it is logical to apply epidemic modeling to social networks. Users leaving social networks due to a lack of interest in the Internet or awareness of some disadvantages are analogous to receiving immunity against infectious diseases. After some time, users can access social network platforms again as the recovered person is no longer immune. Gender, race, and social status do not affect the likelihood of someone using social networks. Members have the same interaction to the same degree, and the interest of active social network users is transmitted to inactive users when they are in contact with the peer pressure of active individuals. Table 1 shows some abbreviations of models by which social networks can be described. The SEIRS-QA model is developed in the following using an analytical model. The proposed model considers a set of heterogeneous states and the interactions between them, representing how people behave in social networks and information diffusion.
| Model | Explain |
|---|---|
| SI | Susceptible-infected |
| SIS | Susceptible-infected-susceptible |
| SIR | Susceptible-infected-recovered |
| SIRS | Susceptible-infected-recovered-susceptible |
| SEIR | Susceptible-exposed-infected-recovered |
| SEIRS | Susceptible-exposed-infected-recovered-susceptible |
| SEARQ | Susceptible-exposed-addicted-recovered-quitted |
| SEIRSQA | Susceptible-exposed-infected-recovered-susceptible-quitted-addicted |
3.1. The SEIRS-QA Model
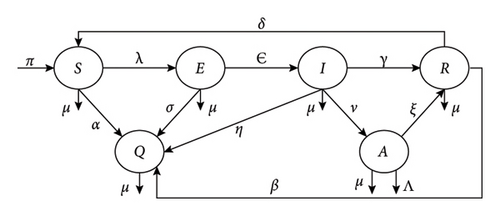
This heterogeneous model is based on dividing the whole population of social network users into six states to model information diffusion in social networks. The SEIRS-QA strategies are introduced, which is referred to as the SEIRS-QA model. The SEIRS-QA social network model is a modified model of the SIR model, which considers a fixed population with only three compartments: susceptible (S), infective (I), and recovered (R). S represents the number of people who are not yet infected with the disease or at risk of contracting it. I represents the number of people who have been infected with the disease and are capable of transmitting the disease to people in the susceptible category. R refers to people who were infected and then freed from the disease either by immunization or by death. Figure 1 shows the flow diagram for the suggested information diffusion in the social network model. In the proposed model, the effects of popularity, addiction, and user awareness of individuals are considered to investigate the dynamic behavior of social network users in information diffusion.
3.2. Model Description
- 1.
Susceptible (S): The individuals who do not currently use social networks but are open to joining as social network users and are susceptible to social network addiction.
- 2.
Exposed (E): Individuals in this group use social networks less frequently but do not progress to the infected stage. That is, they are inactive neither believe nor reject and are reluctant to use social networks. In this state, people have installed applications related to social networks, but they do not have an active account on the networks.
- 3.
Infected (I): The individuals who use social networks more and are in favor of using social networks, but not including social network addicts. They have an active account and can communicate with their friends.
- 4.
Recovered (R): The individuals in this group are not currently members of the social networks. They lost their interest in using but may return to social networks and allow members of the recovered to rejoin the susceptible class. Also, this group of individuals is detached from social network addictions.
- 5.
Quitted (Q): The individuals who delete their accounts on social networks and stop using them permanently. In this state, people have deleted applications related to social networks. Additionally, not everyone has access to social networks or technology.
- 6.
Addicted (A): The individuals who have an addiction to social networks and spend most of their time there.
- 1.
The individuals in state S are not instant users of social networks or are not interested in social networks, which leads to being fans of using social networks. But, they become exposed individuals at a rate λ. Some susceptible people join subpopulations who do not use social networks forever at a rate α.
- 2.
For the individuals in state E, if they are not interested in the type of social network used, they will then enter state Q with rate σ, or if they are in favor of using social networks and welcome that type of platform, they must be transferred to state I with rate ϵ.
- 3.
For the individuals in state I, either through the heavy use of social networks, advertising through friends, and great interest in social networks, they develop an addiction and fall into a state of addiction at rate ν, or come into status R by further taking consciousness through recognizing the shortcomings of that platform or lose their interest with rate γ. The remaining proportion of individuals may lose their Internet or access to social networking platforms and move to the Q at a rate of η.
- 4.
For the individuals in state A, by treatment and increased awareness through education about the dangers of excessive use of social networks and helping people recover, they move to the recovered state with a rate ξ. They may also die due to addiction and excessive use of social networks at a rate of Λ.
- 5.
For the individuals in state R, they are partially restored and can become susceptible to social network users again with rate δ or stop using social networks with rate β.
- 1.
As long as joins and leaves are balanced, the total number of individuals is invariant over time; thus, π = μ, and obviously, we have Nk(t) = Sk(t) + Ek(t) + Ik(t) + Rk(t) + Qk(t) + Ak(t) ≡ 1.
- 2.
The initial conditions for each state are as follows: 0 < Sk ≤ 1, 0 ≤ Ek < 1, 0 ≤ Ik < 1, 0 ≤ Rk < 1, 0 ≤ Qk < 1, 0 ≤ Ak < 1 for any k between m to n and t ≥ 0.
- 3.
The Barabási–Albert (BA) network, which is a heterogeneous network, serves as the foundation for network topology.
- 4.
In the experiments, the number of 1000 individuals is considered (N = 1000).
- 5.
Initially, all individuals are susceptible, apart from the number of social network users as infected individuals (e.g., 100 individuals), acting as the advertisers.
- 6.
Each individual has infectivity and the opportunity to join social networks equal to its degree (k). The probability of a user connection with degree k (m ≤ k ≤ n) to an infected user of the same degree is , where 〈k〉 = ∑kkP(k) is the average connectivity of users. P(k) is the degree distribution where .
| Notation | Description |
|---|---|
| Sk(t) | The number of people who are not SN users but are open to joining as users at time t |
| Ek(t) | The number of people who use SN less frequently at time t |
| Ik(t) | The number of people who use SN more and are in favor of using SN at time t |
| Rk(t) | The number of people who are not currently members of the SN at time t |
| Ak(t) | The number of people who are addicted to SN at time t |
| Qk(t) | The number of people who permanently do not use and stop using SN at time t |
| N | Network size |
| λ | Transmission rate from susceptible users to exposed users |
| α | Transmission rate from susceptible users to quitted users |
| ϵ | Transmission rate from exposed users to infected users |
| σ | Transmission rate from exposed users to quitted users |
| γ | Transmission rate from infected users to recovered users |
| ν | Transmission rate from infected users to addicted users |
| η | Transmission rate from infected users to quitted users |
| δ | Transmission rate from recovered users to susceptible users |
| β | Transmission rate from recovered users to quitted users |
| ξ | Transmission rate from addicted users to recovered users |
| φ | Connection rate and availability to social networks |
| ζ | Unable to access the social networks |
| Λ | The death rate is due to addiction to social networks |
| π | The rate of membership or connection to social networks |
| μ | The proportion of natural deaths that could occur in each state |
3.3. User Awareness
Correct and adequate use of social networks depends on the characteristics of the people who use social networks. User awareness has a significant impact on their resilience to social network addiction. The term “awareness” appears to mean communicating with others about the issue, gaining their attention, and getting them to talk about it. User awareness can enhance the information diffusion process by sharing relevant content and valuable information on social networks. The addictive activities, such as excessive use of social networks, can lead to serious problems in everyday life, in turn affecting society at large. This problem must be mitigated until more serious complications arise than currently expected. Mandatory policies are usually not the right way to inform people. Examining the effects of social network addiction is the best way to approach this. Advertising, consciousness, and education regarding the drawbacks of social networks are considered control techniques. Hence, more user awareness has a greater probability of helping an addicted individual recover and preventing it from spreading to other susceptible social network users. Therefore, the social network addiction model includes a user awareness parameter. We can also consider treatment approaches such as limiting their time spent on social networks, use of psychiatric drugs, and psychological treatments for addicted individuals as user awareness.
In the proposed model, user awareness is indicated with two parameters. (1) The awareness period τ is the length of time that a user is aware of the risks associated with social network addiction. It is assumed that the period of awareness begins at time step T1 and ends at time step T2. So, τ can be presented as τ = T2 − T1. It is supposed that at the same time, all users have the same τ. (2) The awareness function ω(τ, t) represents the level of consciousness of the user during τ. In this case, 0 < ω(τ, t) < 1 if T1 < t < T2 and ω(τ, t) = 0 if t ≤ T1 or t ≥ T2.
The highest level of awareness is shared by all users if ω(τ, t) = 1, and the people’s addiction process to social networks will be stopped (ν(t) = 0).
The period of awareness starts from the T1 time step and ends at the T2 time step. Thus, in this duration, user awareness has a considerable effect in reducing people’s addiction to social networks by considering parameters such as recovery rate γ, quit rate η, and education and treatment rate ξ. Clearly, ω(τ, t) = 0, when all users are not aware of the disadvantages of excessive use of social networks.
3.4. Popularity
Nowadays, through social networks, from wherever they are, users are easily and quickly well-connected and enabled to interact with their friends. Therefore, interest in social networks has increased tremendously worldwide. The popularity of social networks influences the dynamics, patterns, and speed of information diffusion and social influence. The term “popularity” represents the behaviors that individuals adopt in special social network platforms and use a lot. That is the number of friends on a social network that affects users’ influence ability and the extent to which users are influenced by their friends on social networks. The level of popularity has a great influence on the amount of social network usage and people’s addiction to social networks.
Social network users can leave social networks if they do not like the platform and are not interested in having an account on it. Therefore, the state of these individuals will change to a quitted state.
3.5. Addiction
Social networks play a crucial role in our daily lives, and they permeate every aspect of it. In the Internet age and the rise of information and communication technologies, the risk of increasing dependence on digital media and social networks certainly exists. Human individuals and social behaviors play a significant role in addiction to social networks. The term “addiction” is traditionally associated with drug use. But in general, any behavior that gives pleasure can be addictive. Addiction to social networks is something that is so excessive and makes people unable to control themselves.
In the addiction period, the speed of user addiction depends on parameters φ, as the connection rate to social networks, ν, as the rate of social network addiction, and ζ, as the unavailability rate of social networks.
3.6. Model Formulation
In this section, the analytical SEIRS-QA model of information diffusion in social networks is introduced. By taking two additional states called quitted (Q) and addicted (A) into account, this model expands upon the SEIR model. Also, in the analytical SEIRS-QA model, some factors that influence social network usage, such as user awareness, popularity, and addiction, are considered to show the effect of user behavior and dynamics of a heterogeneous network. The SEIRS-QA model is mathematically developed in the following to study the dynamic user behaviors in social networks using continuous-time differential equations.
4. Model Analysis
This section discusses the dynamics analysis of the SEIRS-QA model. The boundedness and feasibility region and the positivity of solutions are examined to ensure that all the solutions will be nonnegative in future times. The equilibria of the proposed model in equation (8) and the basic reproduction number are calculated to analyze the behavior of the social network users. Also, the stability of the free equilibrium point is analyzed. In the following, each of the cases will be discussed.
4.1. Boundedness and Feasible Region
By solving equation (11), N(t) = N(0)exp−μt + (π/μ)(1 − exp−μt), as t⟶∞ and N(t)⟶π/μ. Hence, Sk(t) + Ek(t) + Ik(t) + Rk(t) + Qk(t) + Ak(t) = π/μ, where π = μ. So the biological invariant region is a positive set.
4.2. Positivity of Solutions
4.3. The Equilibrium Points Analysis
| Name | Equivalent |
|---|---|
| ν(1 − ω(τ, t)) | ν(t) |
| (ϵ + f(τ, t)) | ϵ(t) |
| σ(1 − ϵ(t)) | σ(t) |
| ξ(1 − A(τ, t)) | ξ(t) |
| θ |
Since every parameter is positive, the equilibrium is also positive.
Theorem 1. In the proposed SEIRS-QA model in equation (8), there is always a free equilibrium E0 = (π/(α + μ), 0, 0, 0, (απ)/(μ(α + μ)), 0). When R0 > 1 and using social networks persists by users (i.e., Sk(0) ≥ 0, Ek(0) ≥ 0, Ik(0) ≥ 0, Rk(0) ≥ 0, Qk(0) ≥ 0, Ak(0) ≥ 0), the model has a unique endemic equilibrium .
4.4. Basic Reproduction Number
The basic reproduction number (R0) of the proposed model is crucial for analyzing the stability of the equilibrium point, dynamic analysis, and determining whether the epidemic happens in the network. It correlates with the average number of subsequent infections caused by an initial infection during its life cycle. The social network has generally been cleared of addicted users if R0 < 1. However, if the R0 > 1, the social network has experienced an epidemic and addiction is stable. The next-generation matrix method is used to obtain R0.
4.5. Stability Analysis of Equilibria
One of the most important concepts of dynamic systems is stability. The stability condition determines whether a slight deviation from equilibrium will grow or if the model will eventually return to its equilibrium state. Stable equilibria represent the final and lasting conditions of information diffusion in social networks. These points help to understand the final pattern of information diffusion in a network after its initial spread. Understanding these points is effective in analyzing network structure, developing effective communication strategies, and understanding social network behaviors. To study the dynamic behavior of the proposed model, this section investigates the stability of the SEIRS-QA model at the free equilibrium. Local stability applies to a limited region around the equilibrium point and requires initial states sufficiently close to the equilibrium. Global stability applies to the entire state space and is suitable for any initial state. Global stability is more robust and implies that the equilibrium point is unique.
Theorem 2. If R0 < 1, then the free equilibrium E0 of the model is locally asymptotically stable.
Proof 1. The local stability of the SEIRS-QA model is expressed based on the stability theory by the Routh–Hurwitz criterion and the linearization technique. According to this theory of stability for ordinary differential equations, a point of equilibrium is considered locally asymptotically stable if and only if all of the real parts of the eigenvalues of the characteristic determinants of the model’s Jacobian matrix are negative at the equilibrium point. To linearize the model of equation (8), the Jacobian matrix is calculated as follows:
As a result, by the equivalents in Table 3, the Jacobian matrix at the free equilibrium E0 = (π/(α + μ), 0, 0, 0, (απ)/(μ(α + μ)), 0) is as follows:
The matrix’s eigenvalues , for which I and are respectively the identity matrix and eigenvalue, should be obtained. Hence, all the eigenvalues of J(E0) − λI matrix are as follows:
Since all eigenvalues of equation (29) are negative, the model is locally asymptotically stable at the free equilibrium point. Now, the following theorem investigates the global stability at the free equilibrium for the SEIRS-QA model.
Theorem 3. If R0 < 1, then the free equilibrium E0 of the model is globally asymptotically stable.
Proof 2. To demonstrate that the free equilibrium is globally asymptotically stable, we consider the subequation of equation (8) as follows:
By considering equation (20) and for S ≤ N,
Considering that all of the eigenvalues for matrix F − V have negative real parts, the SEIRS-QA model is stable when R0 < 1. When t⟶∞ as (E, I, A)⟶(0, 0, 0). It follows from the comparison theorem that (E, I, A)⟶(0, 0, 0) and S⟶N as t⟶∞. Therefore, E0 is globally asymptotically stable for R0 < 1.
5. Simulation Results and Discussions
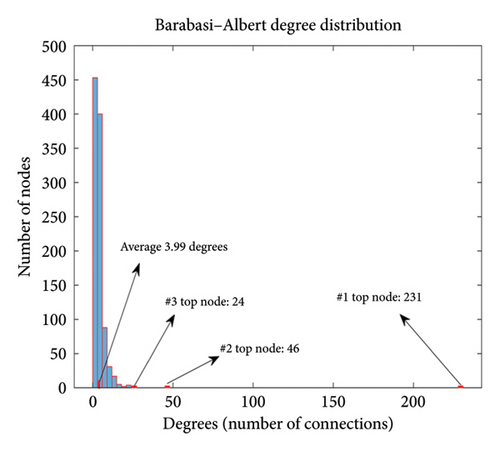
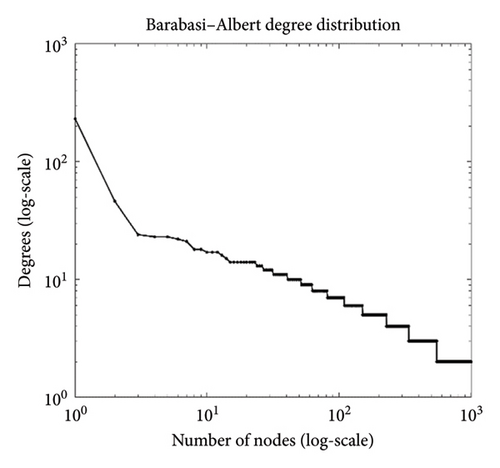
To make inferences about real-life situations, network and disease data should ideally be collected to derive model parameters using appropriate statistical methods to fit the model to real-world situations. A network is made up of nodes and edges. The nodes in our application are users, and the edges represent the type of social relationship between individual pairs. There are several well-known random network models used in mathematics-oriented articles. The SEIRS-QA model is based on the BA topology and shows characteristics of growth and preferential attachment. The network consists of 1000 users with a minimum degree of 2 and a maximum degree of 231. MATLAB is used to perform the numerical simulations.
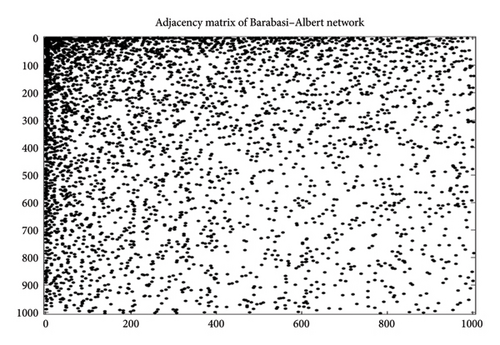
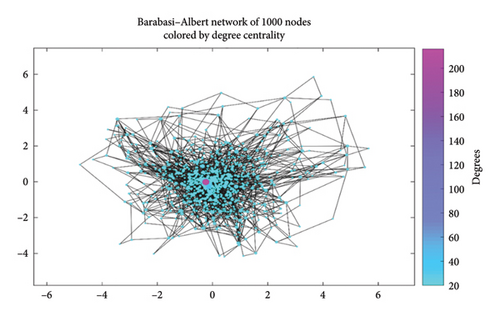
Every network can be mathematically represented by an adjacency matrix, which is the most common way to model data in network analysis and shows the graphical relationships of users in a network. Using the matrix representation of the network, properties of the network, such as degree centrality, can be computed by applying the fundamental concepts of linear algebra. Figure 2 shows the network adjacency matrix created in the SEIRS-QA model. In scale-free networks, most nodes are connected to a small number of neighbors and have a small number of high-degree nodes that provide high network connectivity. The network topology simulated by the BA algorithm with the degree centrality is shown in Figure 3. The degree centrality metric counts the number of connections that a user has in a social network. It also shows who is the most connected and has an important role. Depending on the number of connections, the color can be changed for better viewing. The degree distribution of all nodes in the network helps determine whether the network is scale-free or not.
In the various regions of the global social networks, there are differences in population distribution and social coherence, which play an important role. Figure 4 displays the degree distribution for the BA network as a scale-free network. The degree distribution of nodes in scale-free networks exhibits heterogeneity, as shown in Figure 4. A network is said to be heterogeneous if it contains both a large number of nodes with low degrees and a small number of nodes with very high degrees. In the heterogeneous network topology created by the BA generator to simulate social networks, the node degree distribution follows a power law distribution (P(k) ~ k−v) with powers varying in the range of 2 < v ≤ 3 and has a heavy tail.
According to the proposed model, three factors are essential in regulating and influencing the use of social networks. First, a simulation of the proposed model was conducted without considering the three factors mentioned in Section 3. This section continues by examining how the popularity of a social network affects the frequency with which users engage, the importance of educating individuals about the dangers of excessive social media use to prevent addiction, and how addiction develops as social networks influence conditions and methods of control.
5.1. The Simulation of the Model Without Factors
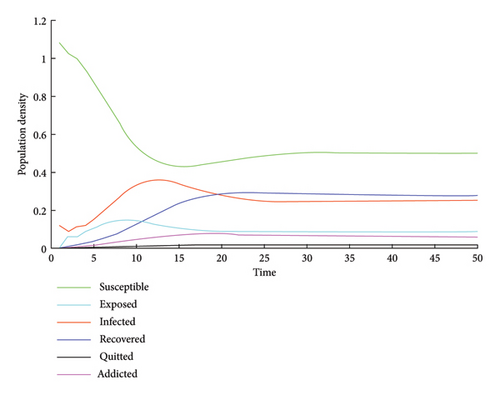
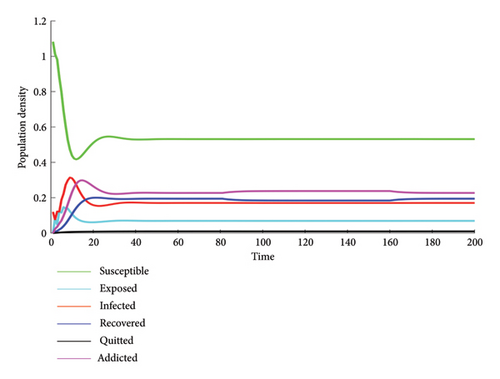
This section presents the results of the proposed model without taking into account user awareness, popularity, and addiction. At first, all users are susceptible to social networks, except 100 random social network users are considered infected. The general trends of the six different states (susceptible, exposed, infected, recovered, quitted, and addicted) are shown in Figure 5. The conditions have been reviewed based on the SEIRS-QA social networks model to simulate the dynamical behavior of the social network users over time, under the parameter set at λ = ϵ = 0.7, α = η = β = 0.001, σ = δ = 0.01, γ = ξ = π = μ = 0.1, ν = 0.05, Λ = 0.0001, and without considering the three mentioned functions. 50 days are planned for the simulation process. By using equation (27) and the values of the parameters, the basic reproductive ratio R0 can be calculated to be 0.4342. As the population change of each state is shown in Figure 5, each curve on the graph is eventually in a stable condition, which is in agreement with Theorem 3 that the model of equation (8) has a free equilibrium point, which is globally asymptotically stable when R0 < 1. In this case, the state of addiction to social networks does not develop and gradually disappears. As shown in the figure, although the number of social network users is increasing, the number of addicted users is under control. Also, the epidemic that is considered here is the overuse of social networks, and addiction does not occur, and addicted users of social networks have recovered.
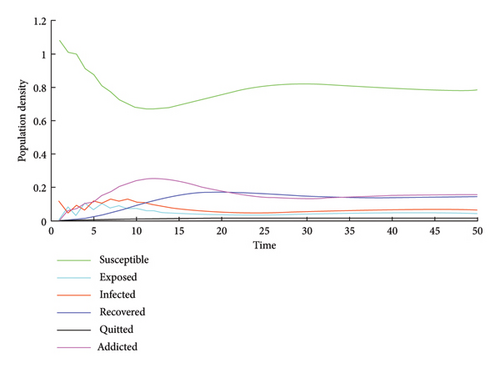
Next, the change of the proposed model with the influence of popularity is analyzed. To simplify the comparison findings, four parameters are selected as follows: λ = ϵ = 0.9, γ = 0.01, ν = 0.5, and the other parameters remain unchanged. The numerical result and the population change of each state are shown in Figure 6. In this case, the value of R0 is 1.3201, and the situation of addiction to social networks will continue and stabilize without human intervention and control.
5.2. The Effects of User Awareness
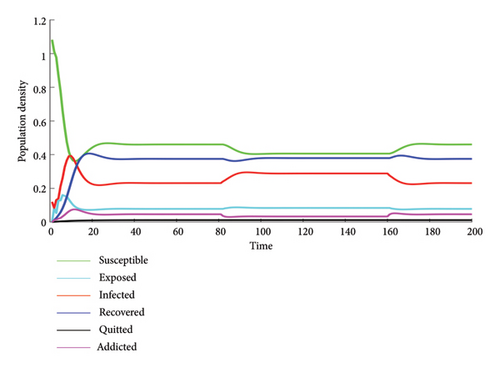
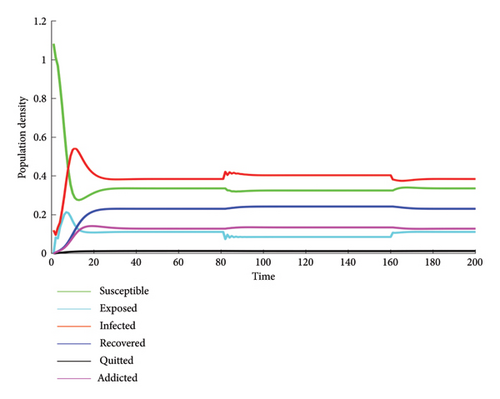
Human behaviors, the awareness of the disadvantages through education, advertising, and treatment, can assist individuals in reducing their preference for using some social networking platforms. This section examines the model properties to understand the impact of user awareness. User awareness plays a significant role in the proposed model and is connected to the prevention and treatment plans. As mentioned in Section 3.3, to investigate the result of awareness in the proposed model to prevent users from addiction or excessive use of social networks, the function of awareness and the time to use this function must be determined. The basic reproductive ratio R0 is 0.5969, which means that there is no epidemic in the form of excessive use or social network addiction. The use of social networks is under control and is in a stable state. Also, the simulation process is set to 200 days, and the time interval of 80 days analyzed for the effects of user awareness is between 80 and 160 days. As shown in Figure 7, in the duration from 80 to 160 days, as the awareness rate of social network users increases, the number of addicted users decreases, and the number of recovered people and social network users increases. Therefore, it can be concluded that by increasing the awareness of users, along with increasing the number of users of social networks, people can be prevented from becoming addicted to social networks. There should be treatment options with low rates of ξ and media awareness campaigns with high rates of γ in societies where peer influence is successful in attracting new social network users. One way to decrease the number of people who use social networks excessively is to improve the effectiveness of media awareness programs.
According to equations (1) and (2), the amount of user awareness depends on some awareness parameters such as recovery rate γ through proper advertising and increasing knowledge, education, and treatment rate ξ and quit rate η. Therefore, the user awareness parameter is defined as U = γ + ξ + η.
The numerical curves of the population density of addicted users with different user awareness parameters U are shown in Figure 8. The number of addicted users decreases as user awareness increases. The impact of each parameter on user awareness has also been calculated. As mentioned, the U parameter consists of three parameters γ, ξ, and η. In Table 4, different values of these parameters for calculating U and R0 are shown. By increasing each of the values of γ, ξ, and η, the value of R0 decreases and the value of U increases.
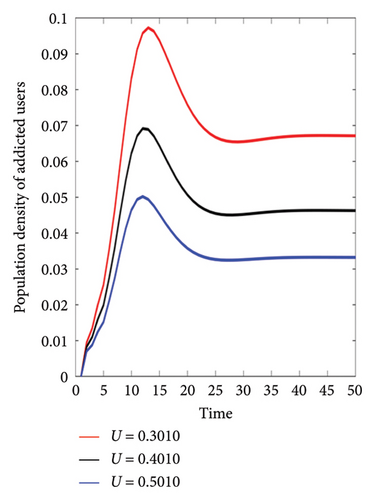
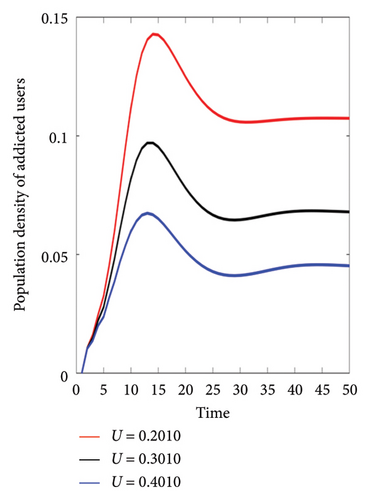
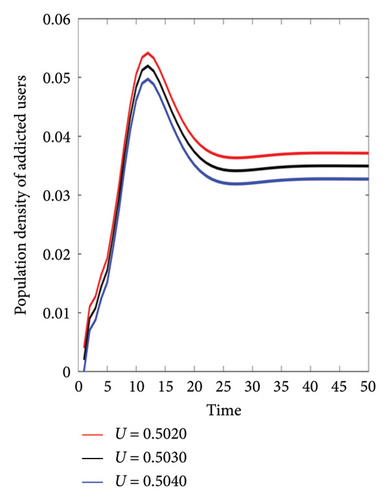
| (a) | γ = 0.1 | η = 0.001 | ξ = 0.4 | γ = 0.1 | η = 0.001 | ξ = 0.3 | γ = 0.1 | η = 0.001 | ξ = 0.2 |
|---|---|---|---|---|---|---|---|---|---|
| U = 0.5010 | R0 = 0.5630 | U = 0.4010 | R0 = 0.6069 | U = 0.3010 | R0 = 0.6362 | ||||
| (b) | γ = 0.1 | η = 0.001 | ξ = 0.1 | γ = 0.2 | η = 0.001 | ξ = 0.1 | γ = 0.3 | η = 0.001 | ξ = 0.1 |
| U = 0.2010 | R0 = 0.9356 | U = 0.3010 | R0 = 0.8256 | U = 0.4010 | R0 = 0.64 | ||||
| (c) | γ = 0.1 | η = 0.002 | ξ = 0.4 | γ = 0.1 | η = 0.003 | ξ = 0.4 | γ = 0.1 | η = 0.004 | ξ = 0.4 |
| U = 0.5020 | R0 = 0.6113 | U = 0.5030 | R0 = 0.6030 | U = 0.5040 | R0 = 0.5938 | ||||
Figure 8 shows the equivalent of each possible state in Table 4. Among the parameters influencing the value of user awareness, the value of the γ parameter is more influential in the value of R0. By reducing the value of U, the value of R0 tends to one and will eventually lead to an epidemic and addiction of users to social networks.
5.3. The Effects of Popularity
In this section, a numerical simulation to investigate the popularity of social network conditions is performed. The parameter values for this simulation are λ = 0.9, ϵ = 0.7, α = η = β = 0.001, σ = δ = 0.01, γ = ξ = 0.05, π = μ = 0.1, ν = 0.05, Λ = 0.0001, ζ = 0.1, φ = 0.5. In this situation, the success rate of promotion and use of social networks is greater than the recovery rate of social network users. On the other hand, people addicted to social networks are under control despite the growing number of social network users. As the popularity of social networks is defined in 3.4, the popularity of social networks has a direct relationship with the amount of social network usage. To check the influence of the popularity of social networks, according to equation (3), the popularity function and the activation time of this function should be determined. In addition, five parameters, which are φ as connection rate to social networks, ζ as unable to access the social networks, ν as the rate of social network addiction, ϵ as popularity rate, and σ as unpopularity parameter and are influential in the popularity of social networks, should be specified. The widely used social network condition is produced by these conditions.
Figure 9 shows the effect of activating the popularity function for the duration of 80–160 days. According to the definition of the function and effective parameters, the number of active users of social networks increases. With the increase in popularity and the addition of users to the infected state, fewer people are exposed and susceptible; meanwhile, the proportion of addicts and those who have overcome addiction increases at nearly the same rate. In the specified duration of time, the value of R0 increased, but finally, all the states went towards stability.
According to the parameters influencing the popularity of social networks, the popularity rate can be defined as P = φ + ϵ + ν. Figure 10 shows the equivalent of each condition in Table 5 for calculating R0 and P according to the changes of each parameter affecting the popularity value. As the simulation results show, with the increase in popularity, the quantity of people using social networks increases and also increases the value of R0. The results obtained from the experiments in Table 5 show that in addition to the influential parameters ϵ and ν in the amount of use of social networks, as the accessibility and communication to social networks increase, the R0 value is enhanced, and the number of users also increases.
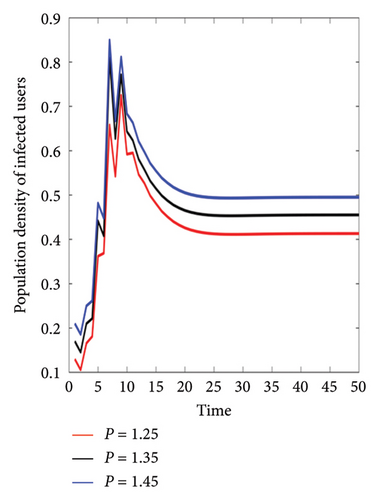
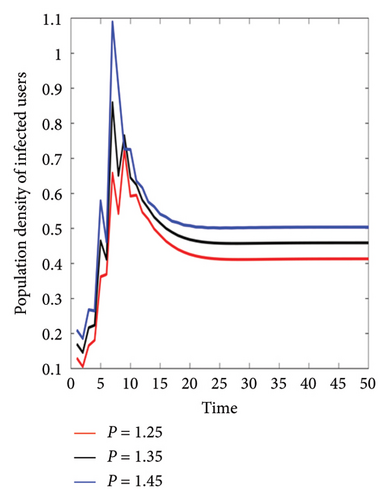
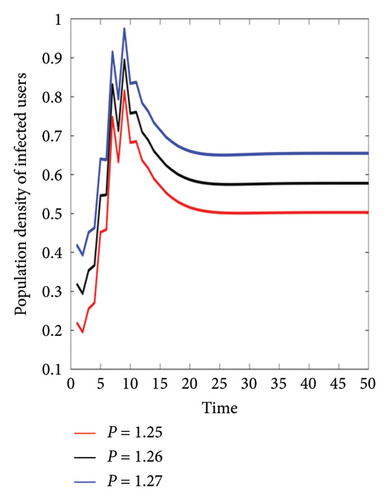
| (a) | φ = 0.5 | ϵ = 0.7 | ν = 0.05 | φ = 0.6 | ϵ = 0.7 | ν = 0.05 | φ = 0.7 | ϵ = 0.7 | ν = 0.05 |
|---|---|---|---|---|---|---|---|---|---|
| P = 1.25 | R0 = 0.4491 | P = 1.35 | R0 = 0.4509 | P = 1.45 | R0 = 0.4524 | ||||
| (b) | φ = 0.5 | ϵ = 0.7 | ν = 0.05 | φ = 0.5 | ϵ = 0.8 | ν = 0.05 | φ = 0.5 | ϵ = 0.9 | ν = 0.05 |
| P = 1.25 | R0 = 0.4491 | P = 1.35 | R0 = 0.4529 | P = 1.45 | R0 = 0.4566 | ||||
| (c) | φ = 0.5 | ϵ = 0.7 | ν = 0.05 | φ = 0.5 | ϵ = 0.7 | ν = 0.06 | φ = 0.5 | ϵ = 0.7 | ν = 0.07 |
| P = 1.25 | R0 = 0.4491 | P = 1.26 | R0 = 0.4708 | P = 1.27 | R0 = 0.4931 | ||||
5.4. The Effects of Addiction
According to the findings, once a high social network usage culture is established, media awareness campaigns and treatment options are less likely to significantly affect the majority of the population. Thus, it is anticipated that their effects will result in addiction.
The dependent variables of this simulation are based on the aforementioned addiction to social networks introduced in Section 3.5, considering each of the parameters as connection rate to social networks φ, popularity rate of social networks ϵ, rate of social networks addiction ν, and unavailability rate of social networks ζ. The basic reproductive ratio R0 is 0.8359, but according to the experiments conducted with the increase of the effective parameters in addiction, this value is more than one, and epidemic conditions are created in a way that all the people of the society are involved with social networks.
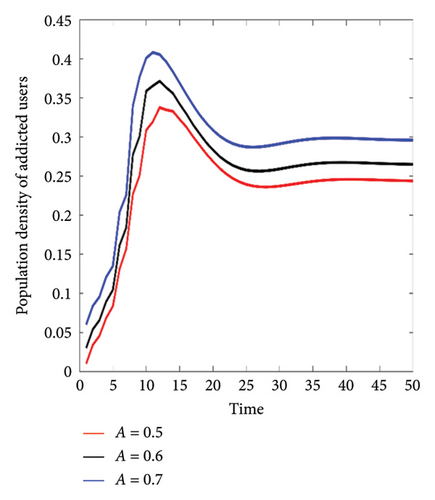
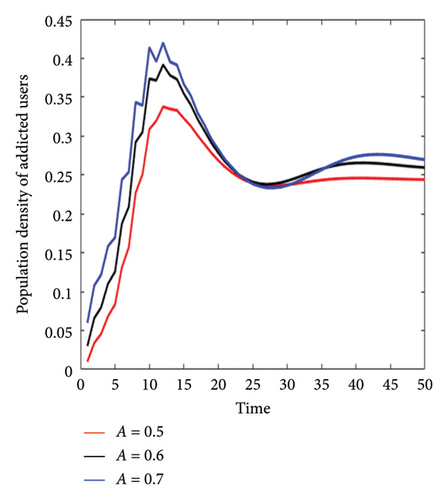
Figure 11 shows the influence of the addiction function in the predetermined time duration. As is evident, the number of addicted people increases during the considered length of time. It is obvious that as social networking addiction worsens, fewer people can recover from it, and the value of R0 rises as well, leading to an epidemic of the disorder.
According to the definition of the addiction function in equation (6), the parameters influencing the amount of addiction have been considered as A = φ + ν, and the effect of changes in each parameter has been examined in Table 6. The curve of changes in the population of addicted users according to each of the states in Table 6 is shown in Figure 12. The simulation results show that as the addiction value increases, the number of users addicted to social networks also increases. Among the factors influencing the amount of addiction, the addiction rate parameter ν in the proposed model has a high effect on increasing R0 and will lead to an epidemic in the excessive use of social networks.
| (a) | φ = 0.3 | ν = 0.2 | φ = 0.4 | ν = 0.2 | φ = 0.5 | ν = 0.2 |
|---|---|---|---|---|---|---|
| A = 0.5 | R0 = 0.8533 | A = 0.6 | R0 = 0.8564 | A = 0.7 | R0 = 0.8591 | |
| (b) | φ = 0.3 | ν = 0.2 | φ = 0.3 | ν = 0.3 | φ = 0.3 | ν = 0.4 |
| A = 0.5 | R0 = 0.8533 | A = 0.6 | R0 = 1.0887 | A = 0.7 | R0 = 1.3230 |
6. Conclusions
Information diffusion in social networks is influenced by various factors, which have been investigated in the introduced SEIRS-QA states called the SEIRS-QA model. According to the research and discussion results, the use of social networks and information diffusion can be investigated from three perspectives, including user awareness, popularity, and addiction. In the proposed model, the impact of each factor on the dynamic behavior of users and information flow in social networks, the standard incidence rate, and the dynamics of the model are examined. Furthermore, the existence of equilibrium points, the calculation of the basic reproductive ratio (R0), and the stability of the free equilibrium point are analyzed.
The numerical simulation based on the BA network model with power-law degree distribution, which is appropriate for the topology of social networks, is studied after defining the functions and parameters related to each of the factors, introducing each of the states, and analyzing the model. The simulations are analyzed in two modes, one without considering the influencing factors and the other with the three factors of user awareness, popularity, and addiction separately. Also, in addition to examining the effects of each function related to the factors in general, experiments are conducted over specific lengths of time.
Based on the parameters influencing the respective values of user awareness, popularity, and addiction in the R0, the conditions for the transformation of social networking usage into an epidemic and excessive pattern in information diffusion are examined. The simulation results show that the dynamics of the model are controlled by R0 and the corresponding value of each factor. Also, the results show that each of the policies used to control information diffusion in social networks, such as education, treatment, advertising, and accessibility, is effective, and there are different behaviors and solutions between excessive use of social networks and addiction to social networks. Based on the simulation results, these parameters and factors are crucial in controlling information diffusion in social networks. Selecting appropriate control and security policies, using suitable models for each situation and network, and examining the role of network structure in the dynamics of information dissemination and flow mechanisms in social networks are among the relevant future work items.
Conflicts of Interest
The authors declare no conflicts of interest.
Funding
No funding was received for this manuscript.
Open Research
Data Availability Statement
The data used in this paper consist of synthetic network generated using the Barabási–Albert model. The generation code and configuration details are available from the authors upon reasonable request. No real-world or third-party datasets were used.


