The Chicken Gut Metagenome at Different Egg-Laying Stages and Its Correlation With Egg Production Performance
Abstract
To investigate the investigation of gut microbial communities to chicken egg production performance during different laying stages, we conducted a comparative study of the diversity, composition, and function of microbial communities in the fecal and cecal contents of six hens at the early stage, 25 at the peak stage, and 15 at the late stage. We obtained clean data averaging 13.40 and 13.79 Gb for each of the fecal and cecal content samples. The metagenomic analysis revealed significant differences in fecal and cecal content microbial diversity during different laying stages, especially during the peak stage, and the microbiota structure of fecal contents was more stable compared to that of cecal contents. The dominant microflora in the fecal contents during the peak stage were Firmicutes (74.84%) and Lactobacillus (28.13%). The dominant microflora of cecal contents during different stages were basically the same at the phylum level and genus level. During the peak stage, the dominant bacteria shared by microorganisms in the fecal and cecal contents were Lactobacillus. Functional analyses of the gut microbiome indicate that fecal and cecal content microbes have different functional capacities at different egg-laying stages. We therefore hypothesized that the gut microbiome would vary with laying stage and have a non-negligible effect on egg production performance. These results improved our ability to provide some theoretical basis for feeding management of laying hens during different laying stages and provided insights into the influence of the gut microbiota on the laying performance of chickens.
1. Introduction
In recent years, the gut microbiota has gained increasing recognition as a crucial factor in the well-being and performance of animals [1, 2]. The gut microbiota of chickens forms a complex ecosystem, and the composition and function of these microbial communities can significantly impact various aspects of host physiology, including gut health, growth, and reproductive performance [3, 4]. For example, Lactobacillus strains are present in the chicken gut microbiota and are involved in enhancing the host’s immune response [5]. Poultry production is often linked to a high prevalence of Salmonella and Campylobacter contamination, making poultry a major source of human infection [6–8]. Numerous studies have shown that gut microorganisms can significantly influence chicken performance [9, 10]. For example, the addition of lactic acid bacteria supplements to feed can increase hen egg production [11]. Similarly, the inclusion of Bacillus coagulans also significantly enhances egg production in hens [12]. Additionally, previous research has highlighted differences in gut microbial communities between high-yielding and low-yielding chickens [13, 14], and the egg-laying rate (LR) of low-yield layers can be improved by transplanting them with fecal microbiota from high-yield layers [13]. The highest diversity of microorganisms within the chicken gut is found in the cecum and is associated with many health-related functions [15, 16]. Microbial metabolites in the chicken gut also affect egg quality, particularly short-chain fatty acids (SCFAs) [17]. SCFA-induced improvements in intestinal structure favor calcium absorption, increase calcium deposition into the eggshell, and improve shell thickness [18]. It was also shown that Salmonella enteritidis is able to enter the oviduct from the cloaca and affect the egg-laying performance parameters, leading to a decline in egg quality of laying chickens [19]. Salmonella enterica infection affects the development of granulosa cells in hens and further reduces egg production [20]. Wang et al. [21] showed that the addition of Clostridium butyricum to the ration during the late laying period of laying hens can change the gut microbiota of laying hens, which in turn improves the color of egg yolks and improves feed efficiency.
The gut microbiota of chickens is a dynamic ecosystem that undergoes continuous succession to maintain a balance [22]. The microbial composition of the chickens’ intestines is influenced by age, as well as factors such as genetics, diet [23, 24], and rearing conditions [25]. Many studies have demonstrated that the composition of the gut microbiome changes with the age of the host [26]. Initially, Proteobacteria are the dominant microbiota in the cecum of chickens, followed by Firmicutes in the later stage [27]. Lactobacillus species are the most abundant bacteria in the ileum throughout the production period [5]. The composition of the gut microbiota fluctuates significantly before the laying period and becomes relatively stable and more diverse [28] during the laying period, which may be related to the management system of laying hens. Current research on the succession of gut microbes in chickens mainly focuses on broilers [29–31]. As chickens age, more stable species gradually replace previous ones through successive substitutions [32]. Understanding the changes in bacterial groups and their functional capacity is important in establishing links between performance and health, as these changes have been associated with the health status of the hosts [33, 34].
However, there have been relatively few systematic studies on the gut microbiota of laying chickens during different laying stages (early, peak, and late laying stage). Therefore, in this study, we used metagenomic sequencing technology to comparatively analyze the compositional structure and functional characteristics of the fecal and cecal contents of laying chickens, as well as their dynamic changes over the laying stage. The contribution of gut microflora to the egg production performance of laying chickens was further explored to provide some theoretical basis for the feeding management of laying chickens during different laying stages and to provide new insights into the way gut microorganisms affect the egg production performance of chickens. In addition, by exploring how specific gut microbial communities affect the physiological functions of laying chickens, such as immune function, nutrient intake, and metabolic balance, we aim to improve their production performance, which in turn provides a more scientific basis for the development of healthy rearing and disease prevention and control strategies for laying chickens.
2. Materials and Methods
2.1. Animals and Sample Collection
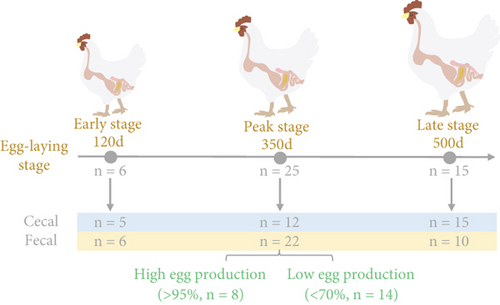
The study was conducted on a common flock of pink shell-laying hens that were reared on an experimental poultry farm located at Sichuan Agricultural University in Ya’an, Sichuan, China. All chickens were individually housed in pens. Feed intake was managed daily following standard farm practices, while water was available to the hens without restriction. The egg production count was continuously recorded from the age of their first egg-laying for healthy chickens. Based on Figure 1a, fresh fecal samples were randomly collected from six healthy hens at 120 days of age, 25 hens at 350 days of age (peak stage), and 15 hens at 500 days of age. Among the 350 days of age hens, fecal samples from eight hens were assigned to the high egg production group (> 95% egg-LR), while fecal samples from 14 hens were assigned to the low egg production group (< 70% egg-LR) based on their egg-LR. Subsequently, the chickens were euthanized, and the contents of their cecum were collected as soon as possible. All collected samples are stored at −80°C for subsequent metagenomic analysis.

2.2. Egg-Laying Performance Parameters
To calculate the egg-LR, record the number of eggs produced daily, LR (%) = total number of eggs/laying hens number/days (d) × 100.30; eggs were randomly collected from both the high and low egg-LR groups to determine egg quality. As for egg quality measurement, each egg was individually weighed (EW), and the egg production data were recorded as follows: egg shape index (ESI) = longitudinal diameter (cm)/transverse diameter (cm); yolk ratio%(YR) = egg yolk mass (EYM) (g)/egg mass (EM) (g) × 100; eggshell mass (ESM); eggshell thickness (ET); and eggshell strength (ESS) (Model-II, Robotmation, Tokyo, Japan).
2.3. Metagenomic Sequencing
Total fecal genomic DNA was extracted from each fecal sample using the Fecal Genomic DNA Extraction Kit (Tiangen Biotech, Beijing, China) following the manufacturer’s protocol. A 1% agarose gel analysis was performed to monitor DNA degradation and contamination in the extracted samples and measured with the Qubit DNA Assay Kit on a Qubit 3.0 Fluorometer (Invitrogen, United States) to determine DNA concentration.
We used 0.2 μg DNA in each sample as the material for the construction library. The genomic DNA samples were fragmented into approximately 350 bp fragments using a Covaris ultrasonic breaker, which was then used to construct a library for the gut microbiota of hens. The library preparation process involves DNA fragment modification, adapter linkage, and PCR amplification. After the library construction was completed, it was initially quantified and diluted using Qubit 3.0. Subsequently, the library is then detected using Agilent 2100 to confirm the expected insert fragment size. If the size matches the expectation, Q-PCR was employed to accurately quantify the effective concentration of the library, following purification of the PCR products by AMPure XP system (Beckman Coulter, Beverly, United States) and accurate quantification by real-time PCR (3 nM). The index-coded samples were clustered on a cBot Cluster Generation System following the manufacturer’s instructions. Sequencing was then performed using DNBSEQ-T7.
2.4. Data Processing
After sequencing was completed, the raw data underwent quality control using fastp software (https://github.com/OpenGene/fastp, Version 0.20.0). Reads that were less than 50 bp in length, with an average mass of under 20, or containing N bases, were removed. Host reads were removed using BWA (http://bio-bwa.sourceforge.net); the reads were aligned to the host genome sequence, and reads with high similarity were excluded to obtain contamination-free reads for further analysis.
The results were subjected to open reading frame (ORF) prediction using MEGAHIT software [35] (https://github.com/voutcn/megahit, Version 1.1.2). Contigs equal to or longer than 300 bp were kept [36]. The contigs were predicted using Prodigal software [37] (https://github.com/hyattpd/Prodigal, Version 2.6.3), and genes with a length of 100 bp or greater were selected. The predictions were clustered using CD-HIT software [38] (http://www.bioinformatics.org/cd-hit/, Version 4.6.1) with default parameters (90% identity and 90% coverage) to obtain a gene directory. The high-quality reads from the samples were matched with the obtained gene catalog (default parameter: 95% identity) to quantify the abundance information of the genes using SOAPaligner software [39] (http://soap.genomics.org.cn/).
2.5. Analysis of Species Composition and Function
The gene catalog was compared with the NR database using BLASTP [40] (BLAST Version 2.2.28+, http://blast.ncbi.nlm.nih.gov/Blast.cgi), with an expectation E-value of 1e − 5, to obtain species annotation results and construct abundance tables. Functional annotation of the gene catalog was performed by comparing it with the gene database of KEGG [41] (Kyoto Encyclopedia of Genes and Genomes, http://www.genome.jp/kegg/) using KOBAS 2.0 [42] (Kyoto Encyclopedia of Genes and Genomes Orthology-Based Annotation System). The abundance of carbohydrate-active enzymes (CAZy) was determined by comparing the gene catalog with the CAZy [43] (http://www.cazy.org/, Version 5.0) database using hmmscan. Contigs were annotated using Diamond (Version 2.0.13) against the CARD [44] (comprehensive antibiotic resistance database, http://arpcard.Mcmaster.ca, Version 1.1.3) and VFDB [45] (virulence factor database) (http://www.mgc.ac.cn/VFs/, Version 2.2.28+). The ARG (antibiotic resistance gene) and VFG (virus factor gene) were identified by searching against a database with a cut-off E-value <1e − 5.
2.6. Statistical Analysis
The Bray–Curtis distance used for beta diversity was calculated and visualized with principal coordinate analysis (PCoA). Biomarkers with significant variation between groups were identified using linear discriminant analysis effect size (LEfSe). Analysis of functional pathways with significant differences was conducted using STAMP 2.1.3 and the Metastats method.
3. Results
3.1. Metagenomic Sequencing and Gene Prediction
We performed sequencing on fecal and cecal content samples from hens of varying ages and obtained an average of 13.48 Gb of raw data per fecal sample. For cecal content samples, an average of 13.84 Gb of raw data per sample was obtained. After quality control, we obtained clean data averaging 13.40 and 13.79 Gb for the fecal and cecal content samples, respectively (Table S1). After analysis, we identified 22,583,738 contigs and predicted 35,530,840 ORFs (Table S2). For further analysis, 5,512,723 genes were classified into a nonredundant gene catalog, with an average length of 590.96 bp.
3.2. Microbial Diversity of the Gut Microbiota of Chickens During the Laying Period
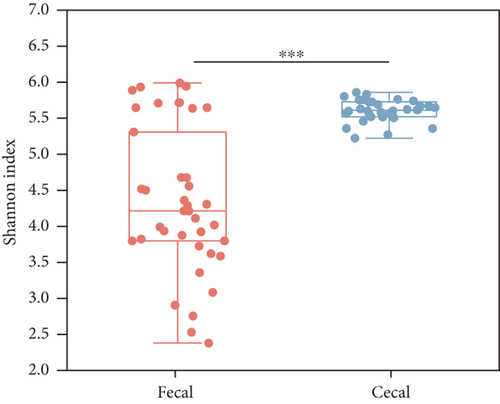
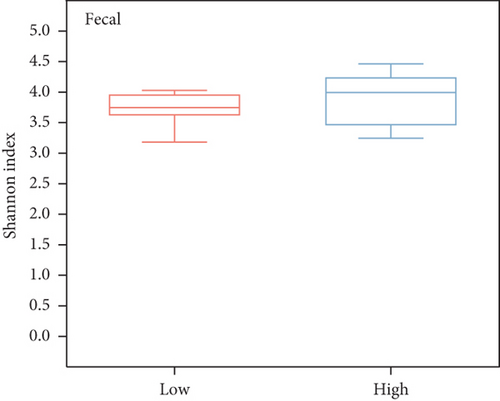
To investigate the community diversity of the chicken gut microbiota, we calculated two distinct measures of alpha diversity at the species level. According to the Shannon index, which considers both the evenness and richness of species, the overall evenness and richness of the cecal contents is significantly higher than that of the fecal contents (Wilcoxon’s rank sum test, p < 0.01, Figure 1b); as for the Chao1 index, there is no significant difference between them (p > 0.05, Figure S1A). Among the three different egg-laying stages, the cecal content samples exhibited a significantly higher Shannon index compared to the fecal samples only at the peak stage (p < 0.001, Figure 1c), but no significant difference was observed in the Chao1 index (p > 0.05, Figure S1B). Analysis of the dynamics of microbial diversity in fecal and cecal contents over the laying stages showed that microbial diversity in fecal contents tended to decrease and then increase over the stage, being lowest at the peak stage and highest at the last stage and differing significantly from the peak stage (p < 0.05, Figure S1C). The diversity of microorganisms in the cecal contents increased progressively with the stage of laying and differed significantly between the peak and late stages (p < 0.05, Figure S1C). A similar trend is observed in the Chao1 index (Figure S1D). No statistically significant difference was observed between fecal samples from high- and low-yielding chickens (p > 0.05, Figure 1d). In summary, the diversity of microorganisms in the fecal and cecal content microorganisms of chickens varied considerably during the laying stage, especially during the peak stage, and fecal microorganisms were the least diverse during this stage.
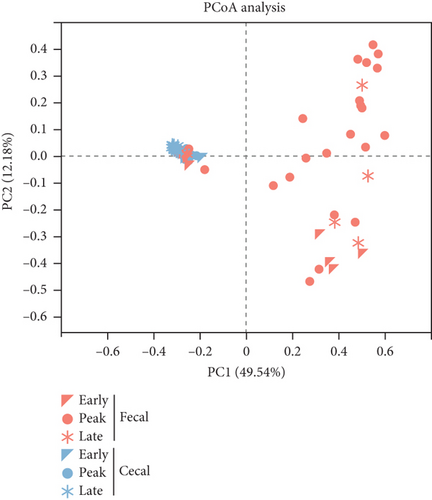
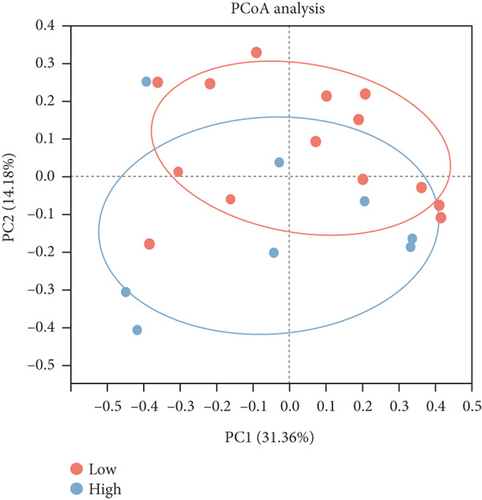
To compare the differences in microbiome composition between samples, we used the Bray–Curtis distance metric to calculate dissimilarities at the species level. Subsequently, we performed a PCoA to examine the beta diversity among the samples. The PCoA plot illustrated the variations in microbiome composition between fecal and cecal content samples across all three stages of the study, and ANOSIM confirmed this distinction (p < 0.05, Figure 1e). Compared to the other two stages, the difference between fecal and cecal content samples was smallest at the early stage (R = 0.29, p = 0.04) and largest at the peak stage (R = 0.63, p = 0.001, Table S3). Analysis of the dynamics of the composition of microorganisms in fecal and cecal contents with the stage of laying showed that fecal microorganisms were significantly segregated only during the peak and late stage (R = 0.18, p < 0.05, Figure S1E). In contrast, microorganisms in the cecal contents were significantly segregated in all three stages (p < 0.05, Figure S1F and Table S4). This suggests that the fecal microbial composition was more stable throughout the laying stage. Subsequently, we observed no significant separation in the microbial communities within the fecal contents of both high- and low-yielding chickens (p > 0.05, Figure 1f and Table S5).
3.3. Discriminative Characteristics of Microbiota in Different Sites, Stages, and Egg-LR Statuses of Chickens
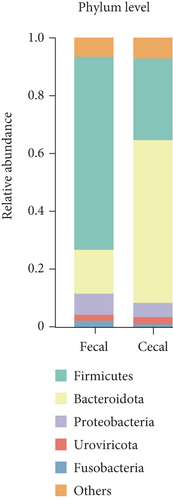
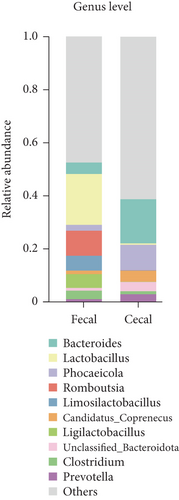
In the subsequent taxonomic analysis, we focused on the bacterial community composition at the phylum and genus levels. The Top 5 phyla observed in both fecal and cecal content samples were Firmicutes (66.7% in fecal contents and 28.19% in cecal contents), Bacteroidota (15.15% in fecal contents and 56.22% in cecal contents), Proteobacteria (7.27% in fecal contents and 4.92% in cecal contents), Fusobacteria (2.23% in fecal contents and 0.97% in cecal), and Uroviricota (2.06% in fecal contents and 2.46% in cecal contents) (Figure 2a). In fecal contents, Lactobacillus (19.18%) was identified as the most abundant genus, followed by Romboutsia (9.47%). In cecal contents, Bacteroides (16.64%) was the most abundant genus, followed by Phocaeicola (9.57%) (Figure 2b).
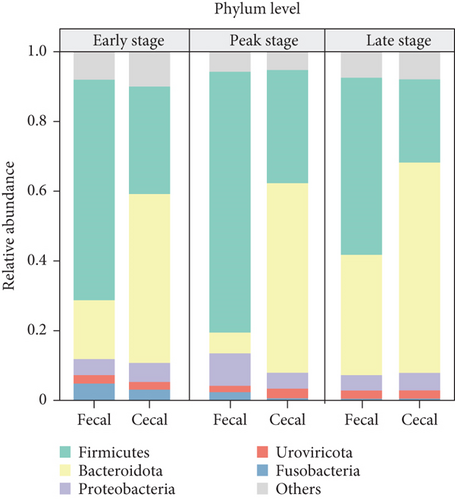
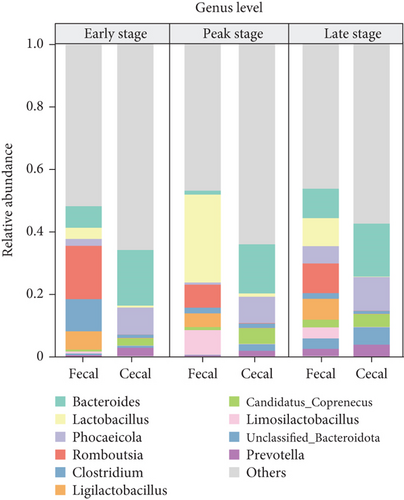

Additionally, we conducted a detailed examination of the bacterial community composition in fecal and cecal contents at three different stages. The dominant fecal bacteria in both early and late stages were Firmicutes and Bacteroidota, while the dominant fecal bacteria in peak laying fecal contents were Firmicutes (74.84%) and Proteobacteria (9.29%), and the relative abundance of Firmicutes had the highest relative abundance during the peak stage. The dominant bacterial flora in the cecal contents was consistent across different laying stages, with both Bacteroidota and Firmicutes, with the relative abundance of Bacteroidota (60.3%) being highest in the late stage, and that of Firmicutes (32.47%) being highest at the peak stage (Figure 2c).
Among the Top 10 genus levels, the most dominant bacterial group in the fecal contents at the early and late stages was Romboutsia, and the percentages were 17.06% and 9.48%, whereas the dominant bacterial group in fecal contents during the peak stage was Lactobacillus (28.13%) and Limosilactobacillus (7.89%). The dominant flora of cecal contents at different laying stages was the same, both Bacteroides and Phocaeicola, with Bacteroides (17.78%) having the highest relative abundance at the early stage and Phocaeicola (10.78%) having the highest relative abundance at the late stage (Figure 2d).
In addition, we analyzed the dynamics of the relative abundance of the Top 10 genera in fecal and cecal contents over the laying stage. The results showed that the relative abundance of Gram-negative bacteria in fecal contents, such as Bacteroides, Phocaeicola, unclassified_p_Bacteroidota, and Prevotella, showed a decreasing and then increasing trend, with the lowest relative abundance at the peak stage. The dynamics of these genera in the cecal contents was similar to the trend in the fecal contents (Figure S2A, C, I, J). Both Lactobacillus and Limosilactobacillus belong to the Lactobacillus. The relative abundance in fecal contents all showed a trend of increasing and then decreasing, with the highest relative abundance at the peak stage (Figure S2B, H). The relative abundance of Gram-positive bacteria in fecal contents, such as Romboutsia and Ligilactobacillus, both showed a trend of decreasing and then increasing, and the relative abundance was lowest at the peak stage (Figure S2D, F). The relative abundance of Clostridium in the fecal and cecal contents varied the most in the early stages (Figure S2E). In summary, the composition of microorganisms in the fecal and cecal contents varied at the phylum and genus levels during different laying stages, with fecal dynamics varying more widely and showing regular dynamics as the laying stage progressed.
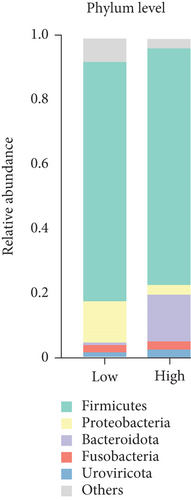
The bacterial community composition at the phylum level of high- and low-yielding chicken fecal samples is depicted in Figure 2e. It was noted that Bacteroidota (14.67%) was more prevalent in high-yielding chicken fecal contents, whereas Proteobacteria (3.06%) exhibited lower prevalence. At the genus level, the analysis showed that high-yielding chickens had higher levels of Lactobacillus (36.09%) and Bacteroides (3.07%). In contrast, low-yielding chickens showed higher levels of Limosilactobacillus (11.73%), Enterococcus (6%), and Turicibacter (2.18%) (Figure 2f).
3.4. Site, Stage, and Egg-LR–Associated Microorganisms in Chicken
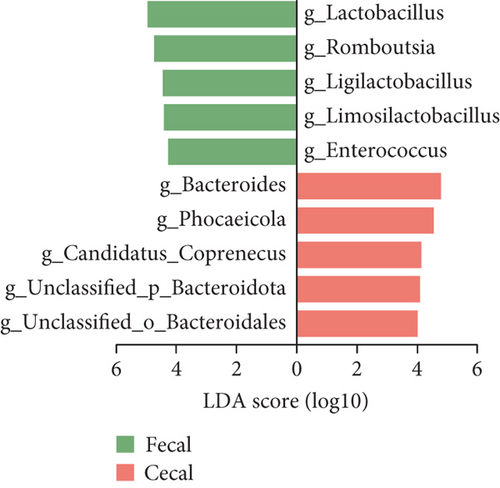
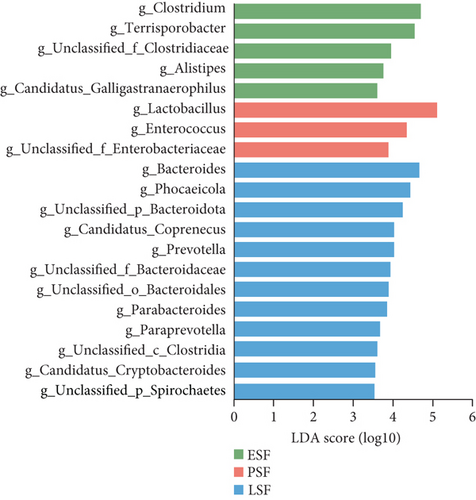
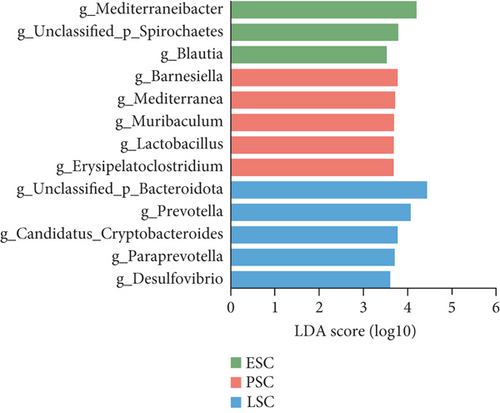
We then utilized LEfSe to identify taxa with significantly different abundances across the groups (Figure 3). We detected 10 genera that exhibited significant differences between the fecal and cecal content samples with LDA score > 4 (Figure 3a). The fecal samples exhibited higher abundances of Lactobacillus, Romboutsia, Ligilactobacillus, Limosilactobacillus, and Enterococcus. Meanwhile, the cecal content samples demonstrated higher levels of Bacteroides, Phocaeicola, Candidatus_Coprenecus, unclassified_Bacteroidota, and unclassified_Bacteroidales. Furthermore, we identified biomarkers in fecal samples from three different stages, with LDA scores > 3.5 (Figure 3b). In the early stage, Clostridium, Terrisporobacter, unclassified_Clostridiaceae, Alistipes, and Candidatus_Galligastranaerophilus exhibited higher abundances. In the peak stage, Lactobacillus, Enterococcus, and unclassified_Enterobacteriaceae exhibited higher abundances. In the late stage, Bacteroides, Phocaeicola, unclassified_Bacteroidota, Candidatus_Coprenecus, Prevotella, unclassified_Bacteroidaceae, unclassified_Bacteroidales, Parabacteroides, Paraprevotella, unclassified_Clostridia, Candidatus_Cryptobacteroides, and unclassified_Spirochaetes exhibited higher abundances. Biomarkers were identified in the cecal content samples for three different stages, as shown in Figure 3c (LDA scores > 3.5). In the early stage, Mediterraneibacter, unclassified_Spirochaetes, and Blautia exhibited higher abundances. In the peak stage, Barnesiella, Mediterranea, Muribaculum, Lactobacillus, and Erysipelatoclostridium exhibited higher abundances. In the late stage, unclassified_Bacteroidota, Prevotella, Candidatus_Cryptobacteroides, Paraprevotella, and Desulfovibrio exhibited higher abundances. The dominant bacteria shared by microorganisms in the fecal and cecal contents during the peak stage were Lactobacillus, and the dominant bacteria shared by microorganisms in the fecal and cecal contents during the late stage were Prevotella and Paraprevotella.
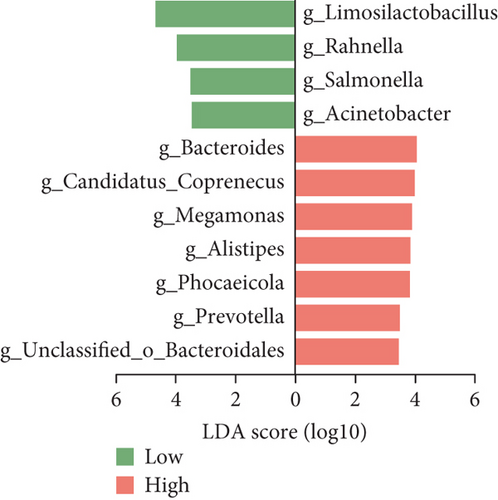
When characterizing the fecal samples of high- and low-yielding chickens, we observed higher abundances of Bacteroides, Candidatus_Coprococcus, Megamonas, Alistipes, Phocaeicola, Prevotella, and unclassified_Bacteroidales in the high-yielding chickens. Conversely, the low-yielding chickens exhibited higher levels of Limosilactobacillus, Rahnella, Salmonella, and Acinetobacter (Figure 3d). We conducted a comparison of egg production performance parameters between high- and low-yielding chickens and correlated them with biomarkers (Figure S3A–H). The results revealed that the egg weight and the EYM from high-yielding chickens were significantly lower than those of low-yielding chickens. Additionally, the ESS of high-yielding chickens was significantly higher than that of low-yielding chickens. We then correlated these egg production performance parameters with biomarkers of high- and low-yielding chickens (Figure S3I).
3.5. Comparison of Functional Capacities of Microbial Communities in Different Sites, Stages, and Egg Production States of Chicken
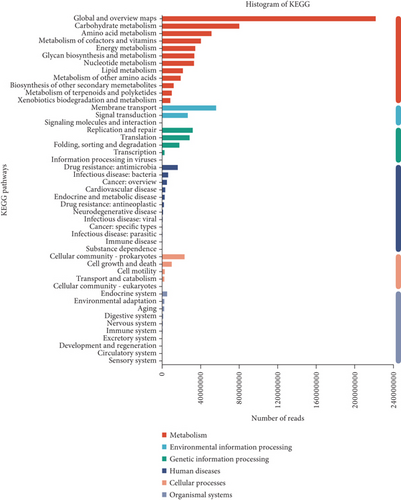
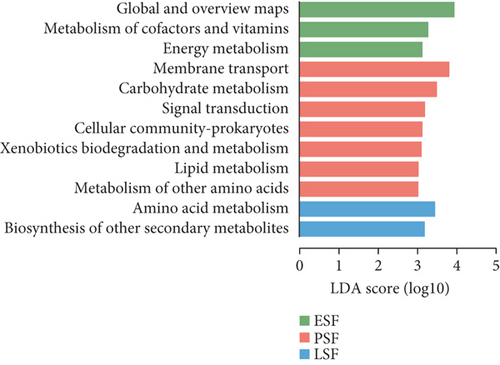
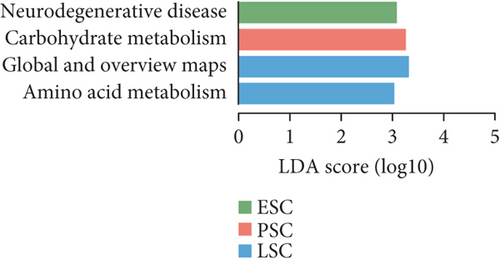
To gain functional insights into the diversity of the microbiome, we annotated the genes based on four functional databases. Initially, when the gene catalog was aligned to the KEGG database, 12,445 Kos (KEGG orthologs) were identified and assigned to 47 KEGG Level 2 categories (Figure 4a). We used LEfSe to identify potential biomarkers that differentiate the functional characteristics between the fecal and cecal content samples (LDA score > 3, Figure S4A). The fecal contents in peak stage showed higher enrichment in membrane transport, carbohydrate metabolism, signal transduction, cellular community-prokaryotes, xenobiotics biodegradation and metabolism, lipid metabolism, and metabolism of other amino acids (LDA score > 3, Figure 4b). Additionally, carbohydrate metabolism in the peak stage contents was significantly enriched (LDA score > 3, Figure 4c). We were significantly enriched for carbohydrate metabolism in both fecal and microorganisms in the cecal contents during the peak stage. Furthermore, it was observed that high-yielding chickens exhibited a high enrichment in glycan biosynthesis and metabolism, drug resistance, antimicrobial, and cell growth and death (LDA score > 3, Figure S4B).
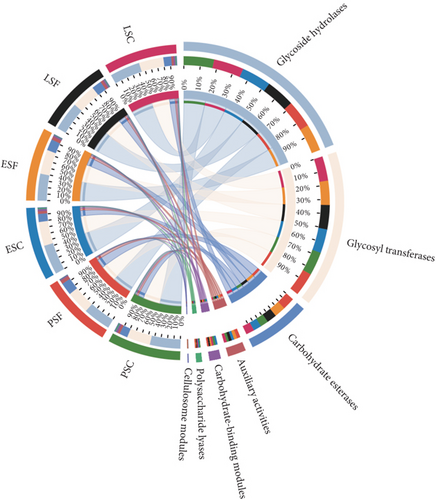
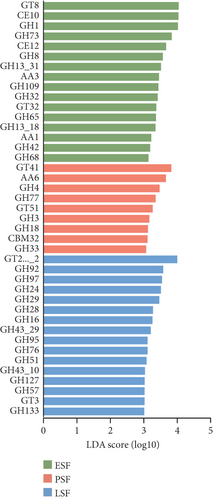
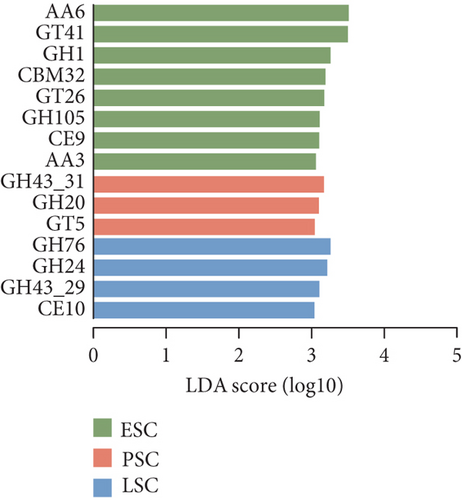
Secondly, we annotated the gene catalog to the CAZy database, allowing us to classify the sequences into seven enzyme classes and 606 families (Figure 5a). At the enzyme family level, we performed LEfSe analysis and identified 13 CAZy that were more abundant in the fecal contents and eight CAZy that were more abundant in the cecal contents (LDA score > 3.5, Figure S4C). GT41 predominated in the fecal contents during the peak stage, followed by AA6 and GH4 (LDA score > 3, Figure 5b). Figure 5c illustrates CAZy with higher expression in cecal content samples at three different stages, where GH43_31, GH20, and GT5 were more enriched in the peak cecal content samples (LDA score > 3); GH1 and AA3 were significantly enriched in both fecal and microorganisms in the cecal contents at the early stage; and GH76, GH24, and GH43_29 were significantly enriched in both fecal and microorganisms in the cecal contents at the late stage. LEfSe analysis of high- and low-yielding chicken fecal contents then revealed that GH97 and GH92 were more enriched in the high-yielding chickens (LDA score > 3, Figure S4D).
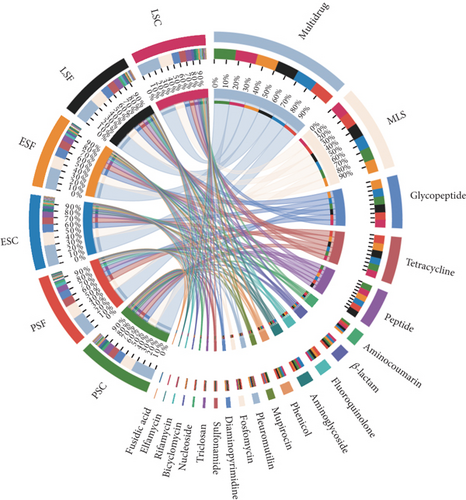
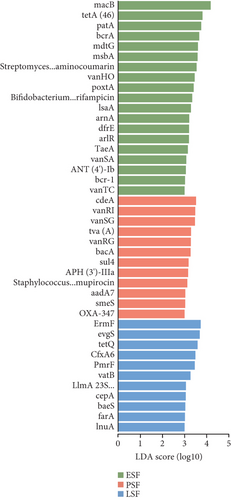
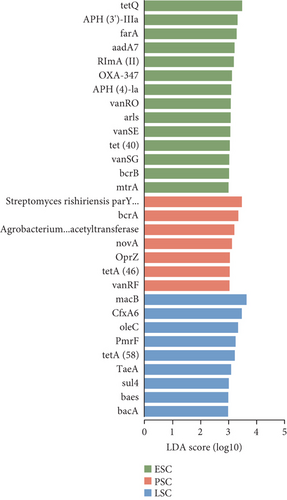
We also used the CARD resistance gene database to align the gene sequences and annotate resistance genes, identifying 21 antibiotic classes and 920 ARGs (Figure 6a). Further analysis of the differences between the fecal and the cecal content samples was conducted using LEfSe (LDA score > 3.5, Figure S5A). When comparing the fecal samples from the three stages, the enriched ARGs in the fecal contents were predominantly found in the peak stage fecal samples. CdeA predominated in fecal samples during the peak stage, followed by vanRI and vanSG (LDA score > 3, Figure 6b), and the ARGs most enriched in the cecal contents during the peak stage were Streptomyces rishiriensis parY mutant conferring resistance to aminocoumarin (LDA score > 3, Figure 6c). The most abundant ARGs in high-yielding chickens were novA, tetQ, vansM, and ErmF (LDA score > 3, Figure S5B).
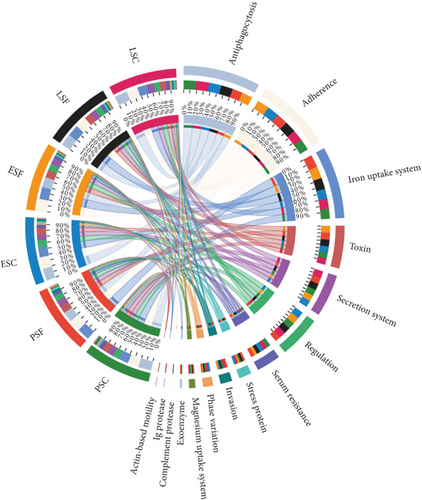
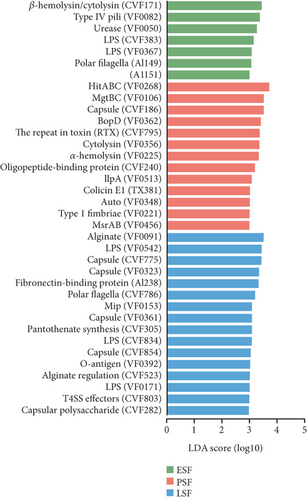
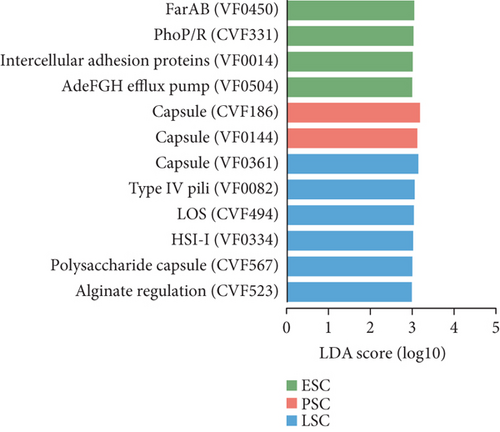
Finally, we conducted annotations against the VFDB and identified 467 VFs, assigning them to 15 VFDB Level 2 categories (Figure 7a). The differences between the fecal contents and the cecal content samples were further analyzed using LEfSe (LDA score > 3.5, Figure S5C). When comparing the fecal samples from the three stages, seven VFs were more enriched in the early stage, 13 VFs were more enriched in the peak stage, and 16 VFs were more enriched in the late stage, with HitABC being most enriched in the peak stage (LDA score > 3, Figure 7b). In the comparison of the three stages of the cecal contents, the late stage had the most enriched VFs compared to the other two stages (LDA score > 3, Figure 7c). The more enriched VFs of high-yielding chickens include pyrimidine biosynthesis and capsule, while in low-yielding chickens, they are FbpABC and BopD (LDA score > 3, Figure S5D).
4. Discussion
This study represents the first explorations of structural and functional distinctions in the fecal and cecal content metagenomes of chickens across different laying stages. Our findings indicate the significance of microbiota analysis in enhancing egg production performance in hens. The structure, composition, diversity, and function of fecal and cecal content microorganisms exhibit variations across laying stages.
4.1. Distinctive Characteristics of Chicken Fecal and Cecal Content Metagenomes
The chicken cecal content microbiota has been extensively studied due to the cecum’s crucial role in health, performance, and disease [46]. It contains a microbiota capable of breaking down cellulose and other indigestible carbohydrates, producing beneficial metabolites such as SCFAs [46]. Previous studies have demonstrated that the cecal content community has the longest development and maturation time in the gastrointestinal tract (GIT) [46] and exhibited the highest microbial diversity in the GIT. Alpha diversity analysis revealed that the cecal content samples had significantly higher overall evenness and richness than the fecal samples. However, when comparing the differences between fecal and cecal contents in the three different stages, only the cecal contents and fecal contents in the peak stage showed significantly different evenness and richness. Stanley et al. [47] investigated the microbial connections between the cecal contents and fecal contents and discovered that 88.55% of the operational taxonomic units (OTUs) were common. When comparing the changes in Shannon’s index between fecal and cecal content samples during each of the three stages, significant differences were observed in the fecal samples between the peak and late stages, while the cecal content samples show significant differences between the early and late stages. Beta diversity analysis revealed that the microbial composition difference between cecal contents and fecal contents was smaller in the initial stage compared to the other two stages. Significant differences were found between the three different stages in the cecal contents, while only differences between the peak and late stages were observed in the fecal samples. These results suggest that the microbial diversity of cecal content samples was more balanced than that of fecal samples throughout the laying stage, while the microbial composition of fecal contents was more stable. Additionally, the microbial diversity and composition of fecal samples underwent significant changes from early to late laying.
The composition of microorganisms in the fecal and cecal content regions varies depending on the age of the hen and its laying performance during the laying stage. Analysis at the phylum level revealed that Firmicutes were the most abundant in the fecal contents of hens, while Bacteroidota dominated in the cecal contents. These findings are consistent with previous studies [48]. Both our study and previous research [49] have shown a similar trend in the relative abundance of Firmicutes in fecal contents, which was highest during the peak stage but showed a decreasing trend by the late stage, while the abundance of Bacteroidetes increased during this time. Research has indicated that during the 2–4 weeks of a chicken’s life, the dominant phylum is Firmicutes, which may be related to high-energy demand. It is hypothesized that during the peak stage, the high physiological energy demand of egg production may be related to the relative abundance of Firmicutes in the fecal and cecal contents. Conversely, the host’s energy demand is relatively low during the early and late stages. However, perturbations in the gut microbiota in early childhood may have a significant impact on the host immune system in adulthood [50].
4.2. Egg-Laying Stage–Dependent Microorganisms and Their Association With Egg Production
Lactobacilli have been thoroughly studied and used as probiotics in the poultry industry to improve production performance [51, 52] and boost immune responses [53]. Our research revealed that the lipid metabolism pathway was prevalent at the peak stage. The follicles in the ovary need to grow and ovulate to initiate egg production [54]. Furthermore, it is important to mention that the physiology of layers undergoes significant changes during the laying stage. This is supported by the increased lipid metabolism and nutrient utilization, which in turn drives the development of intestinal microbiota [55]. Lactobacilli are involved in carbohydrate metabolism, and their metabolites lead to a decrease in pH in the intestinal tract, which can restrict the growth of other bacteria [56]. During the peak stage of our study, the highest relative abundance of Lactobacilli was found in fecal contents, while the Shannon index of fecal contents was at its lowest. As a result, we hypothesized that Lactobacilli could maintain the balance of the intestinal microbiological community and regulate intestinal health for chickens at the peak stage by regulating gut microbial diversity. The biomarker Alistipes in low-laying hens at the peak stage was also involved in the fermentation of the carbohydrates, ultimately producing acetic acid [57]. Hence, we observed an increased abundance of Lactobacilli at the peak stage. A recent study demonstrated that a probiotic mixture of Lactobacillus strains improved lipid metabolism and gut microbiota structure in mice [58], suggesting the potential improved functions of these Lactobacilli microorganisms in lipid metabolism during chicken egg production. Clostridium is a biomarker of the early egg-laying stage. Supplementation with Clostridium butyricum regulates lipid metabolism in older laying hens by shaping the bile acid profile and enhancing intestinal absorption, thereby improving yolk color [21]. Moreover, studies have shown that the addition of Clostridium butyricum and its fermentation to diets can improve egg quality and ovarian function [59].
Enterococcus improves immune response. Research indicates that Enterococcus faecium in the animal gut can effectively break down carbohydrates, improve feed conversion, and enhance nutrient utilization, thereby boosting animal performance [60]. Enterococcus faecalis exerts immunomodulatory and antipathogenic functions in carrion crows [61]. We have identified Enterococcus as a biomarker in fecal contents during the peak egg production stage. Feeding Enterococcus strains has been shown to increase hen body weight [62], prevent bacterial infections [63], and significantly increase egg production [64].
Bacteroides are crucial for breaking down complex carbohydrates in the host intestine [65]. Studies have shown that increased levels of Bacteroides in the cecum of young chickens can alter the composition and function of gut microbes, leading to an increase in SCFA production [66]. SCFAs play an important role in maintaining intestinal health and improving nutrient absorption [67]. This study identified Bacteroides as a biomarker in the feces of high-yielding chickens and the cecal contents during the peak egg-laying stage. It was significantly and positively associated with egg production, confirming that Bacteroides promote the production of SCFAs and enhance nutrient uptake in laying hens during the peak stage, thereby increasing egg production.
Xiao et al. [68] demonstrated that the supplementation of essential oils (EOs) improves the gut microbiota ecology by increasing the abundance of Megamonas, which is a biomarker associated with high egg-laying in chickens. We hypothesize that Megamonas regulates gut microbiota homeostasis, leading to improved egg production. Prevotella helps break down proteins and carbohydrates [69], and the succinate it produces enhances animal immune response [70]. This finding suggests that Prevotella improves intestinal absorption and digestion of nutrients, thereby increasing egg production in hens. Studies suggest that Erysipelatoclostridium may be associated with increased antioxidant ability in laying hens [71]. In addition, previous studies have indicated that adding additives to the diet can increase egg production in laying hens while reducing egg weight [72]. Therefore, the beneficial bacteria biomarkers we have identified not only maintain the homeostasis of gut microorganisms in chickens during the peak laying stage but also have the potential to help improve egg production. Multiomic strategies play a key role in analyzing complex disease [73] and animal traits [74], such as recent studies that used single cell transcriptome technology to explore the egg production trait of chickens [75, 76]. In the future, the technique of multiomics should also be used for the complex trait exploration of egg production.
Insights into the microbiome’ functionality based on the CAZy database showed that GT8, GH1, GH73, CE12, GH8, GH13_31, GH43_31, GH20, and GT5 are abundant in the peak egg-laying stage. Research indicates the GT8 family was highly abundant in chicken feces [77], and the ability of lactic acid bacteria to Lactobacilli is positively correlated with GT8 family members involved in lipopolysaccharide biosynthesis [78]. A high abundance of GH1 in the chicken gut has also been reported [79], and GH class is closely associated with cellulose and starch degradation [79]. APH(3 ′)-llla was significantly enriched in the fecal contents at the peak stage and in the cecal contents at the early stage in this study. And APH(3 ′)-llla was identified as the core ARGs shared between the two pig populations in China and abroad [80]. The most prevalent differential ARGs found at the peak in this study were macB. Analysis of previous studies suggests that macB genes can influence microbial physiological functions and energy metabolism. ARG macB may play an important role in regulating microbial composition [81]. ARG and VFG are closely associated and impact each other, as alterations in ARGs also influence virulence factors [82].
5. Conclusion
The metagenomic analysis revealed that differences in microbial composition and diversity between fecal and cecal contents varied over the laying stages and were most pronounced at the peak stage. The microbial community of fecal contents was more stable in its dynamics throughout the laying stage than that of cecal contents. Secondly, the dominant fecal microflora changed over the laying period, especially during peak laying when the dominant organisms were Lactobacillus and Limosilactobacillus, while the dominant organisms in the cecal contents were almost the same over the laying stage. Lactobacillus was the dominant bacterial group in both fecal and cecal contents. Furthermore, the functional characteristics of chicken gut microorganisms were significantly different between laying stages, and these functions help to maintain the balance and health of the chicken gut microbial community, which affects the immune function, nutrient intake, and metabolic balance of chickens, and consequently affects the performance of chickens in laying eggs. Finally, the composition and function of gut microorganisms differed between high- and low-yielding chickens and may have an impact on their egg quality.
Conflicts of Interest
The authors declare no conflicts of interest.
Funding
This research was supported by the National Key R&D Program of China (2024YFF1001400), the Open Program from the State Key Laboratory for Managing Biotic and Chemical Threats to the Quality and Safety of Agro-Products (N0.2021DG700024-KF202413), the Basic Research Project of Shanxi Province (202203021212437), and the Sichuan Science and Technology Program (2024NSFSC2119).
Supporting Information
Additional supporting information can be found online in the Supporting Information section.
Open Research
Data Availability Statement
The metagenomic sequencing data have been deposited into the NCBI Sequence Read Archive (SRA) database with login ID PRJNA1036376.


