A Hierarchical Control Framework for Coordinating CAV-Dedicated Lane Allocation and Signal Timing at Isolated Intersections in Mixed Traffic Environments
Abstract
With the rapid development of connected and automated vehicles (CAVs), numerous studies have demonstrated that CAV-dedicated lanes (CAV-DLs) can significantly enhance traffic efficiency. However, most existing studies primarily focus on optimizing either CAV trajectory planning or traffic signal control, and the integration of CAV-DLs and signal control for improved spatiotemporal resource utilization remains underexplored. To address this challenge, this study proposes a hierarchical control framework that integrates CAV-DLs allocation with signal control. The framework employs two collaborative agents based on the dueling double deep Q-network (D3QN) algorithm. The upper-level agent recommends optimal CAV-DLs configurations based on long-term traffic flow patterns, while the lower-level agent focuses on real-time signal control by adjusting signal parameters and green time allocations in response to current traffic demand. Simulation results demonstrate that the proposed model effectively adapts to dynamic traffic conditions, significantly improving intersection capacity and reducing delays. Compared with benchmark approaches, the model achieves an average improvement of 31.8% in traffic efficiency. Additionally, the study identifies CAV penetration rate (CAV PR) thresholds of 30% and 60% as appropriate for allocating one and two CAV-DLs, respectively, at intersections with high traffic volumes. These findings provide valuable theoretical insights and practical guidance for the effective configuration of CAV-DLs in future traffic systems.
1. Introduction
Traffic congestion at intersections poses significant challenges to the efficiency of transportation system efficiency and is a key contributor to environmental pollution [1]. Recent advances in connected and automated vehicle (CAV) technology, combined with vehicle-to-everything (V2X) communication systems, offer promising solutions for reducing collisions and mitigating energy waste at intersections. These technologies enable real-time communication between vehicles and infrastructure, facilitating the exchange of critical data on driving conditions and travel intentions, which forms a robust foundation for more effective intersection signal control [2]. In practice, CAV deployment is progressing. For example, Baidu’s Apollo platform has introduced Robotaxi, a Society of Automotive Engineers (SAE) Level 4 autonomous vehicle, which is now operational in several major Chinese cities including Beijing, Shanghai, and Wuhan. These cities have authorized fully driverless operations, marking a significant step in autonomous urban mobility. This initiative aims to alleviate congestion and enhance road capacity by improving vehicle efficiency and reducing collision rates [3]. However, real-world deployments continue to face challenges. Notably, the unpredictable behavior of human-driven vehicles (HDVs) remains a challenge, often exacerbating congestion [4]. Moreover, the widespread adoption of CAVs is not expected in the near term, implying that mixed-traffic environments, where CAVs coexist with HDVs, will persist for the foreseeable future [5]. As such, effective and safe intersection management in mixed-traffic scenarios is critical for the long-term integration of CAV technologies.
To address these challenges, extensive research has explored various strategies for optimizing intersection performance. Existing studies typically focus on one of four primary approaches [6]: actuated signal control [7–9], platoon-based signal control [10–12], planning-based signal control [13–16], and signal-vehicle coupled control (SVCC) [17–19]. Actuated signal control operates as a reactive approach, adjusting signal timing in response to real-time traffic conditions without the need for traffic state prediction. In contrast, both platoon-based and planning-based strategies leverage predictive data on predictive traffic data to optimize performance. Platoon-based control seeks to group vehicles into coordinated units to minimize signal disruptions and improve flow efficiency. For instance, Niroumand et al. [11] proposed a “white” phase that allows HDVs to follow CAV-led platoons using a customized car-following model. Similarly, Song and Fan [12] developed a multiagent deep reinforcement learning (MADRL) system to manage CAV platoons across arterial corridors by sharing state information. However, their approach does not explicitly account for internal platoon dynamics. In contrast, the planning-based strategies aim for greater precision by forecasting vehicle arrival times to construct a detailed traffic state representation [13–16]. Guler et al. [17] combined platoon management with flexible signal timing, proposing an optimization algorithm for intersections with partial CAV presence to minimize delays. Tajalli and Hajbabaie [18] enhanced solution efficiency in mixed-integer nonlinear programming (MINLP) models by applying convex hull formulations to linearize constraints. Zou et al. [19] extended this framework using a two-layer trajectory control model that simultaneously optimizes vehicle acceleration and speed, ensuring safe spacing and smoother flows.
Most previous studies assume shared intersection infrastructure for CAVs and HDVs under fixed lane configurations. However, fixed configurations often lead to inefficiencies under fluctuating traffic demands. Recent research has focused on joint optimization of signal control and lane configurations to adapt to spatiotemporal variations in demand [20–22]. Simultaneously, researchers have explored the deployment of CAV-dedicated facilities, such as CAV-dedicated lanes (CAV-DLs) [23, 24], which have been shown to nearly double the saturation flow rate compared to conventional lanes [25]. For example, Rey and Levin [26] introduced the use of “blue phases” (BPs), which are exclusive signal phases for CAVs. By formulating a mixed-integer linear programming (MILP) model, they jointly optimized the timing of BPs and green phases to maximize intersection throughput. Ma et al. [27] addressed lane underutilization using shared-phase strategies, applying dynamic programming to minimize delays and nonlinear programming to optimize CAV trajectories. Chen et al. [28] developed a method to dynamically allocated right-of-way to CAV-DLs based on predicted utilization, mitigating inefficiencies under low CAV penetration rates. Differing from most studies, Xu et al. [29] assumed decentralized CAV trajectory planning and proposed an MILP model for arterial signal coordination with CAV-DLs. Their method maximized green-wave bandwidth to allow CAVs to cross intersections without stopping. A multimode bandwidth allocation scheme was also introduced to serve both CAVs and HDVs. Jiang and Shang [30] and Dai et al. [31] further extended these models. Jiang and Shang [30] predicted traffic demand to dynamically allocate lane functions and optimize green time, reducing speed variance and improving CAV travel efficiency. Dai et al. [31] utilized piecewise linear programming to jointly optimize signal timing and CAV-DLs allocation, incorporating trajectory adjustment for smoother vehicle movement.
In summary, current research primarily focuses on the joint control of signal timing and vehicle trajectories within fixed CAV-DLs configurations. Although CAV-DLs significantly increase saturation flow rates [25], space constraints at intersections raise concerns about their efficiency across varying traffic volumes and CAV PRs. To address these issues, this study evaluates the impact of CAV-DLs on intersection efficiency under diverse traffic conditions. In condition, a hierarchical control model is proposed to coordinate the allocation of CAV-DLs and signal control, aiming to enhance the utilization efficiency of CAV-DLs and improve overall intersection operations.
The remainder of this paper is organized as follows: Section 2 describes the research scenario. Section 3 outlines the proposed hierarchical control framework for coordinating CAV-DLs allocation and signal control. Section 4 presents the simulation results and comparative analysis. Finally, Section 5 summarizes the study’s contributions and discusses its limitations.
2. Problem Description
This study addresses the joint optimization of CAV-DLs configuration and traffic signal control in a mixed traffic environment comprising both CAVs and HDVs. Prior research has demonstrated the potential of CAV-DLs to enhance traffic efficiency. However, the differing driving characteristics of CAVs and HDVs at signalized intersections substantially influence both CAV-DLs configuration and overall intersection performance.
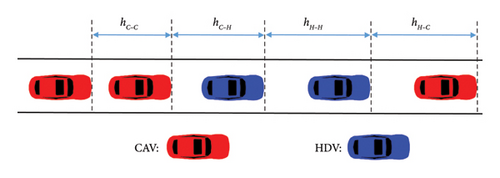
To account for these dynamics, the study begins by characterizing the following behaviors of CAVs and HDVs. It is assumed that vehicles select their lanes upon entering the intersection approach based on their intended travel destinations. By the time they reach the guidance lane line, all necessary lane changes and overtaking maneuvers are presumed to be completed. The mixed traffic flow considered in this study includes both CAVs and HDVs, resulting in four distinct car-following modes, as illustrated in Figure 1. In the hC−H scenario, where a CAV follows an HDV, no communication is possible due to the HDV’s lack of connectivity. As a result, the CAV operates effectively as an automated vehicle (AV) without V2X capabilities [32]. To ensure consistency and modeling applicability, it is assumed that CAVs, leveraging advanced sensing and control systems, can maintain the shortest headways. AVs, while lacking full connectivity, are still equipped with partial automation and are therefore assumed to maintain headways longer than those of CAVs but shorter than those of HDVs. Based on prior literature [11, 33], the headway parameters used in the study are hH−H = hH−C = 1.8 s, hC−C = 0.9 s, and hC−H = hC−C + ((hH−H − hC−C)/3) = 1.2 s.
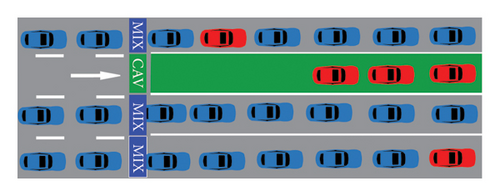
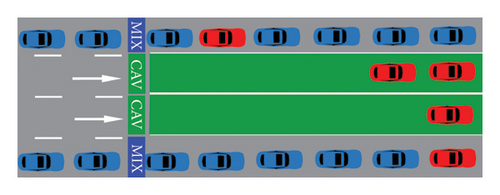
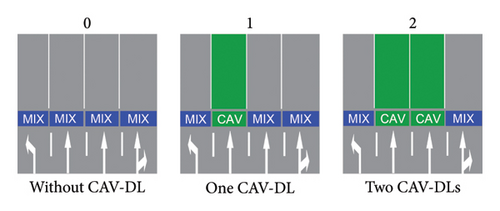
Although the literature highlights that implementing CAV-DLs can significantly enhance lane saturation flow rates, this benefit comes at the cost of repurposing conventional mixed-use lanes. As depicted in Figures 2(a) and 2(b), under low CAV PR, the introduction of CAV-DLs may fail to improve and can even reduce intersection efficiency [28]. To address this challenge, a typical two-way, eight-lane signalized intersection is selected as the research scenario, as shown in Figure 3. In this setup, the middle two lanes in each direction are designated as variable lanes that dynamically adjust their functionality in response to real-time traffic conditions. These variable lanes can switch flexibly between mixed-use lanes (depicted as gray lanes) and CAV-DLs (depicted as green lanes). This dynamic approach ensures adaptability across signalized intersections with varying lane configurations, provided that the number of variable lanes is appropriately adjusted to match specific traffic demands. To ensure safe and effective implementation of dynamic lane functions, visual lane function indicators are deployed. When a lane’s function changes, the corresponding indicator light is activated to signal the update. These visual cues allow HDVs to clearly recognize reconfigured lane functions during real-time CAV-DL deployment, ensuring that control directives are followed safely and accurately. The operational procedure for lane clearance during lane function switching is described in detailed in Section 3.4.

- •
The study focuses exclusively on the application of CAV-DLs at isolated intersections and does not extend to traffic networks or corridors.
- •
CAVs are capable of identifying the type of the preceding vehicle (CAV or HDV) and adjusting their headway accordingly.
- •
The PR represents the current proportion of CAVs at the intersection and is distinct from the market penetration rate (MPR) of CAVs at the network level, which changes more gradually.
- •
CAV-DLs are designated solely for through-going CAVs.
- •
At intersections, only the outermost lane (shared for through and right-turn movements) functions as shared lanes. The middle two lanes are variable, dynamically alternating between mixed-use through lanes and CAV-DL through lanes based on real-time traffic conditions.
3. Method
3.1. Hierarchical Framework
To address the joint optimization of dynamic CAV-DLs allocation and traffic signal control, it is essential to consider the differing temporal impacts of these two control mechanisms. Adjustments to lane functionality typically exert delayed effects on traffic flow due to required operational transitions. In contrast, modifications to signal timing have immediate impacts on intersection performance. To tackle this challenge, this study proposes a hierarchical framework for spatiotemporal resource allocation at signalized intersections with variable CAV-DLs.
- •
CAV-DL Allocation Layer. This layer manages the dynamic switching of variable lanes between CAV-DLs and mixed-use lanes based on real-time traffic conditions. To prevent overutilization or instability in traffic flow, the framework imposes a constraint that only one variable lane per approach is to be altered during a single switching operation. For instance, if all variable lanes on a given approach are currently operating as mixed-use lanes and multiple lanes qualify for reallocation, only one lane may be converted to a CAV-DL at a time. This gradual transition strategy mitigates the risk of overutilization or flow instability, ensuring smooth and predictable operations.
- •
Traffic Signal Control Layer. Closely integrated with the CAV-DL allocation process, this lower layer adjusts signal timing plans in response to the latest lane configurations and real-time traffic conditions. By synchronizing signal control with lane reallocation decisions, this layer ensures that green times remain responsive to prevailing demand and lane functionality. This maximizes operational efficiency and minimizes vehicular delay at the intersection.
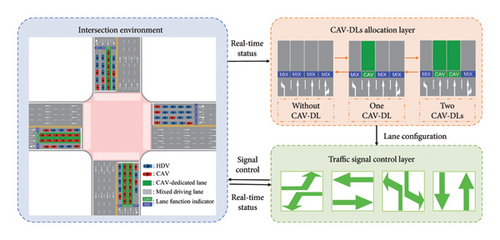
Together, these layers form a coordinated system for real-time spatiotemporal resource optimization, enabling dynamic lane allocation and signal adaptation to work synergistically.
3.2. Deep Reinforcement Learning (DRL) Techniques
The core principle of reinforcement learning (RL) lies in acquiring knowledge through interaction and trial-and-error processes. RL involves a continuous cycle of decision-making and strategy optimization, guided by internal data structures and algorithms. The objective is to maximize cumulative rewards through iterative interactions between an agent and its environment. In RL, the agent interacts with the environment based on a predefined policy. During each interaction, the agent observes the current state of the environment and selects an action accordingly. After executing the action, the agent receives a reward, reflecting the immediate benefit or cost of the action. Through repeated interactions, the agent explores various strategies and progressively learns an optimal policy that guides its actions within the environment.
The dueling network architecture enhances the estimation of action values by decoupling the state value from the advantage function, which represents the relative value of individual actions within a given state. In traditional Q-learning, the action-value function is treated as a single, unified estimate that combines the value of both the state and the action. In contrast, the dueling network separates this function into two distinct components: the state value, which reflects the overall desirability of being in a particular state, and the advantage value, which quantifies the benefit of selecting a specific action in that state. This decomposition enables the network to independently learn and predict the state value and action advantages, fostering more efficient learning and improved stability.
3.3. CAV-DLs Allocation Layer
This layer is responsible for optimizing the dynamic configuration of CAV-DLs. As outlined in Section 2, the middle two lanes on each intersection approach serve as flexible lanes, which can be dynamically switched between CAV-DLs and mixed-use lanes. At each time step t, the CAV-DLs allocation agent selects an action ac,t based on the observed state sc,t. This action is evaluated using a reward rc,t, which reflects long-term traffic efficiency and intersection throughput. Since the effects of lane reconfiguration manifest over longer time scales compared to signal timing adjustments, the time step for this agent is set to ΔT, where ΔT > Δt, with Δt being the time step of the signal control agent.
3.3.1. State Space
In the SUMO simulation environment, a laneAreaDetector is utilized to gather these state variables over a spatial segment along one or more lanes. Unlike prior studies that assume a fixed CAV PR, this model accounts for a dynamic rate that varies in response to traffic conditions, based on the actual number of CAVs introduced into the intersection. The traffic signal control in this study is configured with four phases, detailed in the subsequent section.
3.3.2. Action Space
3.3.3. Reward Space
3.4. Traffic Signal Control Layer
This layer primarily focuses on the optimization of traffic signal control. At each time step t, the signal control agent takes an action as,t based on the state ss,t. This action is evaluated using a reward rs,t, which reflects short-term traffic efficiency.
3.4.1. State Space
3.4.2. Action Space

In as,t, a value of 0 indicates a transition to the next signal phase, while values of 1 and 2 represent extensions of the current green phase by 3 and 5 s, respectively. Each green phase is bounded between a minimum of 15 s and a maximum of 60 s to ensure adequate pedestrian crossing time and prevent excessive vehicle delays. Additionally, for safety, a 3-s yellow interval and a 2-s all-red interval follow each green phase.
3.4.3. Reward Space
3.5. Learning Procedure
This study employs a two-layer framework comprising the CAV-DLs allocation layer and the traffic signal control layer, trained using two D3QNs. Each layer represents an independent agent, and the execution process is summarized in Algorithm 1.
-
Algorithm 1: Training process.
-
Require: Two D3QNs with parameters θc, θc_target, θs, and θs_target randomly initialized, respectively. Initialize their replay buffers RBc and RBs. Set target network update frequency T.
-
Ensure: Well-trained two D3QNs with parameters θc and θs optimized.
- 1.
for episode = 1 to Max-Episode do
- 2.
Reset the environment
- 3.
t = 0
- 4.
while t ≤ Max-Time do
- 5.
Ac acquires state sc,t, using eval_net to map the Q-value estimates of all actions
- 6.
Ac selects action ac,t using ε-greedy policy
- 7.
Execute action ac,t (CAV-DLs configuration)
- 8.
t′ = t
- 9.
while t′ ≤ t + ΔT do
- 10.
As acquires state , using eval_net to map the Q-value estimates of all actions
- 11.
As selects action using ε-greedy policy
- 12.
Execute action (signal control adjustment)
- 13.
As acquires reward
- 14.
t′ = t + Δt
- 15.
Store (, , , ) in RBs
- 16.
Sample B random mini-batch from RBs
- 17.
Update θs by minimizing the loss
- 18.
Every T steps, update θs_target
- 19.
end while
- 20.
Ac acquires reward
- 21.
t′ = t + ΔT
- 22.
Store (, , , ) in RBc
- 23.
Sample B random mini-batch from RBc
- 24.
Update θc by minimizing the loss
- 25.
Every T steps, update θc_target
- 26.
end while
- 27.
end for
4. Experiment and Results
4.1. Experiment Setup
To evaluate the effectiveness of the proposed method, the study develops a simulation environment for intersection control using the microscopic traffic simulation platform SUMO. The simulation interacts with SUMO via a Python-based control framework leveraging the TraCI interface. Within this environment, the control algorithm continuously receives real-time environmental state information and executes corresponding control actions. As illustrated in Figure 3, the study centers on a cross-shaped intersection layout, representative of typical urban intersections. Each approach consists of bidirectional lanes with a total of four lanes per direction: one lane for left-turn movements, two variable through lanes, and one shared lane for through and right-turn movements. All lanes are 400 m long and operate under a speed limit of 50 km/h.
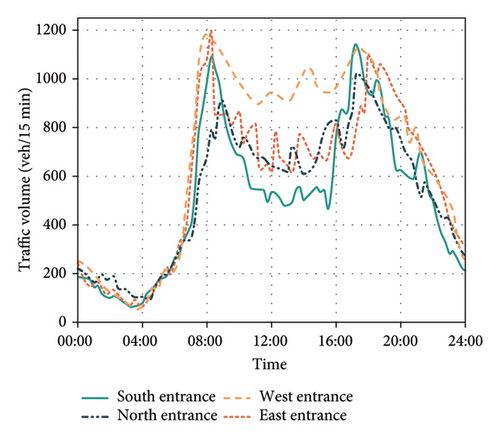
Both real-world and synthetic datasets are employed in the experiments. The real dataset is sourced from a traffic survey conducted on April 24, 2024, at a signalized intersection in Wuhan, China, with features eight lanes. Figure 7 presents the actual daily traffic flow observed at the site. The turning ratio is fixed, with 60% going straight, 25% turning left, and 15% turning left. To evaluate the model’s adaptability to varying peak-hour conditions, synthetic datasets are generated by scaling the real traffic volumes. Specifically, the original traffic data serve as the baseline for generating synthetic scenarios. Based on the peak-hour flow observed in the real dataset, proportional scaling is applied to simulate variations in traffic demand. In these synthetic datasets, traffic volumes are adjusted to 600, 700, 800, 900, 1000, 1100, and 1200 vehicles per lane per hour. During the scaling process, the original turning ratios and directional flow distributions are preserved, ensuring that the synthesized traffic conditions retain realistic flow patterns while enabling controlled modifications to the total traffic volume.
The D3QN-based reinforcement learning algorithm employs both an evaluation network and a target network, each comprising a three-layer fully connected neural network augmented by an additional dueling network layer. The initial three fully connected layers are designed to extract features from the input feature matrix, while the dueling layer further enhances the model’s learning capabilities by decoupling the action-value function from the state-value function through its specialized decoupling mechanism. The specific configuration of the algorithm parameters is detailed in Table 1.
| Parameters | Values | Descriptions |
|---|---|---|
| N | 200 | Maximum number of training episodes |
| n | 3600 | Simulation duration in each episode |
| α | 0.0001 | Learning rate |
| γ | 0.95 | Discount factor |
| ε | 0.01 | Corruption coefficient of the greedy strategy |
| M | 10,000 | Maximum number of experiences in the replay buffer |
| B | 128 | Batch size used for training |
| T | 200 | Target network update frequency |
| b1 | −5 | Penalty for excessive transitions in CAV-DL configurations |
| b2 | −10 | Penalty for low green light utilization rate of CAV-DLs |
| b3 | −10 | Penalty for the presence of HDVs in CAV-DLs |
| w1 | −0.01 | Weight coefficient of changes in intersection throughput |
| w2 | 1 | Weight coefficient of transition in CAV-DL configurations |
| w3 | 1 | Weight coefficient of green light utilization rate |
| ρ | [0, 1] | Proportion of CAVs |
| Δt | 900 | Time interval for As to take an action |
| ΔT | 1800 | Time interval for Ac to take an action |
4.2. Experiment Result
The experimental results are presented in two parts. First, the performance of the proposed model is evaluated through comparative analysis, demonstrating its effectiveness and advantages over existing methods. In the second part, the study investigates the impact of varying traffic volumes and CAV PR on the configuration of CAV-DLs.
4.2.1. Model Performances
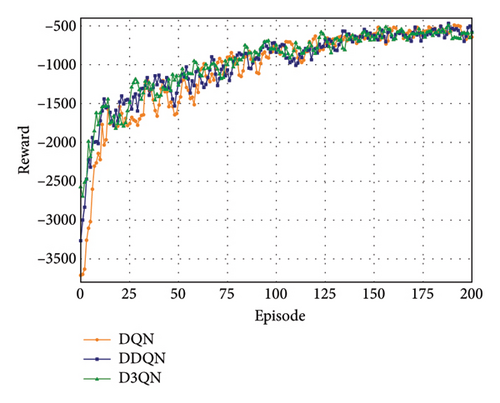
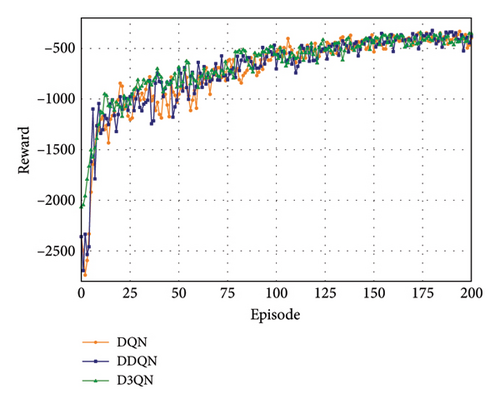
This study first evaluates the effectiveness of the proposed model under various traffic conditions, including different traffic volumes and CAV PR. As shown in Figures 8(a) and 8(b), the convergence performance of the model during training is demonstrated under peak-hour conditions with a traffic volume of 1200 vehicles per lane per hour and a 50% CAV PR. The cumulative rewards of the proposed method are compared with those of models based on DQN and DDQN. The results indicate that both the CAV-DL allocation layer and the signal control layer converge across all three methods, suggesting that they are well-suited for the given scenario.
To further evaluate the performance of the proposed hybrid control method, comparative experiments were conducted against two benchmark strategies: fixed-time control (FTC) and the self-organizing traffic light (SOTL) strategies. SOTL is a phase-switching control strategy that triggers phase changes when the number of queued vehicles in both the current and competing phases exceeds predefined thresholds. In contrast, FTC is the only feasible option when vehicle detectors or connected vehicle data are unavailable. FTC operates based on a predetermined cycle length, optimizing the green time ratio to match expected traffic demands, thereby ensuring green phases are adjusted to meet intersection requirements. The fixed phase sequence employs an isolated release structure, with the minimum green time set to 30 s.
Figure 9 presents the average vehicle delay for different control methods under varying traffic volumes and CAV PR. As shown in Figure 9(a), the trend of increasing delay with rising traffic volume is evident. While the SOTL method can reduce delays compared to FTC, its average vehicle delay remains relatively high (Figure 9(b)). In contrast, the DQN, DDQN, and D3QN methods achieve significant reductions in average vehicle delays, as illustrated in Figures 9(c), 9(d), and 9(e), respectively. For example, under peak traffic conditions of 1200 vehicles per lane per hour and 0% CAV PR, the average vehicle delays are reduced by 28.8%, 31.6%, and 32.7% for the DQN, DDQN, and D3QN methods compared to FTC, respectively. The improvement rates under other traffic conditions are illustrated in Figure 10. Furthermore, Figure 9 demonstrates that as the CAV PR increases, the overall trend in average delay decreases. Although some fluctuations are observed in specific cases, the results highlight that higher CAV PR contributes to improved traffic efficiency.
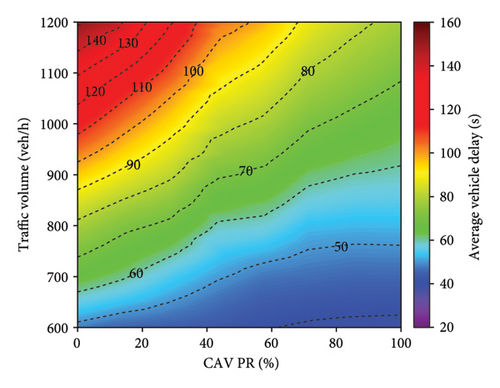
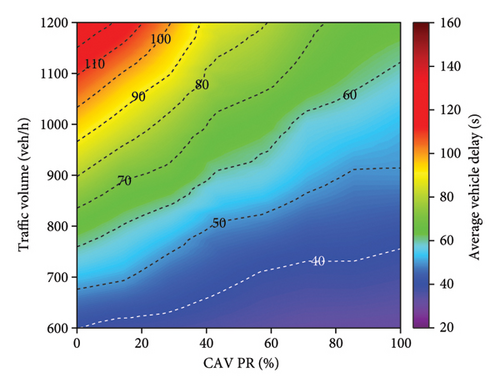
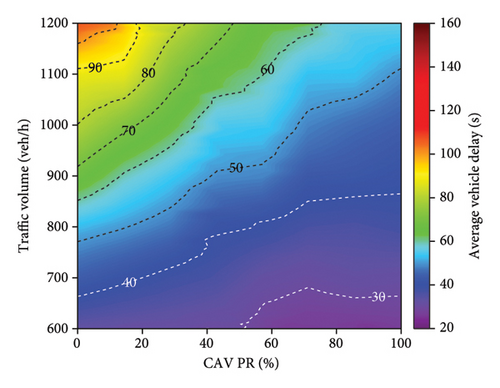
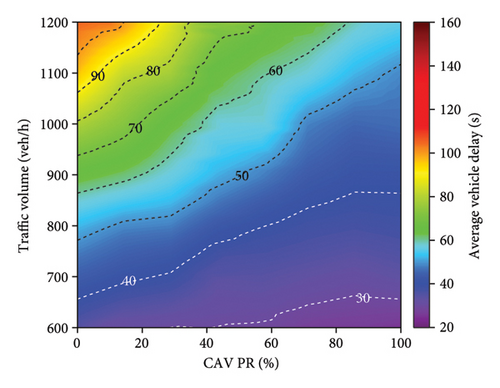
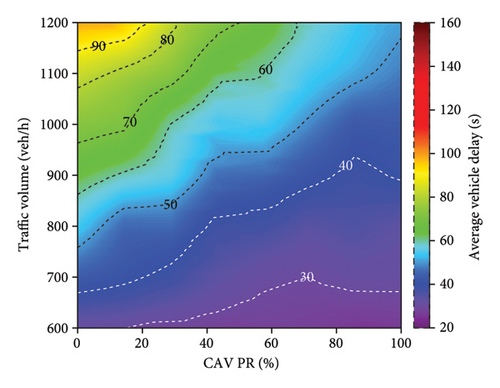
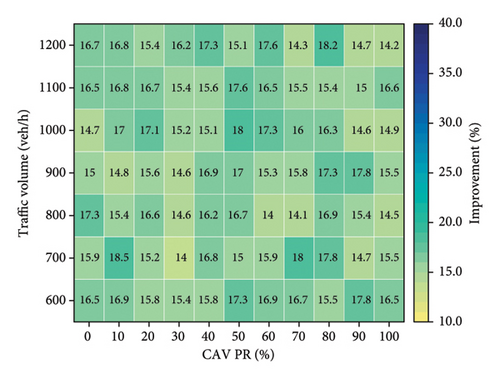
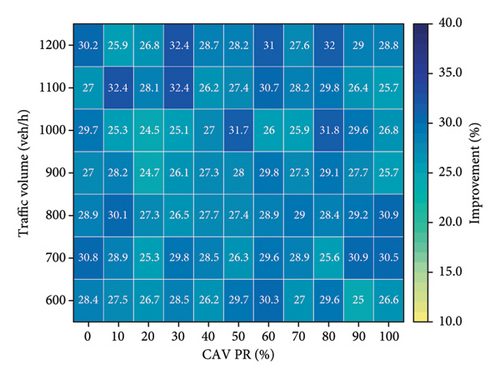
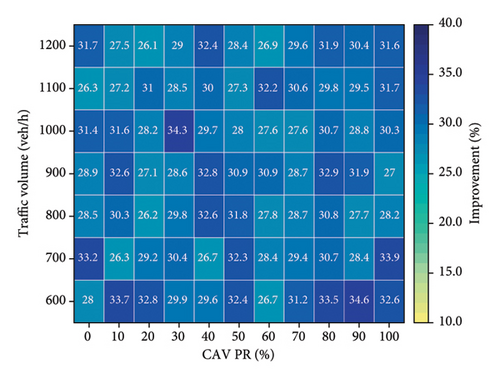
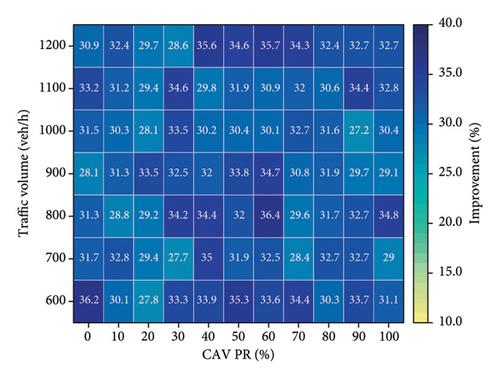
Figure 10 provides a comparative analysis of the effectiveness of various control methods in improving vehicle delay relative to FTC. The experimental results indicate that all alternative methods outperform FTC to varying degrees. Notably, the D3QN method demonstrates superior performance compared to all other tested strategies, achieving an average efficiency improvement of 31.8% (Figure 10(d)). This enhancement can be attributed to the adaptive capabilities of the D3QN algorithm in traffic signal control. As a deep reinforcement learning-based approach, D3QN continuously interacts with the environment to optimize signal control strategies, enabling it to effectively respond to dynamic traffic conditions. In contrast, FTC relies on preset intervals and lacks the flexibility to adapt to changing traffic patterns, resulting in lower efficiency, particularly under high traffic volumes or irregular traffic flows. Although the SOTL method does not reach the same level of efficiency improvement as DQN (Figure 10(b)), DDQN (Figure 10(c)), or D3QN (Figure 10(d)), it still exhibits substantial advantages over FTC (Figure 10(a)).
4.2.2. Effect of Traffic Parameters on CAV-DLs Configuration
To comprehensively evaluate the effect of CAV-DL configurations on traffic efficiency, three fixed lane allocation scenarios were considered in the CAV-DL allocation layer: no CAV-DLs, one CAV-DL, and two CAV-DLs. In each scenario, all intersection approaches adopted the same lane function allocation. Specifically, in the scenario without CAV-DL, all lanes served mixed traffic. In the one CAV-DL scenario, one lane per approach was exclusively reserved for CAVs, while the remaining lanes accommodated mixed traffic. In the two CAV-DLs scenario, two lanes per approach were allocated solely for CAVs, with the remaining lanes serving mixed movements. Moreover, the signal control layer employed a D3QN-based signal optimization strategy.
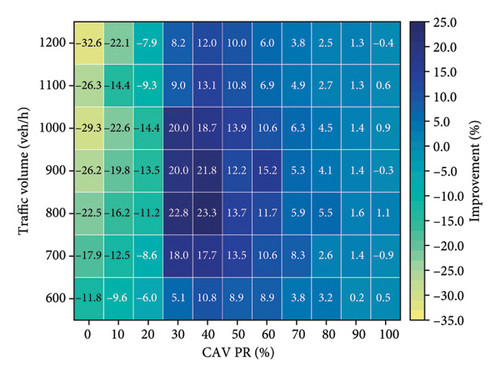
The detailed results are presented in Figure 11. In the single CAV-DL scenario (Figure 11(a)), the results indicate that configuring one CAV-DL does not always improve traffic efficiency. When the CAV PR is below 30%, the single CAV-DL scenario performs worse than having no CAV-DL. However, once the CAV PR exceeds 30%, the presence of a single CAV-DL leads to significant improvements in traffic efficiency, with the greatest benefit observed around a CAV PR of 40%. Beyond a CAV PR of 70%, the efficiency gains tend to decrease, likely due to the increased presence of HDVs within the system, which reduces the marginal benefits provided by additional CAVs.
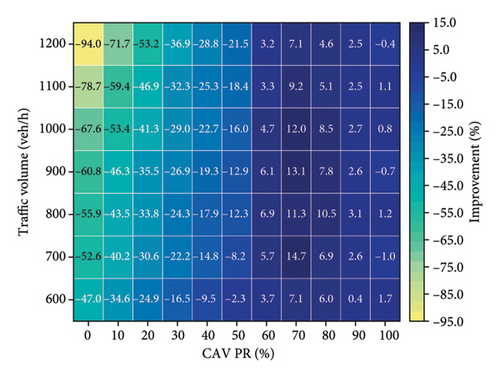
For the two CAV-DL configuration scenario (Figure 11(b)), the results reveal that when the CAV PR is below 60%, traffic efficiency not only fails to improve compared to the no-CAV-DL scenario but actually decreases. This decline is attributed to the low proportion of CAVs, which leads to excessive congestion among HDVs in the remaining lanes, resulting in an imbalanced allocation of road resources. As the CAV PR increases beyond 60%, the two CAV-DL configurations begin to effectively enhance traffic flow. The additional CAVs improve the utilization of both dedicated lanes, leading to an overall enhancement in traffic efficiency. This aligns with prior research [31], which suggested that implementing two CAV-DLs becomes beneficial when the CAV PR exceeds 70%.
To analyze the configuration of CAV-DLs under different CAV PR, this study examines a peak traffic flow of 1200 vehicles per hour per lane as a case study. As shown in Figure 12(a), at low CAV PR (less than 30%), no CAV-DL is implemented at the intersection. As the CAV PR increases, the demand for CAV-DL gradually becomes apparent, and CAV-DL is progressively introduced during peak periods. Figure 12(b) illustrates that, as the peak period ends and traffic volume decreases, the implementation of CAV-DL does not always enhance traffic efficiency. Therefore, under lower traffic volumes, CAV-DL is converted into conventional mixed lanes. Furthermore, when the CAV PR exceeds 50% (as shown in Figure 12(c)), CAV-DLs begin to be implemented during off-peak periods. Finally, when the CAV PR exceeds 60% (Figure 12(d)), two CAV-DLs are established at the intersection. This indicates that once the CAV PR reaches a certain threshold, the system dynamically adjusts the number of CAV-DLs based on traffic flow and CAV PR to optimize traffic efficiency. This adaptive strategy highlights the flexibility of CAV-DL allocation, allowing lane resources to be allocated dynamically according to varying CAV PRs and traffic conditions.


5. Conclusion
Given the significant differences in road utilization efficiency between CAVs and HDVs, existing optimization methods for mixed traffic at signalized intersections have not adequately accounted for the dynamic adjustments of CAV-DLs based on varying CAV PR and traffic demand. To address this issue, this study proposes a hierarchical optimization method that integrates the dynamic allocation of CAV-DLs with traffic signal control. The aim is to prevent the overuse or underutilization of CAV-DLs while optimizing intersection signal control to enhance overall intersection performance.
- •
As CAVs become increasingly prevalent, CAV-DLs are considered critical infrastructure for improving overall traffic efficiency. This study systematically analyzes the impact of varying numbers of CAV-DLs on traffic efficiency under different CAV PR and traffic demand conditions. The findings reveal that the effect of CAV-DLs on traffic efficiency is closely related to CAV PR and traffic demand. At low CAV PR, CAV-DLs may lead to an uneven allocation of traffic resources, reducing overall efficiency. Conversely, at higher CAV PR, appropriately allocated CAV-DLs can significantly enhance road capacity and traffic efficiency.
- •
The study further identifies the thresholds for implementing CAV-DLs at intersections with high traffic volume. Specifically, when the CAV PR reaches 30% and 60%, it is reasonable to allocate one and two CAV-DLs, respectively. For intersections with lower traffic volumes, the CAV PR required for setting one CAV-DL should be slightly higher, while the threshold for two CAV-DLs remains unchanged. These findings provide theoretical guidance for the configuration of CAV-DLs.
- •
The proposed hierarchical optimization method, which combines CAV-DL allocation with signal control, demonstrates significant advantages in improving traffic efficiency. Compared to benchmark methods, it achieves an average efficiency improvement of 31.8%. By dynamically integrating signal control with the adjustment of CAV-DLs, this method responds flexibly to variations in traffic flow, significantly enhancing intersection capacity and reducing delays.
This study has several limitations in scope. First, the signal phase selection is manually designed, whereas dynamically adjusting signal phases based on real-time traffic conditions could yield more efficient control. Moreover, the functional configuration of the CAV-DLs, such as designating lanes for straight-through, left-turn, or straight-left movements, can be adjusted according to the traffic conditions. Future work will address these limitations by enhancing the proposed method to support dynamic signal phase optimization and adaptive lane management strategies based on real-time traffic data. Moreover, the study will focus on multiintersection arterial coordination, exploring how to optimize the dynamic allocation of CAV-DLs and signal control across interconnected intersections to achieve global traffic efficiency improvements.
Conflicts of Interest
The authors declare no conflicts of interest.
Funding
This work was supported by the National Key Research and Development Program of China (No. 2023YFB4301800) and Key Research and Development Program of Hubei Province (No. 2023BAB076).
Open Research
Data Availability Statement
The data that support the findings of this study are available from the corresponding author upon reasonable request.


