Leveraging Ant Colony and Particle Swarm Optimization Algorithms for Assessing the Transit-Oriented Development Potential: A Case Study of Dhaka, Bangladesh
Abstract
This study explores transit-oriented development (TOD) in Dhaka City using optimization algorithms to provide urban planning and policy-making insights. The analysis examined the distribution of the TOD index values across the city and identified areas with varying levels of TOD potential. Two optimization algorithms, ant colony optimization (ACO) and particle swarm optimization (PSO), were employed to assess and compare the TOD index values. The results highlight the significance of transit infrastructure in promoting sustainable urban development, particularly in proximity to existing mass rapid transit (MRT) lines. PSO is more suitable for this study among the optimization algorithms because it offers a more precise TOD potential assessment. The findings suggest prioritizing investments in transit infrastructure and implementing TOD-friendly policies to foster sustainable urban growth and improve residents’ quality of life. Future studies can benefit from optimizing the algorithm parameters and incorporating real-world data to improve the accuracy of the TOD assessments.
1. Introduction
Transit-oriented development (TOD) is a strategic urban planning approach that integrates land use and transportation to create compact, livable, and sustainable cities [1]. As urban populations expand, efficient infrastructure planning becomes essential for ensuring TOD implementation [2]. However, existing TOD assessment methods often rely on static approaches that lack optimization capabilities, raising concerns about their reliability and adaptability in dynamic urban environments [3–5].
Traditional TOD assessment techniques, though foundational, often fail to account for the complex interdependencies among urban variables, leading to suboptimal results. These static models cannot dynamically adjust to urban changes, limiting their effectiveness in real-time decision-making. To address this gap, bioinspired optimization algorithms such as ant colony optimization (ACO) and particle swarm optimization (PSO) offer promising alternatives. Despite their success in fields like network design and healthcare, these algorithms have not been extensively explored for TOD planning. This study investigates the applicability of ACO and PSO to optimize the TOD index, enhancing its precision and adaptability for sustainable urban development. Given Dhaka’s rapid urbanization, incorporating advanced optimization techniques is crucial for identifying suitable TOD locations based on land use, transportation infrastructure, and demographic factors [6].
Urban planning is inherently multidimensional, requiring optimization techniques capable of balancing multiple objectives such as accessibility, traffic management, and sustainable land use [4, 7]. Traditional TOD planning approaches struggle to dynamically adapt to these interdependent factors, often yielding static, inefficient solutions. In contrast, ACO and PSO excel in navigating large and complex search spaces, allowing for dynamic adaptability to real-time data and urban changes. Effective TOD planning requires algorithms that can optimize conflicting goals—such as accessibility, environmental impact, and land use balance—by efficiently exploring the solution space to find high-quality optimization results [8, 9].
In recent years, bioinspired algorithms like ACO, PSO, genetic algorithms (GA), and artificial neural networks (ANN) have gained popularity in solving complex optimization problems across various domains [10, 11]. While these techniques have been successfully applied in network design and healthcare, their application in TOD assessment remains underexplored. Among these, ACO [12] and PSO [13] have demonstrated particular promise due to their ability to efficiently optimize multidimensional urban development indices. This study pioneers their application in TOD planning, aiming to enhance assessment methodologies for transit-oriented growth.
This research considers key TOD determinants, including population density (PD), commercial density (CD), employment density (ED), intersection density (ID), land use heterogeneity, walkability, and green spaces, to identify high-potential TOD areas [14]. Traditional TOD planning methods often rely on fixed parameters and historical data, limiting their adaptability to evolving urban conditions [1, 15]. These methods also struggle with multiobjective complexities such as balancing accessibility, land use efficiency, and transit utilization [14, 16]. To overcome these limitations, this study applies ACO and PSO to optimize the TOD index, ensuring that TOD planning aligns with urban dynamics, promotes sustainable growth, and prioritizes transit infrastructure investments [12, 13].
The optimization of TOD planning can be approached through single-objective or multiobjective optimization (MOO) techniques. A multiobjective approach optimizes conflicting goals—such as accessibility, land use efficiency, and sustainability—independently, while a single-objective approach consolidates these dimensions into a composite TOD index for simplified assessment [1, 15]. By employing advanced bioinspired optimization techniques, this study refines TOD assessment methods, enhancing their precision and applicability for dynamic urban environments.
The optimization of TOD planning can be approached through single-objective or MOO techniques. A multiobjective approach optimizes conflicting goals—such as accessibility, land use efficiency, and sustainability—independently, while a single-objective approach consolidates these dimensions into a composite TOD index for simplified assessment [1, 15]. By employing advanced bioinspired optimization techniques, this study refines TOD assessment methods, enhancing their precision and applicability for dynamic urban environments. In this study, TOD optimization is addressed as a single-objective problem, where the goal is to maximize the TOD index. The TOD index integrates various factors into a single metric, ensuring clarity and focus in the optimization process. This formulation provides a practical approach to assessing TOD potential while leveraging advanced optimization algorithms such as ACO and PSO [12, 13].
Advanced optimization techniques like ACO and PSO are well-suited to address these challenges. ACO, inspired by the foraging behavior of ants, excels in solving complex, combinatorial problems by iteratively refining solutions based on adaptive feedback [12]. PSO, modeled on the social behavior of bird flocks, is particularly effective in handling nonlinear and dynamic problems, making it ideal for optimizing TOD planning in rapidly changing urban contexts [13]. These algorithms offer robust solutions by efficiently exploring large search spaces, dynamically adapting to changing data, and balancing multiple conflicting objectives, such as accessibility and sustainability [17, 18].
By leveraging these techniques, this study enhances the precision and adaptability of TOD assessments, ensuring they align with evolving urban dynamics and effectively prioritize investments in transit infrastructure. These advancements represent a significant step toward more sustainable, efficient, and equitable urban planning frameworks.
This research aims to enhance the understanding and implementation of TOD by addressing the limitations of traditional TOD planning methods. The study’s primary objective is to optimize the TOD index by developing and implementing bioinspired optimization algorithms, namely, ACO and PSO, to refine and improve its precision and adaptability for urban planning. Furthermore, the study will evaluate the performance of ACO algorithm (ACOA) and PSO algorithm (PSOA) in handling complex, MOO tasks related to TOD planning. By analyzing spatial and functional data, including land use, transportation infrastructure, and demographic factors, the research aims to identify areas in Dhaka city with high TOD potential. Additionally, the study seeks to contribute to sustainable urban planning by providing actionable insights and methodologies that urban planners and policymakers can use to prioritize transit infrastructure investments and promote sustainable growth. Through these efforts, the research aims to advance the field of TOD, offering practical solutions for developing efficient, equitable, and sustainable urban environments.
This study makes significant advancements in the field of TOD by addressing existing gaps and introducing innovative methodologies. The key contributions of this research are manifold. The findings have profound implications for urban planners and policymakers in Dhaka and similar cities, enabling the formulation of environmentally friendly land use and transportation regulations that support TOD and improve residents’ quality of life. Additionally, this study pioneers the application of ACO and PSO in TOD planning, demonstrating their effectiveness in optimizing complex urban development indices. The methodology employed serves as a valuable resource for future investigations into the feasibility of TOD in other urban regions. By tackling challenges specific to high-density, resource-constrained environments like Dhaka, the study offers insights that are relevant to similar urban contexts globally.
2. Literature Review
2.1. Concept and Evolution of TOD
TOD is a strategic urban planning approach that creates dense, mixed-use, pedestrian-friendly communities near transit hubs [19]. TOD promotes efficient, environmentally friendly transportation, reduces car dependency, and improves urban accessibility and livability [1]. TOD creates compact, pedestrian-friendly, transit-oriented neighborhoods by integrating land use, transportation, and environmental planning [14]. Reduced traffic, transportation costs, air quality, physical activity, and economic development are TOD benefits [20]. An equitable, sustainable development model that prioritizes public transit users is also available [21]. Cervero and Arrington [22] found that TOD increased Portland transit ridership by 5%. Kamruzzaman et al. [16] found that TOD policies reduced car use and increased walking in Brisbane, Australia.
The TOD index is a composite metric that quantifies various dimensions of TOD, such as land use, accessibility, and pedestrian-friendliness [23]. Introduced by Cervero & Kockelman [19], the TOD index is used in urban planning initiatives and policy evaluations to gauge the efficacy of transit systems and the quality of the built environment [24]. Renne [14] utilized the TOD index to assess land use planning’s effectiveness in promoting transit-oriented neighborhoods. However, traditional TOD index models are static, using fixed variables and weights based on historical data, which may become outdated over time [15].
Since its inception, TOD has evolved to address issues beyond car dependency, incorporating social, economic, and environmental sustainability [25]. Early principles laid by Calthorpe advocated for mixed-use developments within walking distance of transit [26]. In cities like Mumbai and Jakarta, TOD principles have been adapted to tackle high PD and inadequate infrastructure, highlighting their flexibility [26]. However, a gap exists in understanding TOD’s implementation in rapidly developing cities facing infrastructural and socioeconomic challenges [27–30].
2.2. Rationale for Using Optimization Methods in TOD Planning
The choice to employ optimization methods in TOD planning stems from the need to address the inherent complexity and dynamic nature of urban environments. Traditional static models for calculating the TOD index, while foundational, have limitations in their ability to adapt to real-time changes and complexities within the urban landscape [15]. Optimization methods such as ACO and PSO are crucial for enhancing the precision and responsiveness of the TOD index.
The dynamic nature of urban variables makes TOD planning difficult without optimization methods. PD, land use patterns, and transit availability change constantly and affect TOD initiatives. Static models that use historical data and fixed variables often miss these dynamic changes, resulting in outdated or inaccurate assessments. Optimization methods can continuously update and improve the TOD index, keeping it relevant and accurate [12, 13].
TOD planning often involves multiobjective problems, which optimization methods excel at. In addition to transit accessibility, land use efficiency, economic viability, and environmental sustainability are goals. ACOA and PSOA can optimize multiple objectives simultaneously, giving TOD planning a holistic approach that static models cannot [31].
2.2.1. Optimization Techniques for Enhancing TOD Index Precision
- •
ACO: ACO is a metaheuristic optimization algorithm that draws inspiration from ant foraging [33]. These have been used in transportation planning to place and construct transportation infrastructure, including public transit systems, as efficiently as possible [34].
- •
PSO: The behavior of social groups, such as bird flocks and fish schools, inspired this metaheuristic optimization algorithm [13]. It has been used in transportation planning to place and construct transportation infrastructure, including public transit systems, as efficiently as possible [35].
- •
GA: GA is an optimization algorithm that draws inspiration from genetic inheritance and natural selection [36]. To place and construct transportation infrastructure, including public transit systems, as efficiently as possible has been used in transportation planning [37].
- •
Simulated Annealing (SA): SA is an optimization algorithm that draws inspiration from metallurgical annealing [38]. It has been used in transportation planning to place and construct transportation infrastructure, including public transit systems, as efficiently as possible [39].
- •
MOO: MOO is an optimization algorithm that considers multiple objectives concurrently instead of concentrating on a single objective [40]. These systems were used in transportation planning to place and construct transportation infrastructure, including public transit systems, as efficiently as possible [41].
These optimization algorithms can improve the potential TOD index by improving the weighting of the indicators used to gauge the potential for TOD and pinpointing the best sites for TOD. Planners and policymakers can prioritize investment and development efforts more efficiently, resulting in more sustainable, livable, and inclusive communities using optimization algorithms in potential transit-oriented development(PTOD) assessments.
2.3. Utilizing ACO and PSO for Enhanced PTOD Assessments and TOD Index Optimization
- •
Flexibility: ACO and PSO are adaptable tools for PTOD assessment, capable of handling various optimization problems and working with diverse data types and indicators [18].
- •
Capacity to Manage Complex Systems: These algorithms are adept at managing complex systems with multiple objectives and constraints, which is crucial in PTOD assessments where various factors must be considered [43].
- •
Rapid Convergence: Known for their ability to converge quickly to optimal solutions, ACO and PSO are valuable in PTOD assessments where time and resources are often limited [44].
- •
Capacity to Manage Uncertainty: Both algorithms can adapt to changing circumstances and manage uncertainty, which is essential in PTOD assessments where data uncertainty or planning and development environment changes may occur [45].
- •
Ease of Use: ACO and PSO are simple to set up and require minimal user input, making them accessible to planners and policymakers without a strong technical background [17].
- •
Handling Complex, Nonlinear Problems: ACO and PSO effectively manage complex, nonlinear problems involving land use patterns, PD, and socioeconomic indicators, which are integral to calculating the TOD index [46, 47].
- •
Maximizing Objective Functions: These algorithms maximize the objective function of the TOD index by balancing land use effectiveness, accessibility to transportation, and sustainability [31].
- •
MOO: In scenarios where multiple criteria must be optimized simultaneously, these algorithms efficiently handle MOO problems, enabling decision-makers to make informed decisions [48].
- •
Incorporating Spatial Information: These algorithms incorporate spatial information into their optimization processes, allowing the exploration of spatial configurations that maximize the TOD index [49, 50].
- •
Iterative Refinement: The iterative application of these algorithms refines the TOD index over time, considering updated data and objectives [51].
ACO and PSO with refined TOD index components help understand and plan for TOD, promoting sustainable urban development and efficient transportation [52]. Based on ant foraging behavior, ACO solves discrete variable combinatorial optimization problems using pheromone trials [12, 53]. PSO, inspired by social group behavior, solves nonconvex, nonlinear transportation planning problems and promotes sustainable urban infrastructure development [13, 54].
2.3.1. Rationale for Using ACO and PSO
ACO and PSO were chosen for this study because of their proven efficacy and versatility in solving complex, dynamic transportation planning optimization problems. ACO, inspired by ant foraging, solves complex combinatorial optimization problems with high variability, making it suitable for refining TOD index components and optimizing TOD site selection. Based on bird flock social behavior, PSO excels at navigating nonconvex, nonlinear problem spaces, which are common in urban planning scenarios with multiple, often conflicting goals. Both algorithms must rapidly converge and adapt to changing data and conditions to keep the TOD index accurate and relevant in real-time urban environments. ACO and PSO were chosen for their complementary strengths to create a robust and adaptable framework for TOD index optimization and sustainable urban development.
In conclusion, ACO and PSO have demonstrated their efficiency and adaptability in PTOD assessments and optimizing the TOD index. Their selection, however, depends on the specific characteristics and goals of the project.
2.4. Suitability of ACO and PSO for Multiobjective TOD Optimization
TOD optimization must balance accessibility, land use efficiency, sustainability, and transit utilization, making it a MOO problem. The flexibility and adaptability of advanced optimization methods like ACO and PSO make them ideal for multidimensional and multiobjective problems.
In MOO problems, ACO works well with frameworks like multiobjective ACO. The MOACO algorithm balances objectives and efficiently explores solution space by simulating pheromone deposition and feedback mechanisms [55]. It is robust for TOD optimization, which must consider spatial, economic, and environmental factors simultaneously.
PSO variants like multiobjective PSO have also been successful in MOO. The algorithm uses Pareto dominance principles to explore trade-offs between objectives and converge to a Pareto optimal front [56]. TOD optimization is enhanced by its dynamic adaptation to complex problem landscapes and interaction with urban data [18].
Both algorithms handle TOD planning’s high dimensionality and conflicting goals well. ACO solves combinatorial problems robustly, while PSO optimizes nonlinear, dynamic tasks [12, 17]. This study addresses urban development planning challenges by integrating these algorithms to optimize the TOD index precisely and adaptably.
Thus, TOD optimization using ACO and PSO improves multiobjective urban planning problem management. For sustainable, accessible, and well-integrated transit-oriented urban environments, these methods are reliable and efficient.
2.5. Advanced Optimization Techniques in TOD Assessment
- •
Gradient-Guided Evolutionary Neural Architecture Search: This approach combines gradient-based optimization with evolutionary search mechanisms to design convolutional neural networks (CNNs) for feature selection and classification [58]. It has been effectively applied in image classification tasks, achieving high accuracy while reducing computational costs. However, its potential application in TOD remains unexplored. Compared to ACO and PSO, this approach provides higher feature selection accuracy but requires greater computational resources, making it more suitable for high-performance computing applications than large-scale urban simulations.
- •
Self-Adaptive PSO for Large-Scale Feature Selection: A modification of traditional PSO introduces self-adaptive mechanisms to adjust algorithm parameters dynamically, improving performance in large-scale feature selection problems [59]. It has demonstrated effectiveness in handling high-dimensional datasets, making it applicable for TOD evaluations where multiple urban factors must be optimized simultaneously. While PSO is applied in this study, self-adaptive PSO could further enhance real-time adaptability in transit planning models.
- •
Importance-Based PSO with Deep Learning: Importance-guided particle swarm optimization (IGPSO) enhances large-scale feature selection by integrating PSO with multilayer perceptron (MLP)–based deep learning [60]. IGPSO utilizes a feature importance vector to guide population initialization and evolution, improving convergence and classification accuracy. By replacing traditional PSO parameters with importance-driven factors, it efficiently selects relevant features while reducing computational costs. Although widely used in data optimization, its application in TOD planning remains unexplored. Implementing IGPSO in TOD assessments could enhance spatial and transit suitability analysis by leveraging adaptive feature selection techniques.
- •
Ensemble of Differential Evolution (DE) for Optimization: DE is a powerful heuristic method used for global optimization, particularly in complex problem-solving [61]. This method has been successfully applied in urban transportation models to enhance MOO. An ensemble-based approach improves performance by combining multiple DE variants, increasing solution diversity and search efficiency. For TOD applications, this technique could be integrated with ACO and PSO to further enhance transit planning optimization.
- •
Adam Optimizer for Training Feed-Forward Neural Networks: The Adam optimizer is an adaptive learning rate method used to train feed-forward neural networks, improving gradient descent efficiency [62]. It has been widely used in predictive modeling, transportation demand forecasting, and optimization problems. In the TOD context, Adam-optimized neural networks could learn spatial relationships between transit infrastructure and urban development, improving the adaptability of TOD index assessments.
2.5.1. Research Gap and Study Contribution
Despite advancements in optimization techniques, their application in TOD assessment remains limited. Traditional approaches, such as multicriteria decision-making (MCDM) and analytic hierarchy process (AHP), rely on static models that fail to incorporate real-time data, reducing their adaptability in evolving urban contexts [14, 16]. While ACO and PSO have proven effective for TOD optimization, integrating self-adaptive machine learning techniques could further improve accuracy and adaptability. This study bridges this gap by applying ACO and PSO while highlighting emerging evolutionary and machine learning-based approaches, such as gradient-guided NAS, importance-based PSO, DE, and Adam-optimized neural networks. These methodologies pave the way for more adaptive, data-driven, and efficient TOD assessments, supporting sustainable urban planning.
2.6. Applications of ACO and PSO in Traffic Optimization
- •
ACO and PSO have optimized traffic signal timings in urban road networks, substantially reducing traffic congestion and improving the overall traffic flow [66]. These algorithms consider signal coordination, intersection geometry, and traffic demand.
- •
These algorithms have demonstrated their efficacy in vehicle routing, determining optimal routes for delivery vehicles, emergency services, and public transportation [67]. They consider travel time, distance, and congestion while minimizing costs and maximizing service efficiency [68].
- •
ACO and PSO have effectively estimated travel demand trends, vital for infrastructure planning and transportation administration [69]. They can optimize demand models, analyze historical data, and predict future travel patterns.
- •
ACO and PSO have found applications in intelligent transportation systems (ITS), including dynamic route guidance, traffic management, and adaptive traffic control systems [70]. They iteratively optimized parameters related to traffic and adapted them to the current conditions to improve traffic efficiency.
- •
Traffic flow optimization has also benefitted from applying ACO and PSO, determining the optimal lane configurations to maximize traffic efficiency and minimize congestion [71, 72].
2.7. Advancing Dhaka’s Urban Planning Through a Refined TOD Index
The prospects of TOD in Dhaka have gained significant traction with the initiation of the Dhaka Metro Rail (DMR) project aimed at alleviating notorious traffic congestion in the city. The frameworks provided by [5] have shed light on the potential of TOD around transit nodes; however, there remains a compelling need for a more comprehensive examination of the Dhaka metropolitan area, particularly around the planned mass rapid test (MRT) lines, to better understand the development potential and foster urban sustainability [4].
- •
Addressing First-and-Last-Mile Challenges: The first and last miles of a transit trip, denoting the journey to and from transit stations, are crucial for enhancing transit accessibility. A study concerning Dhaka’s suburban commuters accentuates the importance of understanding the dynamics of the first and last miles to improve transit accessibility and the overall efficiency of transit services [29].
- •
Spatial Accessibility and Urban Sprawl Control: To curb urban sprawl and enhance accessibility to urban facilities, Dhaka’s urban planning initiatives, such as DMDP-1995 and DSP-2015, propose central mass transit nodes as pivotal elements. The proposed bus rapid transit (BRT) and MRT systems are steps toward achieving improved spatial accessibility [30].
- •
Modal Mismatch and Accessibility Gaps: A study on modal mismatch and accessibility in Dhaka portrays the spatiotemporal variations in car and public bus accessibility, shedding light on the existing transportation accessibility challenges. An optimized TOD index can potentially bridge these accessibility gaps, fostering a more equitable transit system [28].
- •
Potential Mobility and Accessibility Enhancements: An overview of the public transportation system in metro Dhaka provides insights into the key issues and improvement options, which can be instrumental for policy formulation guided by an optimized TOD index [73].
- •
Transit Performance Evaluation: The performance of Dhaka’s public transportation system reveals challenges such as connectivity, quality of service, and ridership. An optimized TOD index can address these challenges, enabling more targeted and effective transit planning [27].
The nodal analysis of TOD around MRT Line-6 in Dhaka elucidated by [4] presented a framework for measuring the TOD index and planning for TOD improvements within walking distance of station areas, particularly for emerging cities, such as Dhaka [4]. Integrating such frameworks with insights from various studies on Dhaka’s urban and transit dynamics could significantly enrich urban planning strategies, aiding effective policy implementation, planning, and decision-making for future TOD endeavors in Dhaka.
3. Methodology
3.1. Identifying TOD Input Variables
This study focuses on TOD in Dhaka, Bangladesh, leveraging the 4Ds framework (density, diversity, destination accessibility, and design) proposed by [4]. The 4Ds framework has been widely recognized in the literature for its comprehensive approach to assessing TOD potential. The authors in [4] measured the nodal TOD index in the MRT system in Dhaka, emphasizing key elements such as urban density growth, diverse land use, improved walking and cycling connectivity, and the provision of open spaces with parking facilities.
3.1.1. Input Variables
To operationalize the 4Ds framework, we identified eight TOD input variables by analyzing successful TOD case studies [5, 20, 74, 75] and considering data availability specific to Dhaka. The selected variables are detailed in Table 1.
| TOD variables | Unit |
|---|---|
| Population density (PD) | Number of residents/km2 |
| Commercial density (CD) | Number of commercial enterprises/km2 |
| Employment density (ED) | Number of employees/km2 |
| Land use diversity (LUD) | Mic percent |
| Land use mixedness (LUM) | Mixedness index |
| Walkable and cyclable length (WCL) | km |
| Intersection density (ID) | Number of intersections/km2 |
| Open and green spaces (OGS) | km2 |
3.1.2. Justification for Variable Selection
- •
PD: Represents the concentration of residents in a given area, influencing transit ridership and the viability of public transportation systems.
- •
CD: Reflects the availability of commercial services, which impacts the convenience and attractiveness of transit-oriented areas.
- •
ED: Indicates the number of jobs available within a certain area, which can drive transit usage for commuting purposes.
- •
Land Use Diversity (LUD): Measures the variety of land uses within an area, promoting a mix of residential, commercial, and recreational activities that enhance the livability and functionality of TOD areas.
- •
Land Use Mixedness (LUM): Captures the degree of land use integration, supporting the synergy between different land use types and promoting efficient land use.
- •
Walkable and Cyclable Length (WCL): Represents the extent of infrastructure supporting nonmotorized transportation, crucial for first- and last-mile connectivity.
- •
ID: Indicates the complexity and connectivity of the road network, affecting pedestrian and vehicular movement and access.
- •
Open and Green Spaces (OGS): Reflects the availability of recreational and green spaces, which are essential for creating sustainable and livable urban environments.
3.2. Calculating TOD Input Variables
The analysis of the TOD index was conducted by calculating the TOD input variables for each grid cell in the raster map of Dhaka City. The process involves several steps, detailed below, to ensure a systematic and reproducible approach.
3.2.1. Step 1: Study Area and Raster Map Creation
This study analyzed Dhaka City’s entire area, covering 306.25 square kilometers, including both the north and south city corporations. A raster map with grid cells was created to efficiently store and analyze geographic information for the TOD variable analysis. Raster maps were generated from vector data that captured features like points, lines, and polygons.
3.2.2. Step 2: Grid Cell Size Selection
To optimize the analysis, we determined that a 380 × 380 m grid cell size was the most effective for analyzing attributes and calculating the TOD index. A total of 2165 grid cells were used, covering 144.4 square kilometers of the area. This grid size was selected based on several key metrics, including computational efficiency and predictive accuracy. Smaller grid sizes increased the computational load without significantly improving the index reliability, while excessively large grid sizes reduced the granularity of the analysis, leading to less accurate representations of TOD patterns. Therefore, a grid size of 380 × 380 m was chosen as a compromise between coarser 500 × 500 m grids and finer 100 × 100 m grids, aligning well with available spatial data while balancing computational efficiency and detail.
3.2.3. Step 3: Calculation of TOD Input Variables
The TOD input variables were calculated for each grid cell using a 500-m TOD service cell (TSC) around each cell. The TSC variable values represented the TOD potential for each grid cell, covering 0.79 square kilometers. This approach aligns with the Institute of Transport and Development Policy’s (ITDP) recommendation for frequent bus stops within a 500-m radius and guidelines from Cochin and Mumbai City. Previous studies, such as [76], also referred to a 500-m analysis window around transit stations.
3.2.4. Step 4: Detailed Calculation Methods
- •
PD: Calculated as the number of residents per square kilometer using census data.
- •
CD: Determined by counting the number of commercial enterprises per square kilometer based on business registry data.
- •
ED: Measured as the number of employees per square kilometer using employment records.
- •
LUD: Assessed as the percentage of mixed land use types within each grid cell, derived from land use maps.
- •
LUM: Calculated using a mixedness index that captures the degree of integration of different land use types.
- •
WCL: Measured as the total length of walkable and cyclable paths in kilometers within each grid cell, using GPS tracking and field surveys.
- •
ID: Determined by counting the number of intersections per square kilometer from detailed road network maps.
- •
OGS: Calculated as the area of OGS in square kilometers using satellite imagery and urban green space records.
Each of these variables was calculated within the 500-m radius TSC to ensure consistency and accuracy in representing the TOD potential of each grid cell.
3.3. Determination of TOD Index Using ACOA and PSOA
This study calculated the TOD variable values for the grid cells. The ACOA and PSOA were used in Python to determine the variable weights. The maximum TOD for each cell was determined using a simple additive weighting (SAW) method. Details of the ACO and PSO optimization processes and TOD index maximization techniques are provided in the following sections.
3.3.1. Fitness Function and Search Space
3.3.1.1. Fitness Function
- •
Xj represents the value of the jth TOD input variable for a grid cell.
- •
wj is the weight associated with the jth TOD input variable.
- •
n is the total number of TOD input variables.
The goal of the optimization is to find the optimal set of weights {wj} that maximizes the TOD index F(X).
3.3.1.2. Search Space
This range ensures that the weights are non-negative and normalized, allowing for a fair contribution of each TOD input variable to the overall index.
3.3.2. Optimization With ACOA
3.3.2.1. Step 1: Initialization
3.3.2.2. Step 2: Solution Construction
3.3.2.3. Step 3: Fitness Evaluation
3.3.2.4. Step 4: Updating the Pheromone
3.3.2.5. Step 5: Decision-Making Process
3.3.3. Optimization With PSOA
3.3.3.1. Step 1: Initialization of Particles
3.3.3.2. Step 2: Solution Construction
3.3.3.3. Step 3: Fitness Evaluation
3.3.3.4. Step 4: Velocity Update
3.3.3.5. Step 5: Personal Best Update
3.3.3.6. Step 6: Global Best Update
Finally, the weighted-sum approach is used to calculate the weighted sum of the decision variables to determine the TOD index (Equation (9)).
3.3.4. Hyperparameters for the Algorithms
The hyperparameters in optimization algorithms are adjustable parameters predefined by the user or researcher that influence the algorithm’s performance and convergence during optimization. The specific hyperparameters for the ACO and PSO algorithms used in this study are listed in Table 2 and described in detail.
| Parameter | ACOA | PSOA |
|---|---|---|
| Number of ants | 6 (for optimized weights) | |
| Number of iterations | 6 (for optimized weights) | 95 (for optimized weights) |
| Alpha (relative importance of the pheromone) | 1 | |
| Beta (relative importance of the heuristic information) | 1 | |
| Evaporation rate | 0.1 | |
| Initial pheromone level | Initialized to 1/8 for each path | |
| Number of particles | 250 (for optimized weights) | |
| Inertia weight (Ω) | 0.5 | |
| Cognitive parameter | 0.5 | |
| Social parameter | 0.5 | |
| Maximum velocity | 8 |
3.3.4.1. ACOA Hyperparameters
- •
Number of Ants: The number of ants represents the number of potential solutions or agents in the algorithm. In this study, we used 6 ants for optimized weights. A higher number of ants can improve exploration of the solution space but increases computational complexity.
- •
Number of Iterations: This is the number of cycles the algorithm runs. For optimized weights, we used six iterations. More iterations allow the algorithm to refine solutions further but also increase computational time.
- •
Alpha (α): The relative importance of the pheromone trail. We set α to 1, indicating that the pheromone trail and heuristic information are equally important in guiding the ants.
- •
Beta (β): The relative importance of the heuristic information. We set β to 1, similar to α, to balance the influence of pheromone and heuristic information.
- •
Evaporation Rate (ρ): This parameter controls the rate at which the pheromone evaporates. We set the evaporation rate to 0.1. A higher evaporation rate decreases the influence of older pheromones, promoting the exploration of new paths.
- •
Initial Pheromone Level: The initial amount of pheromone assigned to each path. We initialized the pheromone level to 1/8 for each path to ensure a uniform start and allow the algorithm to build up pheromone trails based on solution quality.
3.3.4.2. PSOA Hyperparameters
- •
Number of Particles: The number of particles represents the number of potential solutions or agents in the algorithm. We used 250 particles for optimized weights. More particles can enhance solution diversity but increase computational cost.
- •
Number of Iterations: For optimized weights, we used 95 iterations. This allows sufficient time for the particles to converge on an optimal solution.
- •
Inertia Weight (w): This parameter controls the impact of the previous velocity on the current velocity. We set the inertia weight to 0.5, balancing exploration and exploitation by the particles.
- •
Cognitive Parameter (c1): The cognitive parameter represents the influence of the particle’s own best position on its current movement. We set c1 to 0.5, ensuring a balanced consideration of individual and social learning.
- •
Social Parameter (c2): The social parameter represents the influence of the global best position on a particle’s movement. We set c2 to 0.5, similar to the cognitive parameter, to balance personal and group influences.
- •
Maximum Velocity: This parameter limits the maximum change in velocity to prevent particles from moving too quickly. We set the maximum velocity to 8, ensuring controlled adjustments while exploring the solution space.
3.3.5. Derivation of Hyperparameters
The hyperparameters used in this study for the ACOA and PSOA, as presented in Table 2, were determined through a systematic process to ensure optimal performance for the given TOD optimization problem. The derivation involved the following steps.
3.3.5.1. Trial-and-Error Method
An initial set of hyperparameter values was selected based on commonly used ranges reported in the literature [12, 13]. These initial values were iteratively refined through trial-and-error experimentation to assess their impact on convergence speed, solution quality, and computational efficiency.
3.3.5.2. Preliminary Experiments
Preliminary experiments were conducted to evaluate the sensitivity of the algorithms to different hyperparameter values. For ACO, parameters such as the pheromone evaporation rate (ρ\rhoρ) and the influence of pheromone and heuristic information (α\alphaα and β\betaβ) were varied systematically to observe their effects on the optimization process. Similarly, for PSO, parameters like inertia weight (w), cognitive parameter (c1), and social parameter (c2) were tested to identify the range that led to stable and efficient convergence.
3.3.5.3. Reference to Similar Studies
3.3.5.4. Grid Search for Fine-Tuning
A grid search was performed for key hyperparameters to fine-tune the algorithm settings. This approach involved systematically evaluating a predefined range of values for each parameter to identify the combination that yielded the best performance for the TOD optimization problem. The performance metrics included solution quality, computational time, and convergence behavior.
3.3.5.5. Final Selection
The final set of hyperparameters was chosen based on their ability to balance solution quality and computational efficiency. These values were verified through additional validation runs to ensure their robustness under varying problem conditions.
3.4. Visualization and Hotspot Analysis
This section describes the methodologies used for visualizing TOD index values and identifying hotspots in Dhaka City. The ACOA and PSOA categorized the TOD index values into six ranges, which were then mapped to Dhaka City to facilitate spatial analysis.
3.4.1. Categorization and Mapping of TOD Index Values
The TOD index values calculated using ACOA and PSOA were categorized into six distinct ranges. These ranges help in visualizing the spatial distribution of TOD potential across Dhaka City. The categorization was performed using standard classification techniques, ensuring clear demarcation of different TOD potential levels.
3.4.2. Hotspot Analysis
- 1.
Getis–Ord Gi∗ Statistic: The Getis–Ord Gi∗ statistic identifies statistically significant hot and cold spots. High Gi∗ values indicate clusters of high TOD index values (hot spots), while low Gi∗ values indicate clusters of low TOD index values (cold spots).
- 2.
Anselin local Moran’s I: Anselin local Moran’s I measures spatial autocorrelation, identifying clusters of similar values. High positive values indicate spatial clustering of similar values (either high or low), while negative values indicate spatial outliers.
- 3.
Significance Testing: Both methods include significance testing to ensure the identified clusters are statistically significant. This is done using z-scores and p values, which help determine the reliability of the observed spatial patterns.
3.4.2.1. Spatial Pattern Analysis
- 1.
Moran’s I: Moran’s I is a global measure of spatial autocorrelation. It indicates whether the TOD index values are clustered, dispersed, or randomly distributed across Dhaka City. The index ranges from −1 (perfect dispersion) to +1 (perfect clustering), with 0 indicating randomness.
- 2.
Z-score and p value: The z-score and p value are used to test the significance of Moran’s I. A high absolute z-score and a low p value indicate significant clustering or dispersion.
3.5. Results Interpretation
These analyses help identify transit-rich areas and regions with low TOD potential [77]. Policymakers can use these insights to plan sustainable TOD initiatives. For instance, areas identified as hot spots can be prioritized for further development and investment, while cold spots may require interventions to enhance their TOD potential.
3.6. Performance Analysis and Validation
This section describes the various cross-validation and performance analyses conducted to validate the results and assess the performance of the ACOA and PSOA used in this study.
3.6.1. Performance Analysis
Various cross-validation and performance analyses were conducted for both the ACOA and PSOA to validate the results and assess their performances.
3.6.1.1. Cross-Validation
- •
Method: The TOD index map accuracy of the ACOA and PSOA was validated using cross-validation [80]. The data were divided into subsets, and the model was trained and validated multiple times to improve reliability and robustness.
- •
Measure: The mean R-squared values indicated good model performance, demonstrating the algorithms’ ability to predict TOD index values accurately.
3.6.1.2. Bootstrap Validation
- •
Method: Bootstrap validation, a resampling technique [81], was used to estimate the accuracy of the statistical models for the TOD index maps generated by the ACOA and PSOA.
- •
Measure: This technique assessed the effectiveness and reliability of the models by generating multiple bootstrap samples and calculating the mean performance metrics.
3.6.1.3. Holdout Validation
- •
Method: Holdout validation divided the data into training and validation sets for model assessment [82]. Stratified sampling was used to address the split ratio choice and imbalanced datasets.
- •
Measure: The ACOA and PSOA generated TOD index maps that were evaluated using the correlation coefficient and mean absolute error, ensuring robust performance assessment.
3.6.1.4. Sensitivity Analysis
- 1.
Interquartile Range (IQR) Analysis:
- •
Method: The IQR was used to measure the spread of TOD index values predicted by the ACOA and PSOA. This analysis helps to identify the variability in the TOD index predictions, focusing on the middle 50% of the data.
- •
Measure: The IQR provides insights into the stability and consistency of the algorithms’ predictions.
- •
- 2.
Consistency Analysis:
- •
Method: Consistency analysis involved comparing the TOD index values predicted by the algorithms across different scenarios to the base scenario. This approach ensures that the algorithms produce consistent results under varying conditions. In this study, the consistency of the algorithms in assessing the TOD index under different scenarios was essential. The algorithm consistently produces higher or lower values that can be identified by comparing the TOD index values with the base scenario. Measures such as comparison with the base scenario and assessing variation contribute to the consistency of the results. The authors focused on the TOD index values of each scenario relative to the base scenario to ensure that the differences were within an acceptable range.
- •
Measure: The consistency of the algorithms was assessed by analyzing the variation in TOD index values relative to the base scenario.
- •
- 3.
Coefficient of Variation (CV) Analysis:
- •
Method: The CV was calculated to measure the relative variability in the sensitivity analysis of the TOD index. The CV is the ratio of the standard deviation to the mean, providing a normalized measure of dispersion.
- •
Measure: Lower CV values indicated greater consistency, whereas higher values implied greater variability.
- •
- 4.
Standard Deviation Analysis:
- •
Method: The standard deviation of the TOD index values was calculated to assess the variability and reliability of the algorithms’ predictions. The standard deviation measures the extent of variation or dispersion from the mean.
- •
Measure: A lower standard deviation indicates more consistent outcomes, while a higher standard deviation suggests greater variability.
- •
-
K-Fold Cross-Validation:
- •
Method: K-fold cross-validation was employed to prevent overfitting and optimize hyperparameters [84]. The data were divided into five subsets, and the model was trained and tested iteratively.
- •
Measure: Scatter plots of predicted versus actual TOD index values were used to assess accuracy. Performance metrics, including average mean squared error (AMSE), root mean squared error (RMSE), and average mean absolute error (AMAE), were calculated and compared to determine the algorithms’ performance.
- •
3.6.2. Validation of ACOA and PSOA Using MRT Lines
- •
Buffer Area Analysis: Consistent TOD index values within the buffer areas were calculated to validate the algorithms’ accuracy. The use of buffer areas around MRT lines provided a realistic assessment of TOD potential, aligning with transportation planning policies.
- •
Spatial Patterns: The analysis revealed spatial patterns in TOD index values, guiding urban development and transportation planning. These patterns highlighted transit-rich areas and regions with low TOD potential, informing policymakers about areas needing investment and development.
3.6.2.1. Key Findings
- •
The consistent TOD index values within the 800-m buffer areas improved the algorithms’ accuracy.
- •
Spatial patterns identified through this analysis can guide urban development and transportation planning policies, ensuring sustainable growth and efficient use of resources.
4. Results
4.1. TOD Index Optimized With ACOA
4.1.1. Distribution of TOD Index for ACOA
The distribution of the TOD index optimized using the ACOA is presented in Figure 1. This analysis involved the calculation of TOD input variables for each grid cell, using the ACOA to determine the optimal weights for these variables. The distribution chart (Figure 1(a)) shows the TOD index ranges in Dhaka, with the majority of grid cells falling within the 0–0.075 range (dark green). This aligns with our methodology, where a grid cell size of 380 × 380 m was used to balance computational efficiency and detail, ensuring a precise spatial analysis.
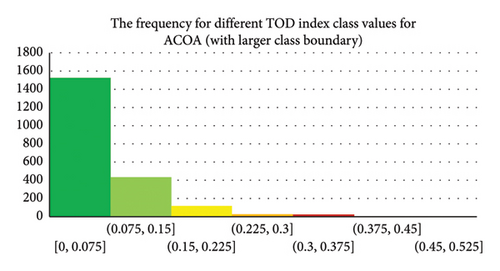
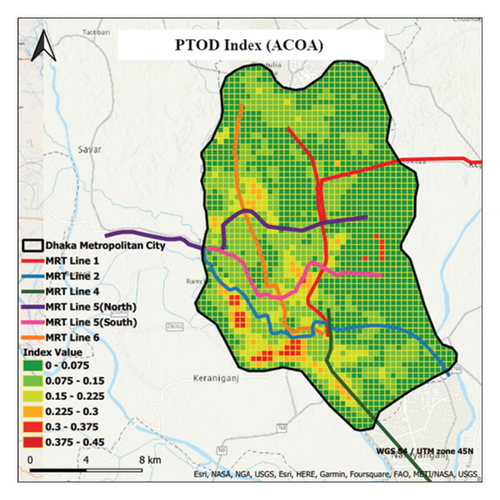
Figure 1(b) indicates that most grid cells fall within the 0–0.075 range (dark green), distant from the MRT lines. Cells with a TOD index of 0.075–0.15 (light green) are fewer but closer to MRT lines, mainly in the west. Yellow (0.15–0.225) range cells are even less frequent near MRT lines, especially 2, 5 (north), and 5 (south) in the west. Grid cells in the 0.225–0.3 (light orange) range are scattered within the 0.15–0.225 range (yellow). The 0.3–0.375 range (light red) and 0.375–0.45 range (dark red) cells are very few and form pockets inside the 0.225–0.3 range in the southwestern area, relatively closer in distance from MRT line 2.
4.1.2. Hotspot Analysis for ACOA
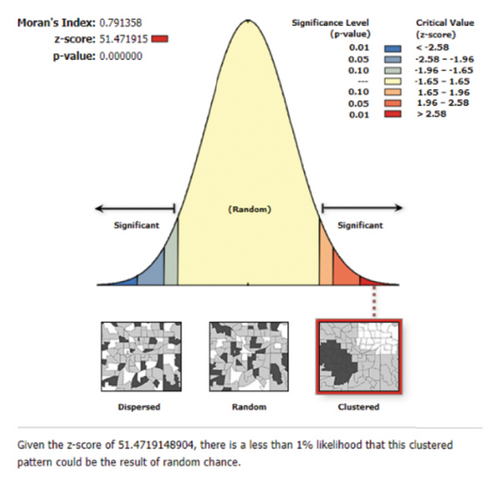
The TOD index hotspot analysis using ACOA showed strong spatial autocorrelation, with a Moran’s index value of 0.791,358 (p value ≤ 0.001, z-score = 51.471,915). This analysis using the Getis–Ord Gi∗ statistic and Anselin local Moran’s I was crucial to understanding TOD potential spatial patterns. The methodology described how these statistics identify high and low TOD clusters for spatial analysis robustness.
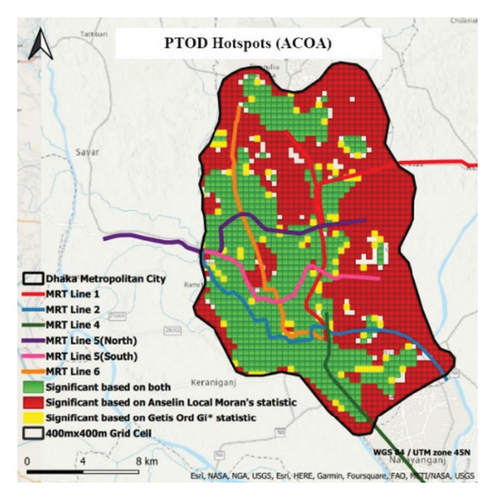
Figure 2(a) shows random clustering probability. Results show that areas with similar TOD index values cluster, suggesting Dhaka TOD patterns. The ACOA and weighted-sum method hotspot map (Figure 2(b)) show TOD potential zones. The northern and eastern areas without MRT lines are dark green, indicating low TOD potential and spatial autocorrelation. The western part of the city has a gradient of light green, yellow, light orange, light red, and dark red areas, indicating spatial autocorrelation and clustering of high or low TOD values. The Getis–Ord Gi∗ statistic alone indicates moderate TOD potential in a few yellow grid cells in the southwest.
4.2. TOD Index Optimized With PSOA
4.2.1. Distribution of TOD Index for PSOA
The distribution of the TOD index optimized using the PSOA is presented in Figure 3. This analysis involved the calculation of TOD input variables for each grid cell, using the PSOA to determine the optimal weights for these variables. The PSOA, as detailed in our methodology, effectively balances exploration and exploitation to find the optimal set of weights.
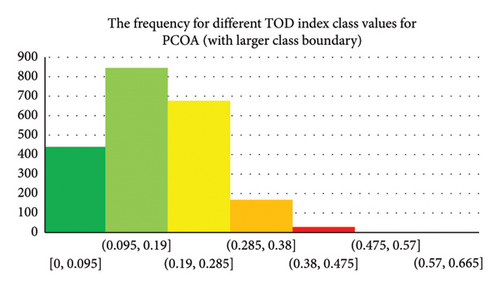
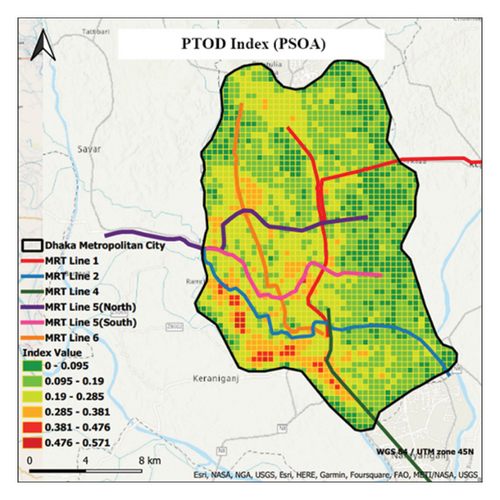
Figure 3(a) illustrates the distribution of TOD index values across Dhaka City, with grid cell frequencies in different ranges color-coded as follows: dark green (0.095–0.19), light green (0.19–0.285), yellow (0.285–0.38), orange (0.38–0.476), and light red (0.476–0.571). This distribution reflects the methodology’s use of grid cells and the PSOA’s optimization process, ensuring a comprehensive analysis of TOD potential.
In Figure 3(b), the TOD index map reveals that most grid cells fall within the 0.095–0.19 range, concentrated in the north and east areas with fewer MRT lines. This pattern supports our methodology’s approach, which considers the spatial relationship between TOD potential and MRT line availability. The 0.19–0.285 range covers a large western area with MRT lines, highlighting areas with moderate TOD potential. Grid cells in the 0.285–0.38 range are close to MRT lines 2, 4, and 5, showing a higher TOD potential due to proximity to transit infrastructure. The 0.38–0.476 range has fewer cells located in the southwest near MRT lines 2 and 4, while the 0.476–0.571 range has even fewer cells, indicating high TOD potential in these isolated areas.
4.2.2. Hotspot Analysis for PSOA
PSOA hotspot analysis of the TOD index showed significant spatial autocorrelation, confirming clustering patterns. Anselin local Moran’s I and Getis–Ord Gi∗ statistics were used in our methodology to identify high and low TOD clusters.
Figure 4(a) shows random clustering probability. There was significant spatial autocorrelation in the TOD index ranges of 0–0.095 and 0.095–0.19, indicating cell similarity. Our spatial statistical analysis methodology matches this spatial pattern, ensuring robustness and reliability.

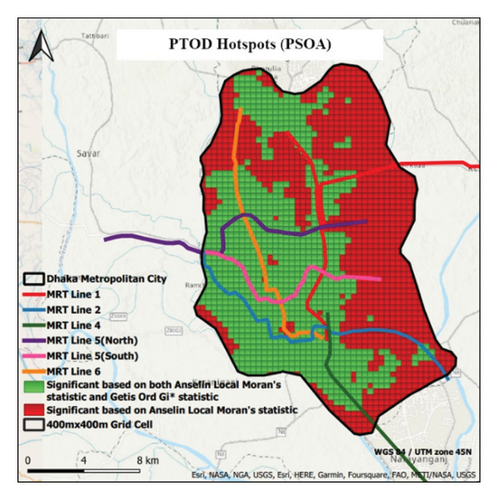
The PSOA and weighted-sum method–generated TOD hotspot map (Figure 4(b)) confirm the significant clustering of similar TOD index values. Clusters suggest MRT line proximity and LUD influence patterns. These findings support the methodology’s use of spatial statistical methods to find TOD patterns in Dhaka City.
4.3. Performance Analysis for ACOA and PSOA
4.3.1. Cross-Validation, Bootstrap Validation, and Holdout Validation
The performance of the ACOA and PSOA was evaluated using cross-validation, bootstrap validation, and holdout validation methods, as detailed in the methodology.
4.3.1.1. Cross-Validation
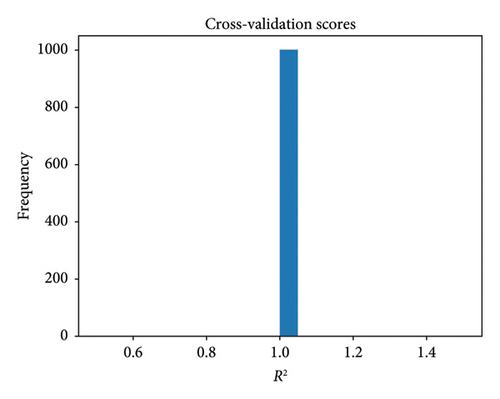
The cross-validation analysis for the ACOA and PSOA, shown in Figure 5, produced a mean R-squared value of 1.0 with a standard deviation of 0. This perfect fit indicates that both algorithms effectively predict TOD index values across the different subsets, validating their robustness and reliability in different sample sets, aligning with the cross-validation methods detailed in Section 3.5.1.
4.3.1.2. Bootstrap Validation
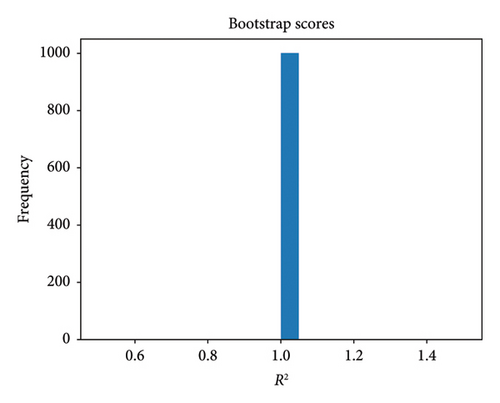
Bootstrap validation, depicted in Figure 6, confirmed the high accuracy and reliability of the ACOA and PSOA. With a mean R-squared value of 1 and a standard deviation of 0, the results demonstrated consistent predictions free of random fluctuations, supporting the methodology’s approach to estimating model accuracy through resampling techniques. The narrow 95% confidence interval [1.0, 1.0] supported consistent predictions and was free of random fluctuations.
4.3.1.3. Holdout Validation
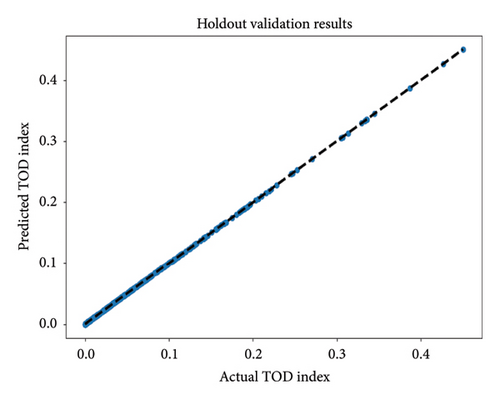
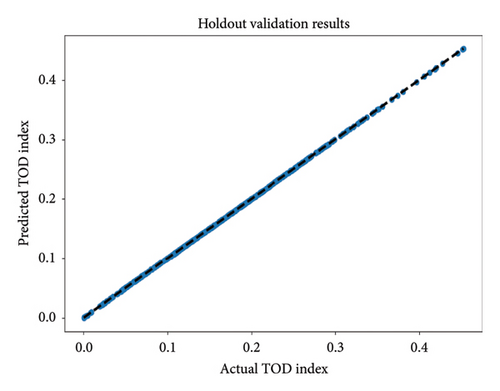
Holdout validation, shown in Figure 7, indicated that the ACOA and PSOA achieve a perfect match (R-squared = 1) with the actual TOD index values. This consistent ratio of predicted to actual values demonstrates the high accuracy of both algorithms, as described in the holdout validation method.
4.3.2. Sensitivity Analysis
Sensitivity analysis was performed to evaluate the impact of varying input parameters on the TOD index values. This analysis helps to identify influential variables and assess the stability and robustness of the algorithms.
4.3.2.1. Sensitivity Analysis Results
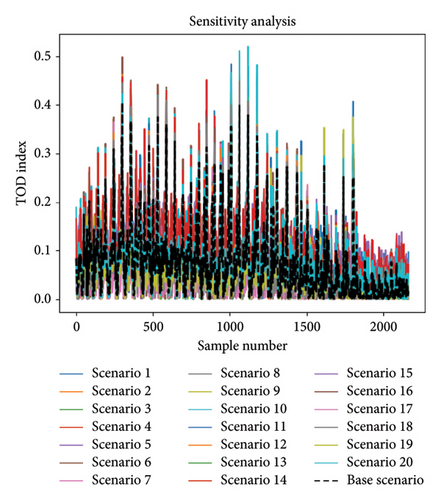
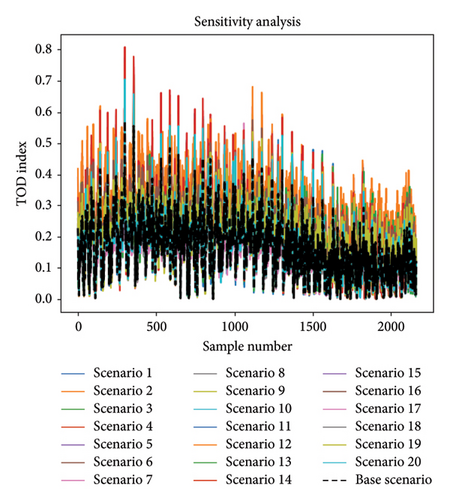
Figure 8 compares the TOD index values for the ACOA and PSOA across different scenarios. The PSOA yielded higher TOD index values (approximately 0.8) compared to the ACOA (approximately 0.5), indicating greater sensitivity to input parameters. The PSOA’s wider TOD index range suggests higher sensitivity, while the ACOA’s stability makes it suitable for practical applications requiring consistency, as detailed in the sensitivity analysis methodology.
4.3.2.2. IQR Analysis
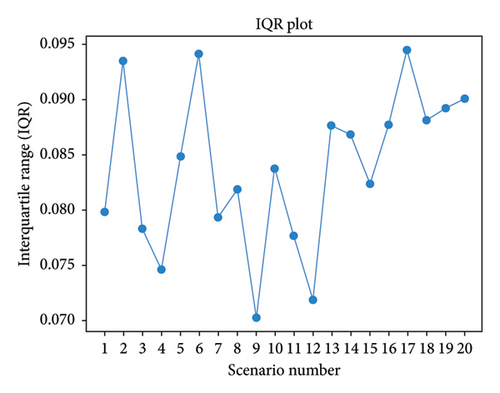
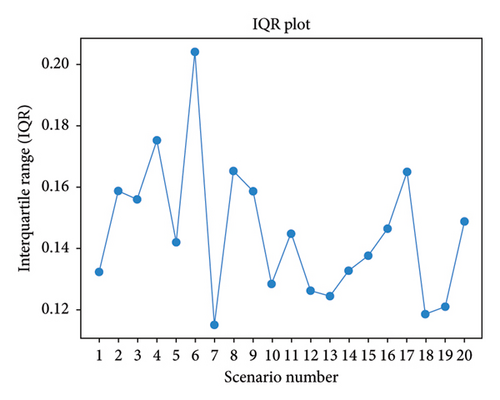
Figures 9(a) and 9(b) show the IQR plots for the TOD index spread in the algorithms. ACOA’s IQR (0.070–0.094) indicates stability, while PSOA’s range (0.115–0.204) suggests higher variability. This analysis helps determine the robustness of each algorithm, supporting the methodology’s approach to assessing TOD index variability.
4.3.2.3. Consistency Analysis
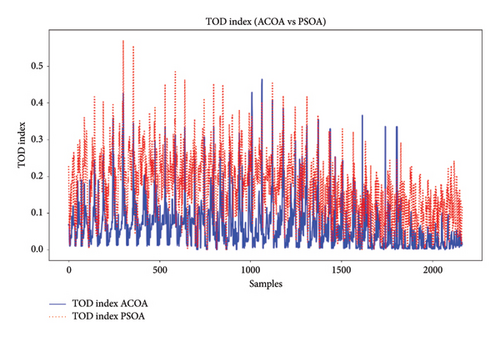
Figure 10 illustrates the changes in the TOD index and its range across all ACOA and PSOA samples. The ACOA showed higher sensitivity to input parameter changes, whereas the PSOA proved more stable and robust. This analysis helps determine which algorithm is more reliable for TOD index assessment, aligning with the methodology’s approach to consistency evaluation.
4.3.2.4. CV Analysis
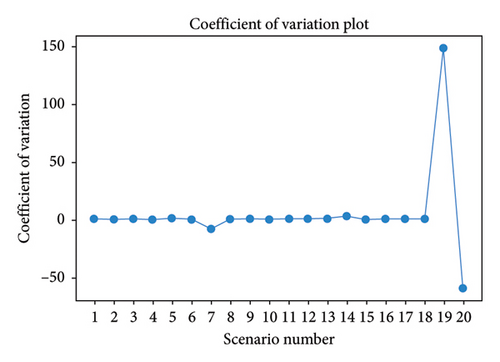
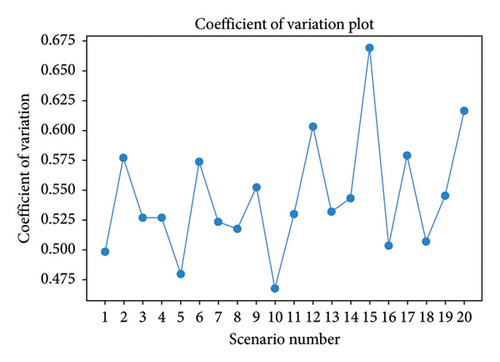
Figures 11(a) and 11(b) show the CV plots of both algorithms. The CV of the ACOA ranges from −58.46 to 148.74, showing instability in the results. In contrast, the PSOA exhibits higher stability and reliability, with CV values from 0.47 to 0.67. The PSOA consistently produces lower and uniform CV values, making it a superior predictor for future TOD index values compared to the ACOA. Other measures should be considered for a comprehensive evaluation, such as range, standard deviation, and IQR range. Figures 11(a) and 11(b) show the CV plots of both the algorithms.
4.3.2.5. Standard Deviation Analysis
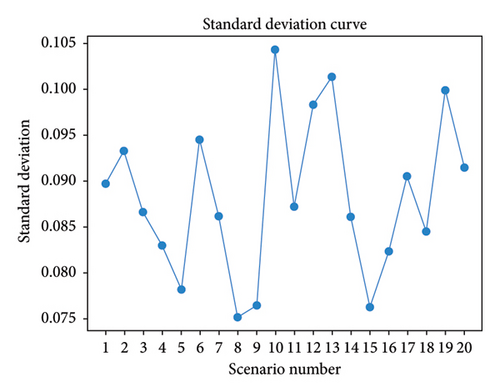
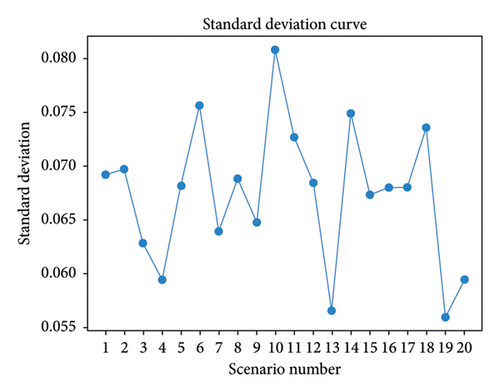
The ACOA was stable and robust in handling variations in the TOD index. In contrast, the PSOA yields more consistent results. A lower standard deviation indicates greater reliability and consistency. By comparing the algorithms’ standard deviations, the best predictor can be chosen for future TOD index values in a city (Figures 12(a) and 12(b)). The ACOA has a lower standard deviation (0.0674) than the PSOA (0.1011), indicating more consistent outcomes. However, the PSOA shows a lower variation in the range. Wider ranges may have lower standard deviations if the values are distributed uniformly. Sensitivity analysis alone cannot determine the best TOD assessment algorithm, and other factors must be evaluated.
4.3.3. K-Fold Cross-Validation
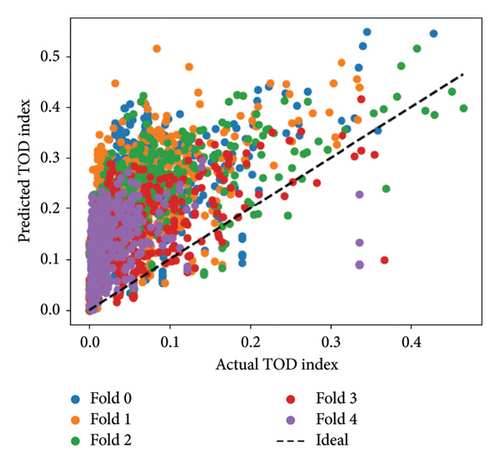
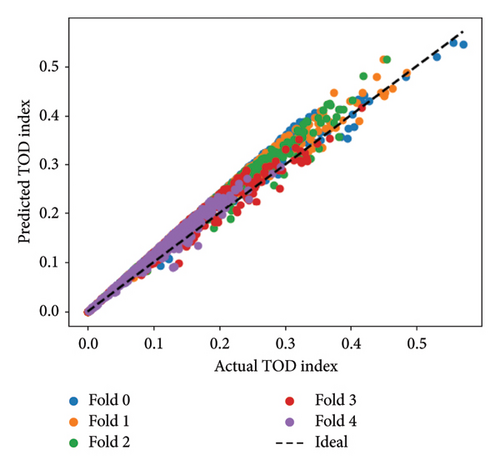
Figures 13(a) and 13(b) show that the ACOA performs worse than PSOA due to significant diagonal deviation. The ACOA excels in discrete solutions, but the PSOA excels in continuous optimization, making it better for the problem. Individual strengths and weaknesses explain performance differences. Tuning hyperparameters may favor PSOA for this problem. For TOD assessment validation, AMSE, RMSE, and AMAE are used to compare predictive and actual values. Lower numbers indicate better performance. Table 3 shows that PSOA predicted TOD index values better than ACOA with lower AMSE (0.0008 vs. 0.0234), RMSE (0.0276 vs. 0.1531), and AMAE (0.0239 vs. 0.1336).
| Parameters | ACOA | PSOA |
|---|---|---|
| AMSE | 0.0234 | 0.0008 |
| RMSE | 0.1531 | 0.0276 |
| AMAE | 0.1336 | 0.0239 |
4.3.4. Validation of ACOA and PSOA Using MRT Lines
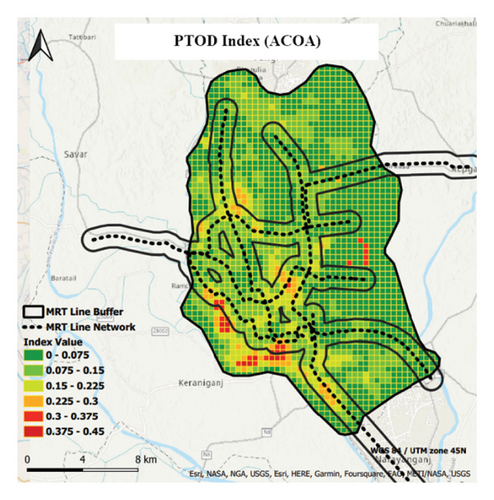
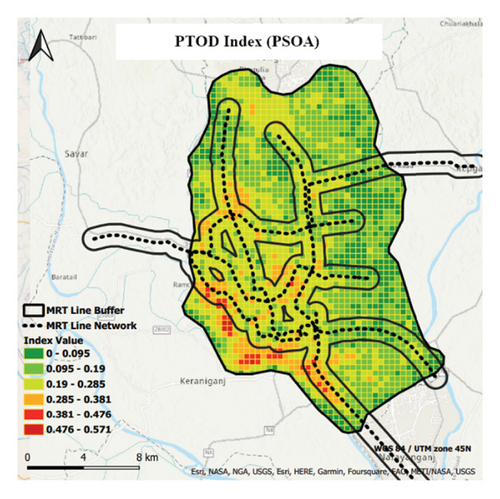
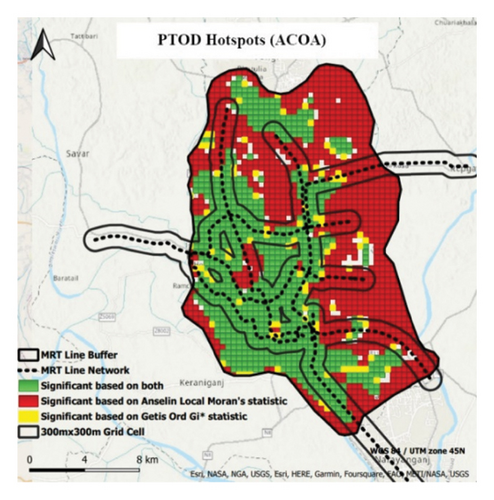
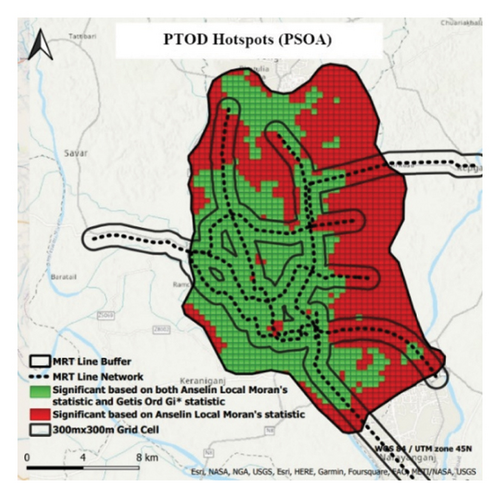
The TOD index maps (Figure 14) display the buffer areas with varying TOD index values for the ACOA and PSOA. ACOA’s buffer covers 0.075 to 0.15, while PSOA’s spans 0.19 to 0.285. Both algorithms identified grid cells with values of 0–0.075 as significant within the buffer, indicating potential development zones. The PSOA’s buffer covers a wider range of TOD index values, suggesting more potential TOD development areas than the ACOA, aligning with the methodology’s approach to validating the algorithms using MRT lines.
The ACOA and PSOA hotspot maps (Figures 15(a) and 15(b)) validated the TOD development around the MRT lines, consistently identifying significant areas. The buffer area near the MRT lines mostly contains high TOD index grid cells, as confirmed by Anselin local Moran’s statistic and Getis–Ord Gi∗ statistic (green). Some cells were significantly based solely on the Anselin local Moran’s statistic, but both hotspot maps exhibited consistent patterns. This supports the significant TOD clustering around MRT lines, shaping the TOD distribution in Dhaka City. The ACOA and PSOA reliably generated TOD index maps and identified potential TOD areas accurately.
5. Discussion
5.1. Optimization With ACOA
The TOD index in Dhaka City varied, indicating different TOD potentials. Grid cells with a TOD index of 0–0.075 (dark green) were distant from the MRT lines, necessitating exploring alternative transportation options. Higher TOD index ranges (light green, yellow, light orange, light red, and dark red) offer greater potential for TOD, warranting priority in infrastructure and services to promote sustainable transportation and enhance residents’ quality of life. Policymakers and planners should focus on developing areas with higher TOD index ranges and consider strategies to improve TOD in regions with lower TOD indices. Spatial analysis reveals a significant clustering of TOD index values, helping policymakers effectively target investments. Hotspot analysis identifies areas needing attention, and spatial autocorrelation highlights factors that drive clustering, such as transit infrastructure and PD. This information enables planners to allocate resources and policies to areas with high TOD potential, fostering sustainable, equitable urban development in Dhaka.
5.2. Optimization With PSOA
The TOD index analysis of Dhaka City has significant implications for TOD and urban planning. The concentration of the TOD index in the 0.095–0.19 range in the northern and eastern regions without MRT lines emphasizes the need for improved transit infrastructure. With existing MRT lines, the 0.19–0.285 range in the western part highlights the transit infrastructure’s positive impact on TOD potential. Areas near MRT lines 2, 4, and 5 offer additional TOD opportunities (0.285–0.38 range), while targeted efforts are needed for the southwestern-most region (0.38–0.476 and 0.476–0.571 ranges) near MRT line 2. Aligning transit expansion with TOD potential is crucial for sustainable urban environments in Dhaka. The PSOA hotspot analysis revealed a clustered TOD index. Understanding these factors will aid planners in promoting sustainable urban development. Focusing on high TOD index areas, clustering optimizes transit infrastructure, land use planning, and development policies. Anselin local Moran’s statistic and Getis–Ord Gi∗ statistic are valuable tools for targeting resources and policies to areas with high TOD potential, allowing tailored strategies based on spatial autocorrelation and clustering patterns.
5.3. Comparison of the Result of ACOA and PSOA in Dhaka City
The comparison of TOD index maps using the ACOA and PSOA for Dhaka City reveals similarities and slight differences. Both algorithms identified concentrated grid cells with TOD index values between 0 and 0.095 in the north and east, indicating limited MRT lines. In contrast, with better MRT availability, the western region showed higher TOD index values, signifying more potential for TOD.
Differences emerge in the higher TOD index ranges. The ACOA-based map has distinct ranges (e.g., 0.15–0.225 and 0.225–0.3) compared to broader ranges in the PSOA-based map (e.g., 0.19–0.285), with slightly more grid cells in the 0.095–0.19 TOD index range.
Both analyses highlight the potential for TOD in the western part of Dhaka. Simultaneously, areas in the north and east with lower TOD index values could benefit from future transit infrastructure development. The choice of algorithms significantly influences the TOD index values and identification of development areas, offering valuable insights for sustainable transportation solutions. Hotspot maps aid planners make targeted investments and infrastructure development decisions for TOD.
5.4. Comparison of the ACOA and PSOA Based on Performance Analysis
The sensitivity analyses of PSOA and ACOA for predicting a city’s TOD index revealed varying opinions. The PSOA is more stable and robust regarding the results’ maximum TOD index and consistency. At the same time, the ACOA excels in TOD index variation and standard deviation. Validation methods (cross-validation, bootstrap, and holdout) support both algorithms, with k-fold cross-validation favoring the PSOA. The PSOA also yielded a higher TOD index within the MRT buffer area than the ACOA. The PSOA is more suitable for determining variable weights in the TOD index calculation because of its higher validity and the suggested TOD level.
The performance of the ACOA and PSOA in Dhaka’s TOD index problem can vary owing to hyperparameter settings. Conducting a hyperparameter search and validation techniques can enhance algorithm selection. Further research should include comparisons with other algorithms, stability analysis, spatial analysis, correlation assessments, and policy intervention exploration.
5.5. Practical Implications of the Optimized TOD Index
The traditional TOD index, while useful, has often been criticized for its static nature, making it less adaptable to dynamic changes in urban environment [86]. This research addresses this gap by introducing optimization techniques such as ACO and PSO to make the TOD index more responsive to real-time data.
5.5.1. Case Studies for Real-World Applications
For instance, urban planners in cities experiencing rapid development could utilize the optimized TOD index to assess new transit projects’ impact in real-time, enabling more agile and effective decision-making. In the context of Dhaka, where this study is focused, the optimized TOD index could be instrumental in planning future transit corridors or reevaluating the efficacy of existing corridors.
5.5.2. Policy Recommendations
Furthermore, the optimized TOD index could be a critical tool for policymakers. It can be used to prioritize funding for areas with significant potential for improvement in TOD, thus maximizing the impact of investment in the public transportation infrastructure.
5.6. Comparative Advantages of Dynamic Optimization in Transit Planning
- •
The Four-Step Model: Travel generation, trip distribution, mode choice, and trip assignment are among the earliest and most widely used models for transit planning. However, they often lack real-time responsiveness [12].
- •
Gravity Model: This model calculates the interaction between two places based on their size and distance. It is often used for predicting travel demand but does not account for real-time changes [88].
- •
Logit Model: Used in mode choice analysis, this model calculates the likelihood of choosing a particular mode based on factors such as cost and time. It does not dynamically adapt to changing conditions [89].
- •
Linear Programming Models: These models focus on optimizing a linear objective function subject to linear equality and inequality constraints. Although robust, they are not designed for dynamic adaptation [12].
On the other hand, dynamic optimization methods like ACO and PSO offer the potential for more responsive and adaptive planning solutions. These methods have been applied in various fields to solve complex optimization problems and have shown promising results in improving system efficiency [13].
5.7. Limitations of Dynamic TOD Index Optimization
- 1.
Qualitative Comparison with Static Models: While the study does not provide empirical comparisons with static models, the dynamic nature of the optimization methods offers theoretical advantages. Traditional static models may not effectively capture the rapidly changing dynamics of urban environments, a limitation that dynamic optimization aims to overcome [90].
- 2.
Link to Travel Outcomes: Although empirical data linking the optimized TOD index to specific travel outcomes are lacking, the existing literature suggests that optimized transit systems can result in positive travel outcomes such as increased ridership and reduced car use [91].
- 3.
Contextualizing within Dhaka’s Public/Planning Process: Dhaka’s urban planning framework could benefit from an optimized TOD index. Given the city’s complex transit challenges, including congestion and low ridership rates, dynamic optimization methods may offer valuable insights for policy formulation [27, 28].
- 4.
Evidence-based decision-making: The optimized TOD index can be a data-driven tool for practitioners and policymakers in Dhaka, enabling more targeted and effective transit planning, even if this study does not provide empirical validations [92].
5.8. Implications and Future Directions of Optimized TOD Index
While this study focuses on Dhaka, the broader application of optimized TOD indices could yield significant improvements in urban transit systems. For instance, the successful implementation of TOD strategies in Portland, USA, led to a 20% increase in transit ridership [93]. The integration of advanced optimization techniques, such as Gradient-Guided Evolutionary Neural Architecture Search, Self-Adaptive PSO, Importance-Based PSO with Deep Learning, and Ensemble DE, presents new opportunities for enhancing TOD assessments. These methods improve feature selection, optimize spatial relationships, and enhance decision-making accuracy, making TOD optimization more adaptable to real-time urban conditions [58, 60, 61].
Although this study does not empirically evaluate ridership changes, future research could apply the optimized TOD index to real-world transit networks and assess its impact on passenger behavior. By leveraging deep learning and evolutionary search algorithms, future studies could develop predictive models that estimate TOD effectiveness based on spatial, demographic, and transport-related factors [15]. Additionally, Adam-optimized neural networks could refine TOD assessments by learning complex relationships between transit infrastructure and urban development, leading to more precise TOD implementation strategies [62].
A key limitation of this study is that while optimization methods improve the responsiveness of the TOD index, they do not directly measure outcomes such as ridership growth or user satisfaction. Future work should incorporate real-world validation, integrating empirical transit data with optimized TOD models to evaluate their effectiveness. Studies using self-adaptive PSO and importance-guided PSO could further enhance real-time adaptability in transit planning models [59].
Despite the lack of empirical data, the theoretical foundation suggests that optimizing the TOD index should contribute to better urban planning outcomes. Enhanced planning, in turn, is expected to result in improved transit metrics, such as higher ridership, reduced congestion, and increased passenger satisfaction [94]. By combining bioinspired and deep learning–based optimization techniques, future research can ensure that TOD planning remains data-driven, adaptive, and capable of addressing complex urban mobility challenges.
6. Conclusion
In conclusion, this study on TOD in Dhaka City using optimization algorithms provides valuable insights for urban planning and policy-making. The PSOA demonstrated superior performance, offering more precise TOD potential assessments near the existing MRT lines. Future analyses should consider hyperparameter settings and incorporate real-world data on PD and land use to enhance the accuracy. Policymakers and planners can prioritize investments in transit infrastructure and implement TOD-friendly policies to promote sustainable urban development and improve residents’ quality of life. Similar studies in other cities can tailor TOD strategies to their unique contexts to ensure efficient and equitable urban growth.
Conflicts of Interest
The authors declare no conflicts of interest.
Author Contributions
The authors confirm their contribution to the paper as follows: study conception and design: Md. Anwar Uddin; data collection: Md. Anwar Uddin; analysis and interpretation of results: Sumit Roy and Tahsin Tamanna; draft manuscript preparation: Sumit Roy and Rubayet Arafin Rimon. All authors have reviewed the results and approved the final version of the manuscript.
Funding
This research received no specific grant from any funding agency in the public, commercial, or not-for-profit sectors.
Acknowledgments
The authors express their gratitude to the Department of Civil Engineering, Military Institute of Science and Technology (MIST), Dhaka, Bangladesh.
Open Research
Data Availability Statement
Some or all data, models, or codes that support the findings of this study are available from the corresponding author upon reasonable request.


