Applying a Hybrid Gray Wolf-Enhanced Whale Optimization Algorithm to the Capacitated Vehicle Routing Problem
Abstract
The study presents a novel hybrid gray wolf and whale optimization algorithm (hGWOAM) for the capacitated vehicle routing problem (CVRP). By integrating the enhanced whale optimization algorithm (EWOA) and gray wolf optimizer (GWO) with tournament selection, opposition-based learning, and mutation techniques, hGWOAM enhances routing efficiency under capacity constraints. Computational evaluations demonstrate its superior performance, achieving lower percentage deviations (%dev) compared to existing algorithms across multiple case studies and real-world applications. In Case Study 1, hGWOAM achieved a mean percentage deviation (%dev) lower than EWOA (0.89%), GWO (0.74%), SCA (0.59%), DA (1.63%), ALO (2.26%), MHPSO (1.85%), PSO (1.96%), DPGA (2.85%), and SGA (4.14%). In Case Study 2, hGWOAM outperformed EWOA (12.05%), GWO (2.53%), ALO (21.07%), and DA (17.58%). In a real-world application, it achieved the best %dev, surpassing EWOA (6.64%), GWO (6.34%), ALO (9.01%), and DA (12.24%). These findings highlight hGWOAM’s potential for optimizing logistics, reducing operational costs, and minimizing environmental impact while also paving the way for future advancements in metaheuristic optimization.
1. Introduction
In recent years, metaheuristic algorithms have emerged as powerful tools for solving complex optimization problems, particularly in technical and engineering domains. Many of these algorithms are inspired by animal behaviors and natural phenomena, offering innovative solutions to challenging problems. For example, Pham and Nguyen Dang [1] explored the Portia spider algorithm, a novel swarm-based technique derived from the sophisticated problem-solving behaviors of Portia spiders. Similarly, the effectiveness of the recently proposed graylag goose optimization algorithm was demonstrated by El-Kenawy and Khodadadi [2] in solving various optimization tasks. Zhao et al. [3] introduced the sea-horse optimizer, drawing inspiration from sea horses’ movements, predation strategies, and breeding behaviors, thereby highlighting its potential as an effective swarm intelligence-based metaheuristic.
The application of metaheuristic algorithms to complex problems has increasingly attracted significant research attention [4–7]. For example, two particle swarm optimization (PSO)-based algorithms explicitly tailored for unmanned aerial vehicle (UAV) networks were introduced by Arafat and Moh [8]. The first, known as the 3-D SIL algorithm, enhanced localization accuracy and reduced convergence time. The second algorithm, the energy-efficient SIC algorithm, optimized intercluster and intracluster distances, residual energy, and geographic positioning, thereby significantly improving network performance. In subsequent research, Arafat and Moh [9] proposed bio-inspired inclusion (BIL) and bio-inspired clustering (BIC) localization schemes designed for forest fire detection and monitoring, both inspired by the hybrid gray wolf optimizer (HGWO). Additionally, a joint routing and charging strategy (JRCS) was developed in recent studies [10] to extend drone flight times by incorporating charging stations, effectively optimizing routes through clustering, segmentation, and mixed-integer linear programming (MILP). Furthermore, Lu et al. [10] analyzed urban low-carbon passenger transportation using the VPOSR model, employing game theory and CRITIC-entropy methods for indicator weighting, and applying the technique for order preference by similarity to ideal solution (TOPSIS) method to evaluate data collected from Tianjin between 2017 and 2021.
Beyond nature-inspired algorithms, several metaheuristic methods have emerged based on mathematical and physical concepts [11–14], facilitating a balanced approach between exploitation and exploration to efficiently address practical optimization problems. Hybrid algorithms have also received substantial attention for their ability to enhance the capabilities of traditional metaheuristics, with promising results reported across numerous engineering benchmarks and real-world applications [15–17]. Among various optimization challenges, the vehicle routing problem (VRP) is widely recognized as a particularly complex issue in logistics and transportation management, drawing extensive research interest. It encompasses multiple variants, including capacity constraints [18–22], time windows [23, 24], cost minimization [25], and management of delivery and pickup operations [26–28] for both homogeneous and heterogeneous fleets [29, 30]. A diverse range of approaches has been proposed to tackle these variants, such as MILP [31], dynamic programming [32], genetic algorithms (GA) [18, 25, 33], ant colony systems (ACS) [34], hybrid sine cosine algorithms (HSCA) [21, 35], hybrid particle swarm optimization (HPSO) [36], and the modified salp swarm algorithm (mSSA) [37].
Despite these advances, the existing research predominantly focuses on static VRP scenarios involving predetermined constraints [37–41], lacking adaptability to the dynamic and unpredictable nature of contemporary logistics environments. Furthermore, current algorithms frequently target specific VRP variants effectively [42–44] but struggle to seamlessly integrate multiple constraints, particularly when sustainability and fuel efficiency considerations are involved [45]. The evolving demands of global supply chains emphasize the urgent need for robust and flexible optimization algorithms capable of solving the CVRP under diverse scenarios while ensuring global optimization. Consequently, the development of advanced algorithms capable of addressing multiobjective and dynamic VRP challenges remains a critical area for future research. To address these challenges, this study introduces the hybrid gray wolf and enhanced whale optimization algorithm (hGWOAM), integrating the strengths of the enhanced whale optimization algorithm (EWOA) [46] and the gray wolf optimizer (GWO) [47], enhanced by the tournament selection (TS) strategy [48], opposition-based learning (OBL) [48], and mutation techniques [49]. Although both whale optimization algorithm (WOA) and GWO have demonstrated success in various optimization contexts, their direct application to CVRP has revealed limitations, particularly regarding balancing exploration–exploitation dynamics and effectively managing the complex constraints typical in logistics operations.
By combining the distinctive features of these algorithms, hGWOAM aims to overcome such limitations, promoting a more adaptive, efficient, and sustainable logistics management framework. Specifically, global exploration and local exploitation are effectively balanced, improving both solution quality and convergence speed. The incorporation of OBL expands the search space by evaluating opposite solutions, while mutation strategies introduce controlled randomness to preserve population diversity and prevent premature convergence. Furthermore, the TS strategy increases selection pressure, ensuring the propagation of high-quality solutions across generations. Given the increasing complexity and environmental considerations in global supply chains, the development of advanced optimization tools capable of navigating modern logistics systems is essential. By integrating EWOA and GWO within the hGWOAM framework, this study presents a novel and effective solution to CVRP, overcoming the shortcomings of existing algorithms and addressing the dual challenges of sustainability and operational efficiency.
The proposed hGWOAM undergoes rigorous evaluation through computational experiments and real-world case studies, including scenarios with various capacity constraints. Its performance is compared to state-of-the-art algorithms, demonstrating superior accuracy, convergence speed, and robustness in solving complex, multiobjective optimization problems. This research advances the field of metaheuristic optimization and offers valuable insights for improving logistics and supply chain management. The findings pave the way for further developments in multiobjective and dynamic VRP optimization, highlighting hGWOAM’s potential impact in both academic and industrial contexts. In the following sections, the nature and mathematical formulation of CVRP are presented in detail. Section 3 discusses computational experiments and results. Section 4 summarizes key findings, while Section 5 concludes with a discussion of the limitations and future research directions.
2. Model Development
2.1. Overview of CVRP
Operations research and logistics extensively recognize the importance of the CVRP [50], which involves efficiently distributing goods from a centralized warehouse to a defined set of clients while ensuring that vehicles return to their starting point. A formal description of this problem, as provided by Pham and Nguyen [21], includes several critical assumptions and constraints (Eq. (0)–Eq. (3)), which are detailed in Table 1.
| Mathematical formulation | No. | Description variable | Formula meaning |
|---|---|---|---|
| (0) | L: total distance dij represents the distance between locations i and j | Objective function | |
| (1) | zijt is a binary variable indicating whether the route from i to j used by vehicle t | Visit consistency: Each customer i, j is visited exactly once by exactly one vehicle | |
| (2) |
|
Capacity constraints: The total goods transported by each vehicle t does not exceed its capacity | |
| (3) |
|
Vehicle assignment: Each vehicle starts and ends its route at the warehouse, and exactly h vehicles are used |
2.1.1. Assumptions
- •
Stable Demand: The demand at each client’s location is constant and predictable, facilitating accurate routing and scheduling.
- •
Fixed Vehicle Capacity: Vehicles have a specified maximum capacity that must not be surpassed to prevent overloading and promote efficient and safe transportation.
- •
Single Service Visit: Each client receives a single visit from the fleet, maximizing efficiency in both time and resource use.
2.1.2. Constraints
- •
Capacity Limits: No vehicle route can transport a load exceeding the vehicle’s maximum capacity.
- •
Exclusive Customer Delivery: Each customer receives delivery only once, ensuring precise and organized distribution.
2.1.3. Objective
- •
The primary goal is to reduce the total travel distance across all vehicles while adhering to the delivery requirements.
2.2. Algorithm Development for CVRP
2.2.1. EWOA
- •
Encircling Prey Strategy: Simulated whales encircle prey, narrowing the search area and guiding candidate solutions toward optimal regions (Eq. (4) to Eq. (7)).
- •
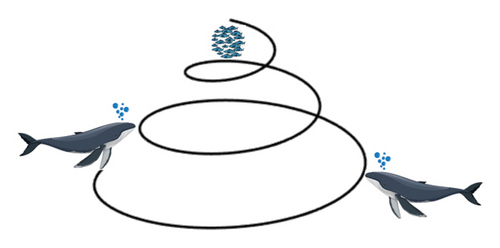
Spiral Bubble-Net Attacking Strategy: This combines encircling with spiral movements to tighten the bubble net, enhancing exploitation near the best solution (Eq. (8) to Eq. (10)).
- •
Search for Prey Strategy: Whales randomly explore the search space, increasing solution diversity and preventing premature convergence (Eq. (11) to Eq. (12)).
- •
Pooling Mechanism: At each iteration, a Pool matrix is created at 1.5 times the size of the position matrix, enhancing diversity through crossover. For example, with 100 whales, the Pool matrix contains 150 whales. Each position in the Pool is determined by blending the best and the worst positions using binary vectors and (Eq. (13)).
- •
Migrating Search Strategy: This strategy randomly moves 20% of the whale population to unexplored regions to enhance exploration (Eq. (14)). It uses random positions and positions near the best solution , increasing population diversity.
- •
Preferential Selecting: This approach updates positions using Eq. (15), influenced by dynamic coefficients and with and randomly chosen from the Pool to promote exploration.
- •
Enriched Encircling Prey Strategy: This strategy improves exploitation and convergence by adjusting positions with Eq. (16) to Eq. (18). It modifies the distance Dt to the best solution, incorporating a random Pool element to prevent stagnation.
| Mathematical formulation | No. | Description variable |
|---|---|---|
| (4) | : distance vector between the prey and the whale | |
| (5) | : position vector of the current search agent. t current iteration | |
| (6) | : position vector of the best solution found so far | |
| (7) | : coefficient vector, updated to reduce the difference between the best solution and current positions | |
| (8) | : coefficient vector that helps in the exploration and exploitation process | |
| (9) | : linearly decreases from 2 to 0 during iterations, used in calculating | |
| (10) |
|
|
| (11) |
|
|
| (12) | : position of each whale in the Pool matrix, determined based on the best and worst positions | |
| (13) | : binary vector used in the pooling mechanism | |
| (14) | : inverse binary vector of | |
| (15) | : position of the best random whale in the Pool matrix | |
| (16) | : position of the worst whale in the Pool matrix | |
| (17) | ; are andomly chosen positions from the Pool matrix | |
| (18) |
|
These enhancements enable the EWOA to balance exploration and exploitation, increasing its effectiveness in solving complex optimization problems and enhancing the likelihood of finding global optima.
2.2.2. GWO
- •
Encircling Period: Wolves surround their prey by adjusting their positions based on the prey’s location and specific coefficient vectors, guiding them to encircle the target and limit its escape (Eq. (19) to Eq. (22) in Table 3).
- •
Hunting Phase: Alpha, beta, and delta wolves lead the pack toward the prey using their experience to estimate its location, influencing the movement of other wolves (Eq. (23) to Eq. (25) in Table 3).
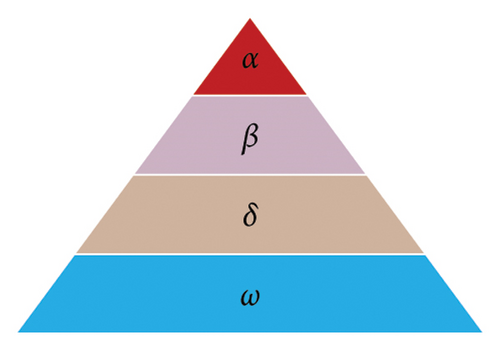
During the encircling and hunting phase, a random vector is generated within [−2a, 2a]. If , wolves attack a randomly chosen prey, initiating the “mining stage”. If , they abandon their current target to explore better options.
| Mathematical formulation | No. | Description variable |
|---|---|---|
| (19) |
|
|
| (20) | : randomly generated vector within [−2a, 2a] determining whether wolves attack or search for new prey | |
| (21) | : coefficient vector affecting wolf movement, taking values within [0, 2] | |
| (22) | r1, r2 are random vectors | |
| (23) |
|
|
| (24) | ; ; are updated position based on alpha, beta, delta wolf’s influence. | |
| (25) | : average position of wolves for next iteration |
2.2.3. TS, OBL, and Mutation TS
TS is a popular method used in various optimization algorithms, including GA [52], and ant lion optimizer (ALO) [53]. This method is preferred due to its simplicity and efficiency. In TS, k individuals are randomly selected from the population to compete against each other. The individual with the highest fitness among them is chosen and added to the next generation. The tournament size k, which is the number of individuals participating in each tournament, is a critical parameter. However, increasing the tournament size is known to lead to a higher expected loss of diversity [54]. In this study, a tournament size of k = 3 is chosen.
Figure 3 illustrates the TS process, which preserves diversity and controls the convergence rate by giving all individuals equal selection opportunities. TS offers fast execution, especially in parallel implementations, and reduces the risk of domination by a few individuals. It also eliminates the need for fitness scaling or sorting, increasing efficiency. In hGWOAM, TS selects the best solution from k candidates in the solution Pool. Using Eq. (26) and Eq. (27) in Table 4, the fitness of all solutions is then evolved based on parameters from the top-performing solution. This process promotes exploration and maintains population diversity.

| Mathematical formulation | No. | Description variable |
|---|---|---|
| Tournament selection: | ||
| (26) | : the uth parameter of solution i; | |
| : the uth parameter of the solution chosen through TS process; | ||
| CTS: the TS process condition | ||
| Subject to: | ||
| CTs = 0.1 × (1 − icurent/Imax) | (27) | r5: a randomly generated value within [0, 1] |
| Opposition-based learning: | ||
| x∗ = bupper + blower − x | (28) | blower: the lower boundary defining the range of x |
| bupper: the upper boundary defining the range of x | ||
| Mutation: | ||
| (29) | pc = 0.1 | |
| is a mutation vector | ||
2.2.3.1. OBL
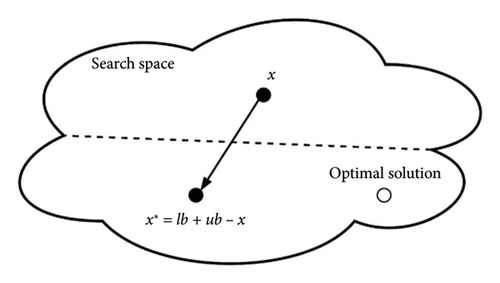
OBL is illustrated in Figure 4, where the opposite point x∗ is determined by reflecting each coordinate of the initial point x across the midpoint between its lower and upper bounds. During the optimization process, both the original point x and its corresponding opposite point x∗ are evaluated using the fitness function. The superior solution is then retained, while the less optimal one is discarded, as detailed in Eq. (28) in Table 4.
2.2.3.2. Mutation
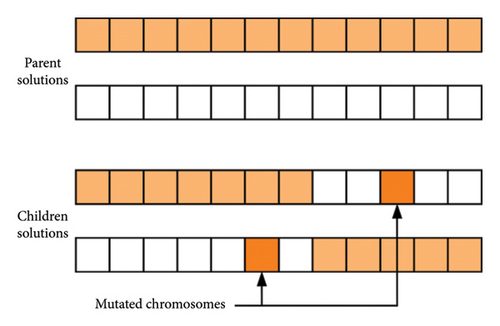
Mutation plays a crucial role in introducing small random variations into offspring, thereby promoting population diversity and preventing premature convergence to local optima. During the mutation process, a mutation vector is generated by selecting random components from the directional elements of the original vector , as shown in Eq. (29) in Table 4. The values within the relevant domain of these directions are subsequently redistributed, as illustrated in Figure 5. The probability factor pc is employed to maintain population diversity and mitigate the risk of premature convergence to local optima.
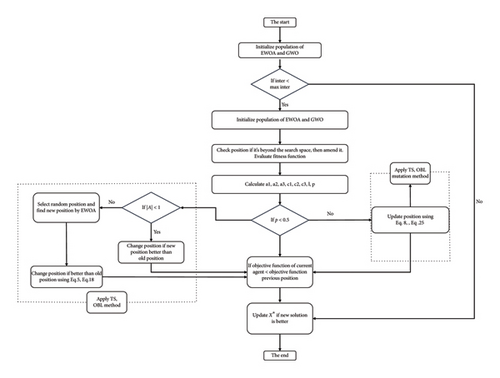
2.2.4. Algorithm Development
The CVRP is a discrete optimization challenge focused on optimizing customer visit sequences. The hGWOAM addresses this by integrating the GWO and the EWOA, utilizing strategies tailored for discrete problems.
- •
Integration of GWO and EWOA: This combines the social hierarchy of gray wolves and the encircling behavior of humpback whales, enhancing exploration and exploitation of the search space for customer visit sequences.
- •
TS: This selects the best solutions through competitive comparison, increasing robustness.
- •
OBL: It considers both solutions and their opposites to accelerate convergence and explore unvisited areas.
- •
Mutation Techniques: Its custom mutations maintain genetic diversity, preventing premature convergence.
- •
Initialization: A population of feasible solutions is generated representing sequences of customer visits per vehicle, evaluated by total distance and capacity constraints.
- •
Leader Selection: TS is used to identify effective solutions as leaders, guiding the search process.
- •
Convergence and Adaptation: OBL refines search directions by exploring both current and opposite solutions.
- •
Iteration and Refinement: GWO and EWOA behaviors with mutation are combined to explore new routes. The process continues until a stopping criterion (e.g., maximum iterations or solution stability) is reached.
- •
Implementation Details: Each iteration involves evaluating fitness, updating leaders through TS, enhancing search efficiency with OBL, and maintaining diversity with mutations. The algorithm dynamically adapts its strategy based on the current solution performance.
- •
Termination: The procedure ends when stopping criteria are met, yielding an optimal or near-optimal sequence of customer visits that minimizes total travel distance while satisfying constraints.
Figure 6 illustrates the schematic of the proposed hGWOAM method. The next section will apply this algorithm to solve the CVRP.
3. Computational Experiments
For the traveling salesman problem, the computational complexity grows exponentially with an increase in the number of cities. To clarify, a TSP involving n cities requires consideration of 1/2∗(n − 1)! possible routes. The delivery problem is very complex, with n = 40 which can have 4.07∗1047 solutions. Such a large number of route permutations make the TSP particularly demanding in terms of computation. When examining the VRP, which fundamentally consists of multiple interconnected TSPs, the computational complexity increases significantly.
Table 5 presents the key parameter settings used for the CVRP model, including the population size, number of runs, maximum iterations, and algorithm execution time. Population size refers to the number of candidate solutions generated in each iteration, while the number of runs ensures the reliability and consistency of results through multiple independent executions. The maximum number of iterations restricts the algorithm’s search duration for an optimal solution, and execution time measures the total computational duration required to obtain the final solution.
| No. | hGWOAM | EWOA | GWO | ALO | DA | |
|---|---|---|---|---|---|---|
| Population size | Case Study 1 | 20 | 20 | 20 | 20 | 20 |
| Number of trials | 20 | 20 | 20 | 20 | 20 | |
| Maximum number of iterations | 50 | 50 | 50 | 50 | 50 | |
| Algorithm running time (s) | 23.38 | 19.58 | 20.80 | 133.34 | 64.64 | |
| Population size | Case Study 2 | 100 | 100 | 100 | 100 | 100 |
| Number of trials | 20 | 20 | 20 | 20 | 20 | |
| Maximum number of iterations | 200 | 200 | 200 | 200 | 200 | |
| Algorithm running time (s) | 393.88 | 318.10 | 369.52 | 1772.28 | 613.92 | |
| Population size | Case Study 3 | 500 | 500 | 500 | 500 | 500 |
| Number of trials | 20 | 20 | 20 | 20 | 20 | |
| Maximum number of iterations | 500 | 500 | 500 | 500 | 500 | |
| Algorithm running time (s) | 1927.99 | 1865.80 | 1873.26 | 1738.56 | 1937.99 | |
- Note: The model runs on a Java platform with a 13th Gen Intel(R) Core(TM) i7-13700 2.10 GHz.
Case Study 1: The hGWOAM algorithm completed its run in 23.38 s, slightly slower than EWOA (19.58 s) and GWO (20.80 s) but significantly faster than ALO (133.34 s) and DA (64.64 s). The relatively small problem size enabled all algorithms to find solutions quickly.
Case Study 2: With an increased population size of 100, 20 independent runs, and a maximum of 200 iterations, hGWOAM completed its execution in 393.88 s. This runtime was longer than those of EWOA (318.10 s) and GWO (369.52 s), but notably shorter compared to ALO (1772.28 s) and DA (613.92 s). Although the EWOA was the fastest algorithm, hGWOAM delivered superior optimization results.
Case Study 3: In the most complex scenario, hGWOAM was executed in 1927.99 s, slightly longer than EWOA (1865.80 s), ALO (1738.56 s), and GWO (1873.26 s), though faster than DA (1937.52 s). Despite not being the fastest algorithm in this scenario, hGWOAM demonstrated competitive performance and achieved superior optimization results.
Overall, hGWOAM consistently demonstrated robust and efficient performance across all scenarios. Its effective balance between computational speed and solution quality makes it a reliable choice for solving CVRP problems. The next section will provide detailed performance analyses and solutions.
3.1. Case Study 1
This case study analyzes a distribution scenario where a central warehouse supplies eight customers using two delivery trucks, each with an 8-unit capacity. Table 6 presents distance data and customer demands. The goal is to optimize truck routes, minimizing total travel distance while adhering to all CVRP constraints.
| Node | 0 | 1 | 2 | 3 | 4 | 5 | 6 | 7 | 8 | Demand |
|---|---|---|---|---|---|---|---|---|---|---|
| 0 | 0 | 4 | 6 | 7.5 | 9 | 20 | 10 | 16 | 8 | |
| 1 | 4 | 0 | 6.5 | 4 | 10 | 5 | 7.5 | 11 | 10 | 1 |
| 2 | 6 | 6.5 | 0 | 7.5 | 10 | 10 | 7.5 | 7.5 | 7.5 | 2 |
| 3 | 7.5 | 4 | 7.5 | 0 | 10 | 5 | 9 | 9 | 15 | 1 |
| 4 | 9 | 10 | 10 | 10 | 0 | 10 | 7.5 | 7.5 | 10 | 2 |
| 5 | 20 | 5 | 10 | 5 | 10 | 0 | 7 | 9 | 7.5 | 1 |
| 6 | 10 | 7.5 | 7.5 | 9 | 7.5 | 7 | 0 | 7 | 10 | 4 |
| 7 | 16 | 11 | 7.5 | 6 | 7.5 | 9 | 7 | 0 | 10 | 2 |
| 8 | 8 | 10 | 7.5 | 15 | 10 | 7.5 | 10 | 10 | 0 | 2 |
In Table 7, the outcomes obtained through the application of various algorithms [21, 55], including EWOA, GWO, SCA, DA, ALO, MHPSO, PSO, DPGA, and SGA, are presented. The hGWOAM demonstrates superior performance by achieving the lowest mean percentage deviation (%dev), indicating a more optimized solution. Specifically, the recorded %dev values for each algorithm are as follows: EWOA (0.89%), GWO (0.74%), SCA (0.59%), DA (1.63%), ALO (2.26%), MHPSO (1.85%), PSO (1.96%), DPGA (2.85%), and SGA (4.14%). These results clearly highlight the effectiveness of hGWOAM in achieving minimal deviation compared to other algorithms.
| Distribution of optimum solutions | Max | Min | Mean | %dev | |||||
|---|---|---|---|---|---|---|---|---|---|
| hGWOAM | 68 | 67.5 | 67.5 | 67.5 | 67.5 | 68 | 67.5 | 67.625 | 0.00 |
| 67.5 | 67.5 | 67.5 | 67.5 | 67.5 | |||||
| 67.5 | 68 | 67.5 | 68 | 68 | |||||
| 68 | 67.5 | 67.5 | 67.5 | 67.5 | |||||
| EWOA | 69 | 67.5 | 68 | 67.5 | 68.5 | 70 | 67.5 | 68.225 | 0.89 |
| 68.5 | 67.5 | 67.5 | 68.5 | 68.5 | |||||
| 68.5 | 68 | 69 | 68 | 69.5 | |||||
| 70 | 67.5 | 67.5 | 68 | 67.5 | |||||
| GWO | 68 | 67.5 | 68 | 67.5 | 68.5 | 69.5 | 67.5 | 68.125 | 0.74 |
| 68.5 | 67.5 | 67.5 | 68.5 | 68.5 | |||||
| 68.5 | 68 | 69 | 68 | 69.5 | |||||
| 69 | 67.5 | 67.5 | 68 | 67.5 | |||||
| SCA [21] | 69 | 68 | 69 | 68 | 68 | 69.5 | 67.5 | 68.025 | 0.59 |
| 68 | 69.5 | 67.5 | 67.5 | 68 | |||||
| 69 | 68 | 67.5 | 67.5 | 67.5 | |||||
| 68 | 67.5 | 68 | 67.5 | 67.5 | |||||
| DA [21] | 71.5 | 67.5 | 71.5 | 68 | 67.5 | 71.5 | 67.5 | 68.725 | 1.63 |
| 69 | 70 | 70.5 | 68 | 69 | |||||
| 70 | 67.5 | 67.5 | 69 | 68 | |||||
| 67.5 | 68 | 68 | 67.5 | 69 | |||||
| ALO [21] | 71.5 | 68 | 71.5 | 68 | 67.5 | 71.5 | 67.5 | 69.150 | 2.26 |
| 69 | 70 | 70.5 | 68 | 69 | |||||
| 70 | 68 | 71 | 69 | 68 | |||||
| 71.5 | 68 | 68 | 67.5 | 69 | |||||
| MHPSO [55] | 69.5 | 67.5 | 69 | 69 | 70 | 70 | 67.5 | 68.875 | 1.85 |
| 69.5 | 70 | 69 | 67.5 | 67.5 | |||||
| 69 | 69.5 | 69 | 70 | 67.5 | |||||
| 70 | 69 | 67.5 | 70 | 67.5 | |||||
| PSO [21] | 67.5 | 70 | 70 | 69 | 69 | 70 | 67.5 | 68.950 | 1.96 |
| 68 | 69 | 70 | 70 | 68.5 | |||||
| 68.5 | 68.5 | 67.5 | 68 | 70 | |||||
| 70 | 67.5 | 69.5 | 69 | 69.5 | |||||
| DPGA [55] | 70 | 69 | 67.5 | 71 | 69 | 72 | 67.5 | 69.550 | 2.85 |
| 70.5 | 72 | 67.5 | 71.5 | 69 | |||||
| 67.5 | 69 | 71 | 70 | 67.5 | |||||
| 70.5 | 69 | 69.5 | 71 | 69 | |||||
| SGA [55] | 69 | 72 | 73.5 | 69 | 70 | 75.5 | 67.5 | 70.425 | 4.14 |
| 71 | 67.5 | 69 | 69 | 75.5 | |||||
| 70 | 69.5 | 69 | 73 | 69 | |||||
| 74 | 70 | 69.5 | 69 | 70 | |||||
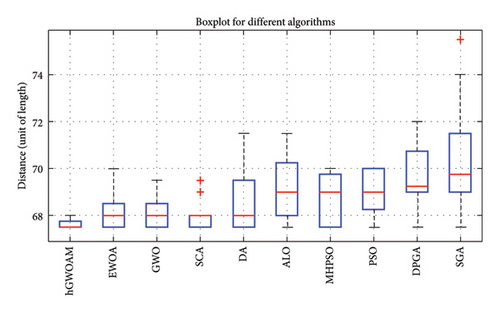
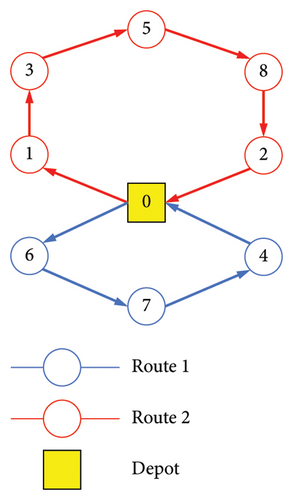
While all algorithms yielded commendable results, hGWOAM demonstrated superior average performance and exhibited greater stability throughout both the exploration and exploitation phases. This conclusion is visually supported by Figure 7, which compares the data distribution of hGWOAM with those of other algorithms, clearly highlighting its advantages. Additionally, Table 8 presents the optimized navigation routes for the two vehicles as determined by hGWOAM, ensuring efficient delivery operations. Figure 8 provides a detailed graphical representation of these routes, offering further insights into the algorithm’s effectiveness in logistical optimization.
| Routes of the vehicles in Case Study 1 | Distance | |
|---|---|---|
| 01 | 0 ⟶ Location 6 ⟶ Location 7 ⟶ Location 4 ⟶ 0 | 33.5 |
| 02 | 0 ⟶ Location 1 ⟶ Location 3 ⟶ Location 5 ⟶ Location 8 ⟶ Location 2 ⟶ 0 | 34 |
- Note: Total distance: 67.5 units.
3.2. Case Study 2
In the second CVRP case study, a central warehouse supplies cement to 18 clients using three delivery trucks, each with a capacity of 500 cement bags. Table 9 provides detailed information regarding the distances between the warehouse and each client, as well as their specific delivery demands. The primary objective of this scenario is to optimize delivery routes by minimizing the total travel distance while strictly adhering to all CVRP constraints, including vehicle capacity and client delivery requirements. This case study further evaluates the effectiveness of advanced optimization algorithms in addressing realistic logistics challenges.
| Node | 0 | 1 | 2 | 3 | 4 | 5 | 6 | 7 | 8 | 9 | 10 | 11 | 12 | 13 | 14 | 15 | 16 | 17 | 18 | Demand |
|---|---|---|---|---|---|---|---|---|---|---|---|---|---|---|---|---|---|---|---|---|
| 0 | 0.0 | 36.1 | 33.5 | 28.3 | 25.0 | 31.6 | 53.9 | 36.1 | 20.6 | 16.8 | 42.7 | 32.7 | 27.6 | 53.0 | 50.0 | 30.4 | 58.9 | 47.6 | 48.3 | 0.0 |
| 1 | 36.1 | 0.0 | 60.2 | 10.0 | 60.2 | 67.1 | 20.0 | 0.0 | 35.0 | 25.3 | 11.2 | 33.0 | 50.0 | 25.1 | 14.1 | 61.8 | 59.9 | 50.5 | 23.4 | 100.0 |
| 2 | 33.5 | 60.2 | 0.0 | 50.2 | 38.1 | 25.0 | 80.2 | 60.2 | 25.5 | 35.0 | 70.0 | 66.2 | 10.8 | 65.3 | 71.6 | 10.0 | 91.8 | 80.7 | 78.6 | 100.0 |
| 3 | 28.3 | 10.0 | 50.2 | 0.0 | 53.2 | 58.3 | 30.0 | 10.0 | 25.0 | 15.5 | 20.6 | 34.5 | 40.0 | 26.2 | 22.4 | 52.2 | 63.2 | 52.8 | 31.8 | 95.0 |
| 4 | 25.0 | 60.2 | 38.1 | 53.2 | 0.0 | 18.0 | 76.3 | 60.2 | 41.2 | 41.2 | 65.2 | 45.5 | 39.3 | 77.9 | 74.3 | 29.2 | 62.6 | 53.0 | 67.8 | 65.0 |
| 5 | 31.6 | 67.1 | 25.0 | 58.3 | 18.0 | 0.0 | 85.4 | 67.1 | 39.1 | 43.6 | 74.3 | 60.1 | 30.7 | 79.9 | 80.6 | 15.0 | 80.1 | 69.9 | 79.4 | 80.0 |
| 6 | 53.9 | 20.0 | 80.2 | 30.0 | 76.3 | 85.4 | 0.0 | 20.0 | 55.0 | 45.2 | 11.2 | 38.6 | 70.0 | 33.3 | 14.1 | 81.4 | 58.2 | 51.7 | 15.1 | 100.0 |
| 7 | 36.1 | 0.0 | 60.2 | 10.0 | 60.2 | 67.1 | 20.0 | 0.0 | 35.0 | 25.3 | 11.2 | 33.0 | 50.0 | 25.1 | 14.1 | 61.8 | 59.9 | 50.5 | 23.4 | 140.0 |
| 8 | 20.6 | 35.0 | 25.5 | 25.0 | 41.2 | 39.1 | 55.0 | 35.0 | 0.0 | 10.8 | 45.3 | 48.1 | 15.0 | 41.4 | 46.1 | 29.2 | 76.6 | 65.3 | 55.1 | 70.0 |
| 9 | 16.8 | 25.3 | 35.0 | 15.5 | 41.2 | 43.6 | 45.2 | 25.3 | 10.8 | 0.0 | 35.0 | 38.3 | 25.2 | 37.0 | 37.7 | 36.7 | 67.2 | 56.0 | 44.4 | 50.0 |
| 10 | 42.7 | 11.2 | 70.0 | 20.6 | 65.2 | 74.3 | 11.2 | 11.2 | 45.3 | 35.0 | 0.0 | 29.7 | 60.1 | 32.3 | 15.0 | 70.7 | 53.2 | 45.1 | 12.8 | 80.0 |
| 11 | 32.7 | 33.0 | 66.2 | 34.5 | 45.5 | 60.1 | 38.6 | 33.0 | 48.1 | 38.3 | 29.7 | 0.0 | 59.4 | 58.0 | 44.1 | 62.6 | 29.2 | 18.4 | 25.5 | 40.0 |
| 12 | 27.6 | 50.0 | 10.8 | 40.0 | 39.3 | 30.7 | 70.0 | 50.0 | 15.0 | 25.2 | 60.1 | 59.4 | 0.0 | 54.6 | 61.0 | 17.2 | 86.5 | 75.2 | 69.4 | 50.0 |
| 13 | 53.0 | 25.1 | 65.3 | 26.2 | 77.9 | 79.9 | 33.3 | 25.1 | 41.4 | 37.0 | 32.3 | 58.0 | 54.6 | 0.0 | 19.2 | 70.5 | 84.7 | 75.5 | 44.7 | 50.0 |
| 14 | 50.0 | 14.1 | 71.6 | 22.4 | 74.3 | 80.6 | 14.1 | 14.1 | 46.1 | 37.7 | 15.0 | 44.1 | 61.0 | 19.2 | 0.0 | 74.3 | 68.2 | 60.1 | 26.2 | 50.0 |
| 15 | 30.4 | 61.8 | 10.0 | 52.2 | 29.2 | 15.0 | 81.4 | 61.8 | 29.2 | 36.7 | 70.7 | 62.6 | 17.2 | 70.5 | 74.3 | 0.0 | 86.5 | 75.6 | 78.0 | 80.0 |
| 16 | 58.9 | 59.9 | 91.8 | 63.2 | 62.6 | 80.1 | 58.2 | 59.9 | 76.6 | 67.2 | 53.2 | 29.2 | 86.5 | 84.7 | 68.2 | 86.5 | 0.0 | 11.3 | 43.1 | 70.0 |
| 17 | 47.6 | 50.5 | 80.7 | 52.8 | 53.0 | 69.9 | 51.7 | 50.5 | 65.3 | 56.0 | 45.1 | 18.4 | 75.2 | 75.5 | 60.1 | 75.6 | 11.3 | 0.0 | 36.7 | 120.0 |
| 18 | 48.3 | 23.4 | 78.6 | 31.8 | 67.8 | 79.4 | 15.1 | 23.4 | 55.1 | 44.4 | 12.8 | 25.5 | 69.4 | 44.7 | 26.2 | 78.0 | 43.1 | 36.7 | 0.0 | 60.0 |
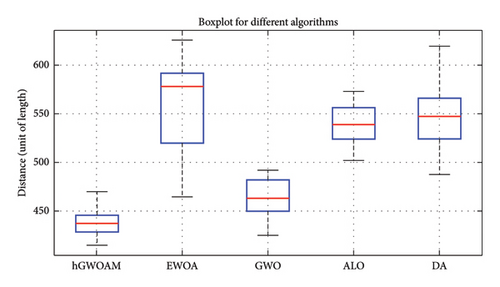
The results from different algorithm implementations are shown in Table 10. The hGWOAM’s percentage deviation from the best solution is notably superior to that of other optimization techniques. Specifically, hGWOAM outperforms EWOA by 12.05%, GWO by 2.53%, ALO by 21.07%, and DA by 17.58%.
| Algorithm | Distribution of optimum solutions | Max | Min | Mean | Deviation ratio of the best solution (%) | ||||
|---|---|---|---|---|---|---|---|---|---|
| hGWOAM | 428.67 | 469.37 | 445.07 | 439.08 | 434.73 | 469.37 | 414.39 | 437.05 | 0.00 |
| 442.62 | 434.73 | 419.84 | 416.92 | 427.55 | |||||
| 439.85 | 421.27 | 448.65 | 452.30 | 414.39 | |||||
| 458.90 | 428.32 | 428.64 | 445.07 | 444.93 | |||||
| EWOA | 565.55 | 591.92 | 621.43 | 611.39 | 581.64 | 625.29 | 464.33 | 560.21 | 12.05 |
| 524.23 | 579.74 | 567.12 | 488.23 | 517.92 | |||||
| 521.61 | 582.48 | 590.90 | 586.08 | 576.32 | |||||
| 464.33 | 625.29 | 504.52 | 617.48 | 486.02 | |||||
| GWO | 485.32 | 453.27 | 429.34 | 433.00 | 472.71 | 491.84 | 424.89 | 462.70 | 2.53 |
| 462.80 | 424.89 | 486.91 | 463.04 | 491.84 | |||||
| 474.98 | 482.11 | 447.29 | 483.01 | 450.36 | |||||
| 453.85 | 457.29 | 480.67 | 446.03 | 475.27 | |||||
| ALO | 555.00 | 572.14 | 556.54 | 528.74 | 523.04 | 572.92 | 501.71 | 537.31 | 21.07 |
| 508.06 | 522.82 | 559.66 | 545.10 | 558.72 | |||||
| 501.71 | 547.63 | 540.86 | 537.38 | 572.92 | |||||
| 504.90 | 543.38 | 504.53 | 530.70 | 532.45 | |||||
| DA | 547.47 | 557.73 | 546.61 | 521.79 | 512.50 | 619.23 | 487.26 | 547.81 | 17.58 |
| 525.57 | 551.76 | 522.92 | 578.71 | 578.71 | |||||
| 574.23 | 619.23 | 541.45 | 556.40 | 551.08 | |||||
| 529.87 | 537.71 | 600.11 | 515.10 | 487.26 | |||||
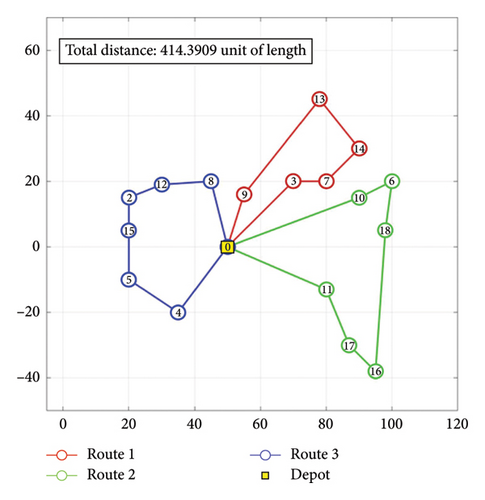
As shown in Figure 9, the data distribution obtained by the hGWOAM is compared with those of other algorithms, clearly revealing its superior performance. This figure illustrates how hGWOAM consistently outperforms competing algorithms across multiple trials. The results further highlight the effectiveness of hGWOAM in achieving an optimal solution, with a total travel distance of 414.39 units.
In Table 11, the delivery routes for the three trucks determined by hGWOAM are presented in detail. This table provides a comprehensive breakdown of the routes assigned to each truck, ensuring efficient delivery operations while strictly adhering to capacity constraints.
| Routes of the vehicles in Case Study 2 | Distance | |
|---|---|---|
| 01 | 0 ⟶ Location 9 ⟶ Location ⟶ Location 13 ⟶ Location 14 ⟶ Location 7 ⟶ Location 3 | 125.41 |
| 02 | 0 ⟶ Location 11 ⟶ Location 17 ⟶ Location 16 ⟶ Location 18 ⟶ Location 6 ⟶ Location 10 | 174.53 |
| 03 | 0 ⟶ Location 8 ⟶ Location 12 ⟶ Location 2 ⟶ Location 15 ⟶ Location 5 ⟶ Location 4 | 114.45 |
- Note: Total distance: 414.39 units.
Figure 10 provides a graphical representation of these delivery routes. The practical application of the hGWOAM in optimizing the delivery process and minimizing travel distances is demonstrated visually by depicting the routes taken by each truck. Overall, these results underscore the robustness of the hGWOAM in addressing complex logistical challenges, such as the CVRP.
3.3. Case Study 3
The third CVRP case study introduces increased complexity by expanding the problem to 200 customers, representing a realistic logistical challenge in cement distribution. In this scenario, a central warehouse supplies cement to these locations using 37 trucks, each with a capacity of 700 bags. The objective is to minimize the total delivery distance while ensuring that capacity constraints and timely deliveries are satisfied.
This scenario closely mirrors real-world logistics challenges, where efficient route planning contributes to cost savings, improved service levels, and enhanced operational efficiency. The increased number of customers and delivery vehicles highlights the necessity for advanced optimization algorithms such as hGWOAM to effectively handle complex logistical scenarios. Tables 12 provide detailed distance and delivery data relevant to this case study.
| Location | Longitude | Latitude | Demand | Location | Longitude | Latitude | Demand |
|---|---|---|---|---|---|---|---|
| Deport | 107.0242788 | 10.6072385 | 51 | 107.1637245 | 10.4986051 | 80 | |
| 1 | 107.0837984 | 10.3451602 | 100 | 52 | 107.2048204 | 10.5213112 | 90 |
| 2 | 107.0904903 | 10.3609904 | 50 | 53 | 107.208381 | 10.5709611 | 100 |
| 3 | 107.0890006 | 10.3733413 | 80 | 54 | 107.2293859 | 10.5880569 | 100 |
| 4 | 107.0924625 | 10.3627624 | 90 | 55 | 107.2113585 | 10.592591 | 50 |
| 5 | 107.1021562 | 10.3754122 | 100 | 56 | 107.3080995 | 10.5853336 | 50 |
| 6 | 107.1031228 | 10.3761541 | 110 | 57 | 107.2205906 | 10.5753757 | 60 |
| 7 | 107.0913193 | 10.3617377 | 200 | 58 | 107.2034027 | 10.602037 | 60 |
| 8 | 107.1076677 | 10.378978 | 100 | 59 | 107.209525 | 10.5912688 | 80 |
| 9 | 107.089926 | 10.3598197 | 80 | 60 | 107.3120569 | 10.5829239 | 90 |
| 10 | 107.08311 | 10.3560193 | 90 | 61 | 107.2252112 | 10.643967 | 100 |
| 11 | 107.0396139 | 10.653406 | 100 | 62 | 107.2081765 | 10.5919773 | 70 |
| 12 | 107.1970048 | 10.5000715 | 80 | 63 | 107.1008667 | 10.3740802 | 80 |
| 13 | 107.0454262 | 10.6574723 | 60 | 64 | 107.1143352 | 10.3836713 | 100 |
| 14 | 107.1524361 | 10.5049466 | 70 | 65 | 107.126075 | 10.3901564 | 120 |
| 15 | 107.2710915 | 10.4903057 | 90 | 66 | 107.0871781 | 10.3561336 | 120 |
| 16 | 107.2205906 | 10.5753757 | 100 | 67 | 107.1539828 | 10.4214295 | 130 |
| 17 | 107.1691781 | 10.4940003 | 100 | 68 | 107.1466794 | 10.4103401 | 140 |
| 18 | 107.1679409 | 10.5209525 | 120 | 69 | 107.1240686 | 10.3892222 | 150 |
| 19 | 107.1710108 | 10.4992729 | 130 | 70 | 107.103371 | 10.3801157 | 180 |
| 20 | 107.1889633 | 10.4901892 | 100 | 71 | 107.139878 | 10.4089466 | 190 |
| 21 | 107.2095274 | 10.4082787 | 200 | 72 | 107.1673059 | 10.4170584 | 140 |
| 22 | 107.073832 | 10.4696444 | 180 | 73 | 107.1363939 | 10.3979967 | 150 |
| 23 | 107.2195898 | 10.4112071 | 90 | 74 | 107.1454289 | 10.3966029 | 120 |
| 24 | 107.2340333 | 10.3946979 | 100 | 75 | 107.0544285 | 10.6015609 | 110 |
| 25 | 107.2897264 | 10.4379579 | 120 | 76 | 107.0539763 | 10.5825626 | 90 |
| 26 | 107.2289028 | 10.4257346 | 150 | 77 | 107.0561958 | 10.5734413 | 130 |
| 27 | 107.0933073 | 10.6067698 | 150 | 78 | 107.0732812 | 10.539833 | 140 |
| 28 | 107.2376394 | 10.3975834 | 160 | 79 | 107.0860874 | 10.5172811 | 160 |
| 29 | 107.1976773 | 10.4857485 | 180 | 80 | 107.1693349 | 10.4757113 | 180 |
| 30 | 107.2230215 | 10.4159073 | 170 | 81 | 107.1512173 | 10.5008324 | 200 |
| 31 | 107.2765195 | 10.4990328 | 90 | 82 | 107.0760384 | 10.5339968 | 150 |
| 32 | 107.2425555 | 10.5379508 | 100 | 83 | 107.0908985 | 10.5210308 | 170 |
| 33 | 107.2710915 | 10.4903057 | 120 | 84 | 107.0707401 | 10.5889924 | 190 |
| 34 | 107.2712451 | 10.4902598 | 130 | 85 | 107.0561477 | 10.588926 | 210 |
| 35 | 107.2626432 | 10.4878332 | 70 | 86 | 107.0673998 | 10.5877707 | 200 |
| 36 | 107.2831723 | 10.4962767 | 50 | 87 | 107.0680263 | 10.5967365 | 160 |
| 37 | 107.2708947 | 10.4899472 | 80 | 88 | 107.055012 | 10.5971994 | 140 |
| 38 | 107.2653139 | 10.4880226 | 100 | 89 | 107.1889805 | 10.5097044 | 130 |
| 39 | 107.2617453 | 10.4889771 | 120 | 90 | 107.1968505 | 10.5280828 | 150 |
| 40 | 107.2665416 | 10.5410849 | 130 | 91 | 107.2454316 | 10.6987053 | 200 |
| 41 | 107.2301894 | 10.4684375 | 160 | 92 | 107.2478515 | 10.6777852 | 100 |
| 42 | 107.2315898 | 10.5288541 | 190 | 93 | 107.2483769 | 10.6726445 | 100 |
| 43 | 107.2901925 | 10.4988428 | 200 | 94 | 107.244858 | 10.6413062 | 100 |
| 44 | 107.1709489 | 10.495647 | 210 | 95 | 107.2632892 | 10.6497864 | 50 |
| 45 | 107.2312619 | 10.5284822 | 180 | 96 | 107.245854 | 10.6479095 | 80 |
| 46 | 107.2454199 | 10.4616401 | 170 | 97 | 107.3160785 | 10.64359 | 90 |
| 47 | 107.2897264 | 10.4379579 | 160 | 98 | 107.2426032 | 10.6354967 | 100 |
| 48 | 107.1789434 | 10.4968487 | 150 | 99 | 107.2451825 | 10.644182 | 110 |
| 49 | 107.1827772 | 10.4921791 | 120 | 100 | 107.2483382 | 10.6607925 | 200 |
| 50 | 107.1933209 | 10.4858346 | |||||
| 101 | 107.232978 | 10.64943 | 100 | 151 | 107.2945458 | 10.4267901 | 160 |
| 102 | 107.2403911 | 10.7038262 | 80 | 152 | 107.2930629 | 10.4295222 | 180 |
| 103 | 107.2419072 | 10.711214 | 90 | 153 | 107.3290068 | 10.4558186 | 170 |
| 104 | 107.2394116 | 10.7241377 | 100 | 154 | 107.285747 | 10.4441869 | 100 |
| 105 | 107.1546267 | 10.5797859 | 80 | 155 | 107.3116764 | 10.4894856 | 120 |
| 106 | 107.147047 | 10.5884566 | 60 | 156 | 107.2971875 | 10.5008125 | 120 |
| 107 | 107.1330498 | 10.590313 | 70 | 157 | 107.2144027 | 10.5402928 | 130 |
| 108 | 107.1250047 | 10.3780398 | 90 | 158 | 107.3832565 | 10.5583102 | 140 |
| 109 | 107.1911687 | 10.4079234 | 100 | 159 | 107.4316703 | 10.558723 | 150 |
| 110 | 107.1210467 | 10.4011201 | 100 | 160 | 107.3917763 | 10.5480988 | 180 |
| 111 | 107.0928753 | 10.4645698 | 120 | 161 | 107.3895491 | 10.5312328 | 190 |
| 112 | 107.0764286 | 10.4612866 | 130 | 162 | 107.2778042 | 10.4613389 | 140 |
| 113 | 107.2184636 | 10.4153714 | 100 | 163 | 107.0904814 | 10.5159272 | 150 |
| 114 | 107.2116025 | 10.4140367 | 200 | 164 | 107.090069 | 10.5209418 | 120 |
| 115 | 107.1250945 | 10.40374 | 180 | 165 | 107.0780857 | 10.5327865 | 110 |
| 116 | 107.3954402 | 10.5340722 | 90 | 166 | 107.1441511 | 10.4032053 | 90 |
| 117 | 107.4224733 | 10.5430976 | 100 | 167 | 107.1707011 | 10.5320209 | 130 |
| 118 | 107.5463775 | 10.5569513 | 120 | 168 | 107.1833661 | 10.6771288 | 140 |
| 119 | 107.423355 | 10.5655446 | 150 | 169 | 107.3983709 | 10.5261142 | 160 |
| 120 | 107.5527777 | 10.5793247 | 150 | 170 | 107.322347 | 10.4527448 | 180 |
| 121 | 107.5587113 | 10.5828861 | 160 | 171 | 107.2955838 | 10.4448747 | 200 |
| 122 | 107.3818004 | 10.6569732 | 180 | 172 | 107.3472876 | 10.5142798 | 150 |
| 123 | 107.3878668 | 10.6825681 | 170 | 173 | 107.4298217 | 10.4785718 | 170 |
| 124 | 107.5011562 | 10.6895802 | 100 | 174 | 107.4270886 | 10.4802238 | 190 |
| 125 | 107.4070582 | 10.7282229 | 50 | 175 | 107.2718451 | 10.5936879 | 50 |
| 126 | 107.0607605 | 10.5627161 | 80 | 176 | 107.2793802 | 10.5940728 | 80 |
| 127 | 107.0710316 | 10.546983 | 90 | 177 | 107.2958359 | 10.6747727 | 150 |
| 128 | 107.0485622 | 10.6328866 | 100 | 178 | 107.3150366 | 10.6431725 | 120 |
| 129 | 107.0548736 | 10.6049324 | 110 | 179 | 107.2569872 | 10.6461742 | 100 |
| 130 | 107.0595686 | 10.586266 | 200 | 180 | 107.2527158 | 10.6444889 | 50 |
| 131 | 107.1263476 | 10.6439379 | 100 | 181 | 107.253576 | 10.64427 | 80 |
| 132 | 107.0564189 | 10.6245086 | 80 | 182 | 107.242989 | 10.6457916 | 80 |
| 133 | 107.0924997 | 10.6410546 | 90 | 183 | 107.3278829 | 10.4528535 | 100 |
| 134 | 107.0696791 | 10.6305131 | 100 | 184 | 107.3275584 | 10.4529541 | 150 |
| 135 | 107.1046283 | 10.6437178 | 80 | 185 | 107.3272817 | 10.4587591 | 100 |
| 136 | 107.0846291 | 10.639186 | 60 | 186 | 107.4486567 | 10.5519968 | 120 |
| 137 | 107.1618843 | 10.6565236 | 70 | 187 | 107.4828032 | 10.5523471 | 180 |
| 138 | 107.1683386 | 10.6543573 | 90 | 188 | 107.4878438 | 10.5534228 | 200 |
| 139 | 107.331577 | 10.456957 | 100 | 189 | 107.5387238 | 10.5587742 | 100 |
| 140 | 107.4190301 | 10.5678459 | 100 | 190 | 107.5436277 | 10.5484656 | 50 |
| 141 | 107.3863474 | 10.5298422 | 120 | 191 | 107.4913489 | 10.5602509 | 60 |
| 142 | 107.2144733 | 10.4847797 | 130 | 192 | 107.4109591 | 10.5297061 | 80 |
| 143 | 107.2104375 | 10.4813125 | 100 | 193 | 107.4192092 | 10.5526763 | 90 |
| 144 | 107.2138066 | 10.4864488 | 200 | 194 | 107.1189525 | 10.4002784 | 100 |
| 145 | 107.2000512 | 10.4985376 | 180 | 195 | 107.1570879 | 10.4149267 | 60 |
| 146 | 107.3887808 | 10.5527956 | 90 | 196 | 107.2881782 | 10.498286 | 70 |
| 147 | 107.4390963 | 10.6099732 | 100 | 197 | 107.0422531 | 10.5957367 | 90 |
| 148 | 107.3740277 | 10.6372208 | 120 | 198 | 107.0531962 | 10.5771138 | 100 |
| 149 | 107.4491143 | 10.6291658 | 150 | 199 | 107.0716147 | 10.6252839 | 100 |
| 150 | 107.449656 | 10.6300841 | 150 | 200 | 107.0753104 | 10.6032123 | 100 |
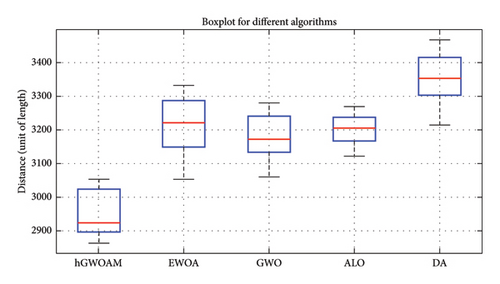
Table 13 presents the results obtained from the implementations of various algorithms. It can be observed that the best %dev solution achieved by the hGWOAM surpasses those obtained by other optimization techniques. Specifically, hGWOAM outperformed EWOA by 6.64%, GWO by 6.34%, ALO by 9.01%, and DA by 12.24%. These results demonstrate that the hGWOAM successfully achieved the optimal solution, with a total travel distance of 2863.96 units. This outcome confirms the algorithm’s capability to effectively solve the CVRP by minimizing the overall travel distance while satisfying all associated constraints.
| Algorithm | Distribution of optimum solutions | Max | Min | Mean | Deviation ratio of the best solution (%) | ||||
|---|---|---|---|---|---|---|---|---|---|
| hGWOAM | 2863.96 | 2892.86 | 2914.98 | 3000.21 | 3030.52 | 3052.89 | 2863.96 | 2951.60 | 0.00 |
| 2873.59 | 2900.75 | 2923.55 | 3007.57 | 3038.39 | |||||
| 2882.05 | 2905.34 | 2925.46 | 3019.51 | 3046.98 | |||||
| 2886.03 | 2908.91 | 2930.15 | 3028.23 | 3052.89 | |||||
| EWOA | 3054.13 | 3140.71 | 3194.87 | 3255.81 | 3301.45 | 3331.68 | 3054.13 | 3214.00 | 6.64 |
| 3102.33 | 3157.54 | 3211.25 | 3265.80 | 3305.71 | |||||
| 3117.27 | 3166.39 | 3231.79 | 3276.90 | 3319.91 | |||||
| 3127.36 | 3179.11 | 3242.31 | 3297.63 | 3331.68 | |||||
| GWO | 3045.55 | 3106.41 | 3149.81 | 3187.03 | 3249.45 | 3298.97 | 3045.55 | 3168.40 | 6.34 |
| 3060.49 | 3120.93 | 3157.10 | 3203.55 | 3270.55 | |||||
| 3073.44 | 3124.80 | 3169.68 | 3214.54 | 3285.50 | |||||
| 3093.16 | 3139.54 | 3176.67 | 3240.72 | 3298.97 | |||||
| ALO | 3121.94 | 3163.51 | 3189.62 | 3224.95 | 3242.06 | 3269.31 | 3121.94 | 3202.14 | 9.01 |
| 3138.57 | 3169.83 | 3199.52 | 3232.10 | 3253.05 | |||||
| 3148.23 | 3179.54 | 3211.03 | 3235.62 | 3265.87 | |||||
| 3158.36 | 3184.45 | 3217.14 | 3238.20 | 3269.31 | |||||
| DA | 3214.41 | 3299.00 | 3340.30 | 3374.80 | 3440.37 | 3467.00 | 3214.41 | 3354.49 | 12.24 |
| 3245.03 | 3307.37 | 3349.24 | 3398.25 | 3450.57 | |||||
| 3259.32 | 3316.18 | 3355.31 | 3405.33 | 3456.30 | |||||
| 3287.20 | 3332.29 | 3365.85 | 3425.62 | 3467.00 | |||||
Figure 11 visually represents the data distribution, clearly illustrating the superior performance of the hGWOAM compared to other methods. The results indicate that hGWOAM consistently outperforms competing algorithms across multiple trials, highlighting its robustness and efficiency. Additionally, Table 14 provides a detailed breakdown of the delivery routes for the 37 trucks determined by hGWOAM. This detailed breakdown ensures efficient delivery operations while strictly adhering to vehicle capacity constraints, further validating the algorithm’s effectiveness in optimizing complex logistics scenarios.
| Routes of the vehicles in Case Study 3 | Distance | |
|---|---|---|
| 01 | 0 ⟶ Location 28 ⟶ Location 23 ⟶ Location 24 ⟶ Location 25 ⟶ Location 14 ⟶ Location 13 ⟶ Location 12 ⟶ 0 | 79.73 |
| 02 | 0 ⟶ Location 26 ⟶ Location 27 ⟶ Location 22 ⟶ Location 34 ⟶ 0 | 64.83 |
| 03 | 0 ⟶ Location 21 ⟶ Location 20 ⟶ Location 15 ⟶ Location 19 ⟶ Location 36 ⟶ Location 10 ⟶ 0 | 71.48 |
| 04 | 0 ⟶ Location 17 ⟶ Location 35 ⟶ Location 33 ⟶ Location 16 ⟶ Location 31 ⟶ Location 32 ⟶ Location 18 ⟶ 0 | 84.34 |
| 05 | 0 ⟶ Location 30 ⟶ Location 9 ⟶ Location 5 ⟶ Location 29 ⟶ Location 3 ⟶ Location 4 ⟶ 0 | 73.61 |
| 06 | 0 ⟶ Location 7 ⟶ Location 6 ⟶ Location 1 ⟶ Location 2 ⟶ Location 8 ⟶ Location 11 ⟶ 0 | 56.24 |
| 07 | 0 ⟶ Location 54 ⟶ Location 56 ⟶ Location 51 ⟶ Location 33 ⟶ Location 4 ⟶ 0 | 101.49 |
| 08 | 0 ⟶ Location 36 ⟶ Location 34 ⟶ Location 42 ⟶ Location 9 ⟶ Location 20 ⟶ 0 | 85.77 |
| 09 | 0 ⟶ Location 35 ⟶ Location 48 ⟶ Location 55 ⟶ Location 30 ⟶ 0 | 70.93 |
| 10 | 0 ⟶ Location 45 ⟶ Location 19 ⟶ Location 58 ⟶ Location 50 ⟶ Location 32 ⟶ 0 | 93.88 |
| 11 | 0 ⟶ Location 62 ⟶ Location 44 ⟶ Location 28 ⟶ Location 22 ⟶ Location 24 ⟶ Location 12 ⟶ 0 | 107.47 |
| 12 | 0 ⟶ Location 37 ⟶ Location 17 ⟶ Location 25 ⟶ Location 27 ⟶ Location 57 ⟶ Location 5 ⟶ 0 | 75.79 |
| 13 | 0 ⟶ Location 2 ⟶ Location 40 ⟶ Location 7 ⟶ Location 6 ⟶ 0 | 59.68 |
| 14 | 0 ⟶ Location 46 ⟶ Location 23 ⟶ Location 31 ⟶ Location 26 ⟶ Location 14 ⟶ Location 39 ⟶ 0 | 77.56 |
| 15 | 0 ⟶ Location 38 ⟶ Location 15 ⟶ Location 13 ⟶ Location 10 ⟶ Location 47 ⟶ 0 | 88.83 |
| 16 | 0 ⟶ Location 60 ⟶ Location 59 ⟶ Location 11 ⟶ Location 52 ⟶ Location 18 ⟶ Location 21 ⟶ Location 16 ⟶ 0 | 100.13 |
| 17 | 0 ⟶ Location 63 ⟶ Location 53 ⟶ Location 61 ⟶ Location 49 ⟶ Location 3 ⟶ 0 | 97.72 |
| 18 | 0 ⟶ Location 8 ⟶ Location 43 ⟶ Location 1 ⟶ Location 41 ⟶ Location 29 ⟶ 0 | 78.18 |
| 19 | 0 ⟶ Location 7 ⟶ Location 8 ⟶ Location 10 ⟶ Location 9 ⟶ Location 17 ⟶ Location 16 ⟶ Location 14 ⟶ 0 | 138.46 |
| 20 | 0 ⟶ Location 20 ⟶ Location 13 ⟶ Location 18 ⟶ Location 15 ⟶ 0 | 104.39 |
| 21 | 0 ⟶ Location 21 ⟶ Location 22 ⟶ Location 24 ⟶ Location 25 ⟶ Location 32 ⟶ 0 | 121.06 |
| 22 | 0 ⟶ Location 23 ⟶ Location 12 ⟶ Location 1 ⟶ Location 2 ⟶ Location 33 ⟶ 0 | 107.51 |
| 23 | 0 ⟶ Location 11 ⟶ Location 4 ⟶ Location 19 ⟶ Location 28 ⟶ Location 27 ⟶ Location 26 ⟶ 0 | 119.19 |
| 24 | 0 ⟶ Location 31 ⟶ Location 5 ⟶ Location 6 ⟶ Location 30 ⟶ Location 3 ⟶ Location 29 ⟶ 0 | 130.28 |
| 25 | 0 ⟶ Location 31 ⟶ Location 10 ⟶ Location 30 ⟶ Location 8 ⟶ Location 20 ⟶ 0 | 33.91 |
| 26 | 0 ⟶ Location 7 ⟶ Location 32 ⟶ Location 9 ⟶ Location 19 ⟶ Location 6 ⟶ Location 34 ⟶ 0 | 28.11 |
| 27 | 0 ⟶ Location 12 ⟶ Location 23 ⟶ Location 13 ⟶ Location 11 ⟶ 0 | 14.43 |
| 28 | 0 ⟶ Location 33 ⟶ Location 5 ⟶ Location 4 ⟶ Location 3 ⟶ Location 36 ⟶ Location 14 ⟶ Location 15 ⟶ 0 | 28.68 |
| 29 | 0 ⟶ Location 22 ⟶ Location 25 ⟶ Location 21 ⟶ Location 2 ⟶ Location 1 ⟶ 0 | 31.96 |
| 30 | 0 ⟶ Location 28 ⟶ Location 26 ⟶ Location 29 ⟶ Location 35 ⟶ 0 | 31.61 |
| 31 | 0 ⟶ Location 27 ⟶ Location 24 ⟶ Location 18 ⟶ Location 17 ⟶ Location 16 ⟶ 0 | 34.98 |
| 32 | 0 ⟶ Location 4 ⟶ Location 7 ⟶ Location 2 ⟶ Location 9 ⟶ Location 1 ⟶ 0 | 89.93 |
| 33 | 0 ⟶ Location 19 ⟶ Location 15 ⟶ Location 10 ⟶ Location 3 ⟶ Location 31 ⟶ 0 | 90.26 |
| 34 | 0 ⟶ Location 24 ⟶ Location 13 ⟶ Location 8 ⟶ Location 12 ⟶ Location 5 ⟶ Location 6 ⟶ Location 22 ⟶ 0 | 90.50 |
| 35 | 0 ⟶ Location 29 ⟶ Location 26 ⟶ Location 14 ⟶ Location 18 ⟶ Location 30 ⟶ Location 23 ⟶ Location 32 ⟶ 0 | 83.84 |
| 36 | 0 ⟶ Location 16 ⟶ Location 20 ⟶ Location 17 ⟶ Location 21 ⟶ Location 25 ⟶ Location 27 ⟶ 0 | 83.33 |
| 37 | 0 ⟶ Location 28 ⟶ Location 11 ⟶ 0 | 33.86 |
- Note: Total distance 2863.96 (unit of length)
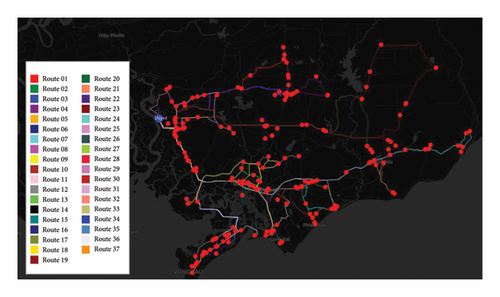
Figure 12 illustrates the delivery routes of 37 trucks, highlighting the practical application of the hGWOAM in optimizing deliveries and minimizing travel distances. In combination with the data presented in Table 14, this visualization underscores the algorithm’s robustness and efficiency in addressing complex CVRP scenarios. The integration of detailed tabular results and graphical insights demonstrates how hGWOAM effectively manages multiple delivery routes, ensuring minimal total travel distance while adhering to vehicle capacity and delivery constraints. These results reinforce the algorithm’s capability to efficiently handle real-world logistical challenges.
4. Conclusion
- •
Case Study 1: In involving eight clients and two delivery vehicles, hGWOAM outperformed comparative algorithms, achieving the lowest mean percentage deviation (%dev). Specifically, it surpassed EWOA (0.89%), GWO (0.74%), SCA (0.59%), DA (1.63%), ALO (2.26%), MHPSO (1.85%), PSO (1.96%), DPGA (2.85%), and SGA (4.14%).
- •
Case Study 2: With 18 customers and three delivery vehicles, hGWOAM produced the shortest delivery distance of 414.39 units, demonstrating substantial improvements in %dev compared to EWOA (12.05%), GWO (2.53%), ALO (21.07%), and DA (17.58%). This underscores its effectiveness in more complex logistic environments.
- •
Case Study 3: The most complex scenario involved delivering cement to 200 customers using 37 trucks. The hGWOAM achieved an optimal distance of 2863.96 units, outperforming EWOA by 6.64%, GWO by 6.34%, ALO by 9.01%, and DA by 12.24%. These results illustrate hGWOAM’s scalability and high efficiency in addressing large-scale logistics problems.
The three case studies consistently confirmed the robustness and superior efficiency of hGWOAM in solving CVRP challenges, successfully minimizing total travel distances while fully meeting operational constraints. Overall, this research confirms hGWOAM’s effectiveness as a powerful optimization method, providing significant contributions and implications for logistics and construction management.
5. Discussion of Limitations and Future Research Directions
Despite its strengths, the hGWOAM hybrid model has limitations, particularly its slow convergence in complex or high-dimensional optimization problems, which can lead to impractically long computation times. Future research could address this issue by exploring adaptive parameter settings, dynamic population sizing, and hybridization with algorithms such as PSO or GA to improve the exploration–exploitation balance, enhance solution diversity, and increase computational efficiency. The algorithm’s longer runtime and reduced performance in large-scale problems highlight the need for improved computational efficiency. Strategies such as code optimization, high-performance computing, heuristic methods, problem decomposition, and parallel processing could significantly enhance the scalability and effectiveness of hGWOAM. Implementing these improvements would broaden hGWOAM’s applicability from specific calculations to a wide range of logistics and supply chain management tasks. By increasing versatility and robustness, these advancements would ensure that hGWOAM remains a valuable tool for logistics and construction management, capable of meeting complex industry demands.
Conflicts of Interest
The authors declare no conflicts of interest.
Author Contributions
All authors, including Vu Hong Son Pham, Nghiep Trinh Nguyen Dang, and Van Nam Nguyen, jointly contributed to the writing of the main manuscript, preparation of all figures and tables, and reviewed and approved the final version prior to submission.
Funding
This research did not receive dedicated funding from public, commercial, or non-profit grant agencies.
Acknowledgments
We would like to thank Ho Chi Minh City University of Technology (HCMUT), VNU-HCM, for the support of time and facilities for this study.
Open Research
Data Availability Statement
The corresponding author is available to provide the data, model, or code underlying the findings of this study upon request, in accordance with reasonable conditions.


