A Study of Mixed Platooning Considering Driver Perceptual Uncertainty
Abstract
Human-driven vehicles (HDVs) are the most critical element in mixed platoon research for their uncertainty. This paper presents a novel car-following model that considers the driver’s perceived uncertainty. A mixed platoon model of HDVs and connected and autonomous vehicles (CAVs) is established. Through data analysis, the stability of this model is validated. Additionally, a meticulous comparison and analysis regarding the platoon convergence ability and stable state under various platoon grouping forms and running speeds are carried out. Further, this paper introduces a virtual spring strategy to describe the car-following relationship between mixed platoon vehicles. Numerical simulations are then employed to explore the anti-interference capabilities of different mixed platoon modes and lengths. The results indicate that CAVs can effectively attenuate the randomness of HDVs. The platoon formation and operating speed impact the stability of mixed vehicle platoons. The platooning configuration “1 + n + 1” as the smallest platooning unit can help mixed vehicle platoons achieve a better stable state more quickly, with the optimal platoon length being four vehicles. However, as the platoon combinations grow more complex, the optimal platooning unit tends to shorten.
1. Introduction
With the development of intelligent transportation systems (ITS) and autonomous driving technology, self-driving vehicles can acquire information about neighboring vehicles through vehicle-to-vehicle communication and form a platoon for cooperative driving. Vehicle formation has great potential to improve road capacity and reduce fuel consumption [1]. Therefore, many studies have focused on isomorphic formation, which consists of networked autonomous driving vehicles. However, autonomous vehicle technology is still in the development stage. For a long time in the future, hybrid traffic consisting of self-driving vehicles with different degrees of network and human-driven vehicles (HDVs) with different levels of intelligence will be driving together on the road.
In the mixed traffic flow, vehicle formation consists of a self-driving vehicle (connected and autonomous vehicle [CAV]) and an HDV, called a hybrid platoon [2]. Compared to a standard platoon (consisting of CAVs only), hybrid platoon control does not aim at reducing the driving distance but stabilizes and improves the traffic flow by attenuating the erratic and random behavior of HDVs. Accordingly, the control of this hybrid formation is more challenging, mainly due to the following reasons: inability to obtain the exact state of HDVs, which is roughly modeled by the car-following model; HDVs have driving behavior randomness; HDV dynamics model changes with speed. Many scholars have conducted extensive research on the new mixed traffic flow, and the following will summarize the previous research results in terms of traffic flow model, platoon stability, and platoon length.
CAV and HDV must be analyzed and modeled separately to study novel mixed traffic flow. Since the development of the car-following model theory, dozens of car-following models have been used to characterize the micro-behavior of HDVs, including theory-driven traditional car-following models and data-driven novel models. Still, most of them simplify the factors that influence the process of driver-following to different degrees [3]. CAV belongs to the personification based on HDV, so the model is also mostly modeled based on the human car-following model, which mainly uses the intelligent driver model (IDM), safe distance model, optimal velocity (OV) model, and adaptive cruise control/cooperative adaptive cruise control (ACC/CACC) controller model to describe the longitudinal behaviors [4]. However, there is a great deal of randomness in the perception-decision-control process of human drivers, and many scholars have carried out substantial research on modeling such driving stochastic behaviors. Sheu and Wu [5] proposed a dynamic stochastic driver perception model, investigated the relationship between the uncertainty of perceived relative speed and reaction time during vehicle following, and performed a qualitative analysis using quantum optical flow theory to reveal the psychological and behavioral characterization of drivers in uncertain traffic environments. Wu et al. [6] assumed that the perceived distance error of the driver in the workshop follows a probability distribution at any time, established a functional relationship between the parameters of the probability density function and the actual vehicle spacing and the driver’s aggressiveness characteristics, then used the longitudinal control model (LCM) as the benchmark car-following model, and modeled and calibrated the car-following behavior based on the uncertainty of the driver’s distance perception. It has been argued that drivers adjust their driving behavior not only by considering the vehicle state at the current moment but also by predicting the change of state at the future moment. Yi-Rong et al. [7] proposed a new traffic flow following model based on the full velocity difference (FVD) model by considering headway spacing and speed difference at the future moment. Gong and Du [8], on the other hand, used online vehicle trajectory data and features of the Newell following model to predict reaction time and minimum stopping distance through a curve-matching learning algorithm, then modeled human driver’s car-following behavior using Newell’s model. Messaoudi [9] proposed an OV robust car-following model (OV-RCFM) for dealing with control uncertainty based on the imprecision of vehicle actions to produce a more accurate and realistic model of longitudinal control behaviors in stochastic and uncertain environments. However, these studies depend on their choice of baseline model, and their uncertainties must be re-examined when faced with different model choices for various situations.
In terms of hybrid platoon stability analysis, Zhou et al. [10] discussed the definitions of vehicle formation local stability and string stability and then proposed a hybrid formation string stability criterion. Based on this criterion, a CAV control strategy is proposed, and an h-∞ control problem is formulated to solve the control parameters. Chang et al. [11] used the CACC model and the car-following model to describe the CAV and HDV, respectively, and proposed a string stability criterion to ensure the boundedness of platoon fluctuations and platoon safety while obtaining the stability conditions for the mixed traffic flow. Sun et al. [12] investigated the influential relationship between heeling instability and traffic oscillations, and case studies showed that individual vehicles with higher stability can reduce the severity of platooning oscillations and that ideal headway spacing is the most influential factor in smoothing traffic oscillations. To consider the heterogeneity of drivers and vehicles, Montanino and Punzo [13] developed a unified framework to simulate the chordal stability of mixed traffic flows. A simulated experimental scenario was constructed based on the car-following model; small fluctuations, such as acceleration and deceleration of vehicles, were added to the stable traffic flow, and then the stability of the traffic flow was discussed by analyzing the process of restoring the steady state of the traffic flow.
Traffic flow traveling in platoons also affects road capacity and safety [14]. Platoon length and penetration rate are the essential factors. Zhou and Zhu [15] and Chang et al. [11] investigated the impact of maximum platoon size on road capacity and traffic flow stability in CAV platoons under different penetration rates, respectively, and then developed analytical methods for analyzing mixed traffic flow stability and fundamental diagram models. Yao et al. [16] investigated the basic diagram and stability of mixed traffic flow considering the platoon size and intensity of CAVs and pointed out that larger platoon sizes help to increase traffic capacity but are detrimental to maintaining the stability of traffic flow than suggested that the platoon sizes should be set between 4 and 6 to balance the relationship between traffic capacity and stability. Jiang et al. [17] analyzed the spatial distribution of vehicles in mixed traffic flow, derived the distribution probabilities of different following modes based on the maximum platoon size of CAVs, evaluated the impact of platoon size on the safety of mixed traffic flow based on numerical simulation, and proposed the optimal platoon size under different penetration rates of CAVs, with platoon sizes of 2 to 3 vehicles for penetration rates less than 40% and penetration rates greater than 40% for platoon sizes of 4 to 7 vehicles, which has higher queue security. Zeng et al. [18] proposed a two-lane heterogeneous traffic flow meta-cellular automata model for CAVs and HDVs and simulated and analyzed it with MATLAB to study the driving state of traffic flow under different mixing ratios and platoon sizes. Meanwhile, it investigated the effects of forming platoons by CAVs and the platoon sizes on traffic flow congestion and energy consumption. Yao et al. [14] used the Markov chain model to derive the probability distribution of CAV platoon size and proposed a mixed traffic flow capacity model and stability conditions based on the probability distribution of platoon size, showing that a larger maximum platoon size can only improve the capacity, which is not conducive to the stability and safety of the mixed traffic flow, fuel consumption, and emission. The above studies on platoon length have investigated the effect of platoon size on mixed traffic flow from different perspectives. However, the platoon lengths they discuss are homogeneous, namely CAV platoons, so more consideration and research must be conducted on mixed platoons in mixed traffic flows.
- 1.
Considering the driver’s perceived uncertainty, an improved car-following model based on the Helly model is proposed, which can fully simulate the driver’s perceptual error and can more accurately describe the state of HDVs in the traffic flow;
- 2.
A mixed-vehicle platoon model was established to analyze the stability of mixed platoons. The results show that the model can converge to a stable state;
- 3.
Based on the virtual spring model, the stability of platoons under various formation patterns was derived, and the minimum grouping unit in mixed traffic scenarios was analyzed. Optimal platoon lengths were obtained through simulation.
The rest of the paper is organized as follows. Section 2 establishes a mixed platoon model for CAVs and HDVs, and a virtual spring strategy was proposed to describe the platoon’s motion state. Section 3 proposes a probabilistic model of perceived uncertainty and conducts calibration and validation analysis. Section 4 analyzes the stability of mixed traffic flow through numerical simulation and discusses the impact of platoon formation patterns and platoon length on mixed traffic flow. Section 5 summarizes the whole paper.
2. Mixed Vehicle Platoon Model
Car-following models control the longitudinal interaction of vehicles with the vehicle in front of them. They have a fundamental role in modern traffic flow theory. The mixed platoon model must be built to study the impact of mixed platoons on traffic flow.
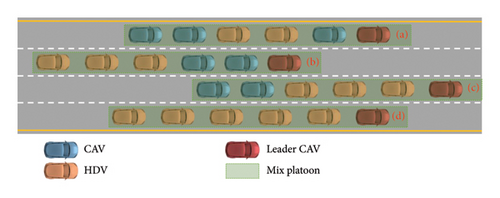
This paper’s mixed platoon consists of HDVs and CAVs. The different sequencing of vehicles in the platoon forms different information flow topologies, which in turn affect the propagation of traffic information and thus significantly impact the motion state and stability of the platoon. It is assumed that CAVs in the platoon are controllable. Figure 1 shows several common mixed platoon formation patterns, with the lead vehicle in each pattern set as a CAV.
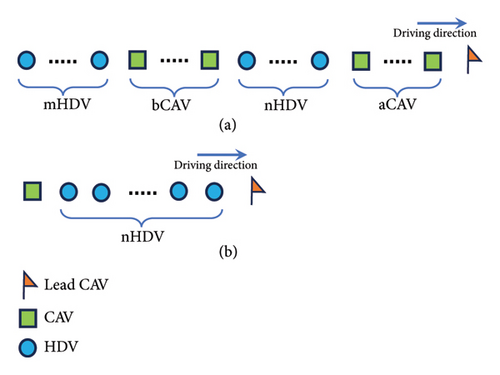
Although various formation patterns exist in mixed platoons, they can all be expressed as a superimposed formation of CAVs-HDVs. In Figure 2, (a) can be considered as the standard formation of mixed platoons and (b) is one of the formation patterns.
2.1. Mixed Platoon Motion Equations
In the hybrid platoon model, it is assumed that the lead vehicles are all CAVs, and the following vehicles include HDVs and CAVs. The lead CAVs only consider the information of the vehicles in front of them, and the following CAVs can obtain the state information of the lead vehicles and the vehicles in front of them through V2V communication and onboard sensors. Here, it is assumed that the communication distance is greater than the length of the formation, and the information acquisition from the vehicle sensors does not consider the effects of weather and road conditions. Meanwhile, unlike CAVs, HDVs can only acquire information about the vehicle in front of them through the driver’s perception, and the driver’s reaction delay is considered.
2.2. HDV Model
2.3. CAV Model
2.4. Virtual Spring Strategy
The motion state of the leading vehicle is the most direct and significant factor in vehicle following. To analyze the platoon state more intuitively and precisely, a virtual spring strategy is introduced to describe the following relationship between vehicles in a mixed platoon, connecting each leading vehicle with a following vehicle using a virtual spring, as in Figure 3.
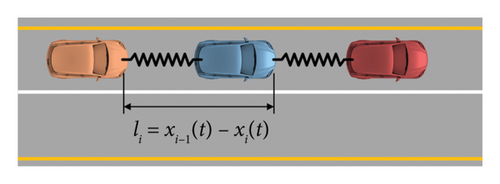
In the formula, li represents the actual length of the virtual spring between the vehicle i and the front vehicle i − 1, and lr represents the relaxation length of the virtual spring between the two vehicles.
In the formula, kr is the virtual spring stiffness coefficient and kd is the damping coefficient.
3. The HDV Model Considering Perceived Uncertainty and Calibration
3.1. The HDV Car-Following Model Considering Driver Perceptual Uncertainty
About 90% of the driving information the driver receives is input through the eyes [24]. Due to the wave-image duality in the visual information transfer process, perceptual errors may arise in perceiving moving images [25], which leads to the driver’s perceptual uncertainty during vehicle following [26] and complicates the traffic phenomenon. Therefore, driver perceptual uncertainty, the basis of driving behavior uncertainty, should be considered when using the following model to characterize traffic flow state changes.
3.2. Probability Distribution of Uncertainty
Numerous factors affect the driver’s perceived vehicle spacing error during driving, such as road conditions (highway type, traffic conditions, road geometric features, etc.), vehicle type, and driver characteristics (gender, age, driving experience, etc.). The estimation of the driver’s perception of vehicle spacing during driving can be regarded as a random phenomenon with certain stochastic characteristics, which is assumed to obey a normal distribution [6, 27, 28], px ~ N(μ, σ2).
3.3. Eigenvalue Estimation for Normal Distribution
- 1.
The vehicles in the convoy need to be small to avoid potential differences in the following characteristics of different vehicle types;
- 2.
The convoy does not change lanes during the following process to avoid the impact of lane changing on the subsequent behavior;
- 3.
Excluding the following convoys driving on exit and entrance ramps to ensure the consistency of the driving behavior of the studied convoys.

The following segment data mainly contains information such as time, speed, position, acceleration, etc., and the data are preprocessed to eliminate the missing data and calculate the variables required for modeling operations, obtaining 27,000 car-following fragment data. Since obtaining vehicle following data under all traffic, road, and weather conditions is impossible, it is necessary to estimate the driver’s overall perceptual uncertainty based on sample data. Maximum likelihood estimation can be used to calculate the mean and standard deviation of the uncertainty perception coefficients of the follow-through segments, given the observed data to evaluate the model parameters as in Figure 5.
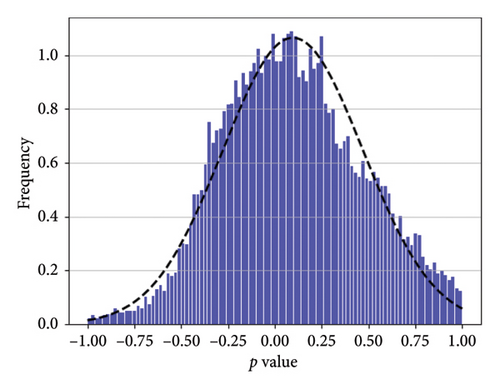
The mean value of the normal distribution estimated by the car-following fragment data is 0.09, and the variance is 0.14, that is, px ~ N(0.09, 0.14), and the 95% confidence interval of the coefficient px is (−0.14, 0.33). The above results also show that the driver’s perceptual error is inherent in driving the vehicle to follow the vehicle, and this error is not fixed. It is affected by various factors and shows a certain degree of randomness.
3.4. Validation of Uncertainty Assumptions
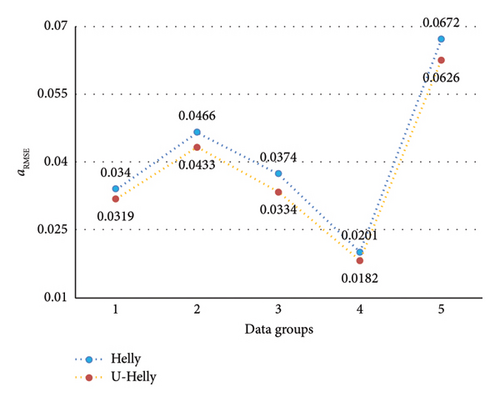
Five drivers’ car-following data were randomly selected to verify the model. These five data groups randomly select driving-trajectory data at different operating speeds and can represent driving situations under different traffic-flow states. Each group contains approximately 300 data points. Table 1 counts the errors of five groups of different driving data. The results of the weighted RMSE of the model are as follows.
| Model | 1 | 2 | 3 | 4 | 5 |
|---|---|---|---|---|---|
| Helly | 0.0340 | 0.0466 | 0.0374 | 0.0201 | 0.0672 |
| U-Helly | 0.0319 | 0.0433 | 0.0334 | 0.0182 | 0.0626 |
As can be seen in Figure 6, the aRMSE values of the U-Helly model are smaller than those of the Helly model under five different sets of driving data conditions. This indicates that the improved model that considers the distance-perceived uncertainty is more attuned to the driving behaviors, and the model is more in line with the actual driving situation. Therefore, this perceptual uncertainty is fixed in the driver’s driving behavior and is a non-negligible influencing factor.
4. Numerical Experiments
4.1. Experimental Scenario Setup
In the experiments, it is assumed that all vehicles are traveling on the primary section of an urban expressway, and the control parameters of each vehicle are shown in Table 2 [22, 23]. In mixed traffic flow, vehicle formations are formed between CAVs and HDVs with small vehicle spacing, and only CAVs are considered lead vehicles. Regarding communication topology, CAVs use the head and front vehicle topology. That is, self-driving cars can obtain the state information of the leader vehicle and the vehicle in front of them and do not set the communication delay value during the simulation. Even though the leading vehicle is a CAV, its communication follows the front-vehicle topology, much like that of HDVs. HDVs can only receive the state information of the front vehicle through human perception.
| Parameter | Value | Unit |
|---|---|---|
| C1 | 0.5 | — |
| C2 | 0.125 | — |
| α | −0.018 | s2/m |
| β | 1.2 | s |
| γ | 7 | m |
| Ks,p | 0.1922 | — |
| Kv,p | 0.1771 | — |
| Kv,l | 0.1986 | — |
4.2. Stability Analysis
Traffic flow stability is an essential indicator of the smooth operation of a transportation system in response to disturbances [13, 14]. For a following platoon on the road that is in equilibrium, if one or more vehicles change their driving behaviors, such as acceleration and deceleration, sudden braking, lane changing, etc., these changes will affect the driving behaviors of the vehicles behind them, resulting in fluctuations of vehicle speed in the traffic flow. If the magnitude of this fluctuation gradually increases, it evolves into the instability of the platooning system. On the contrary, if the system decays, tends to zero over time, and eventually returns to equilibrium, the system is stable.
In this section, the results of numerical simulations will be used to analyze the formation stability of mixed traffic flows. The basic concept of stability is to study whether the mixed traffic flow can be restored to the steady state and to study the restoration process by incorporating small fluctuations in the steady state traffic flow. To verify the mixed platoon stability state of the model, the grouping form of platoon A is selected, and the platoon motion state evolution process of the original model and the model considering the perceived uncertainty is simulated when the stable speed is 20 m/s, as shown in Figure 7. The solid line represents HDVs, the dotted line represents CAVs, and the first vehicle is the leader vehicle.
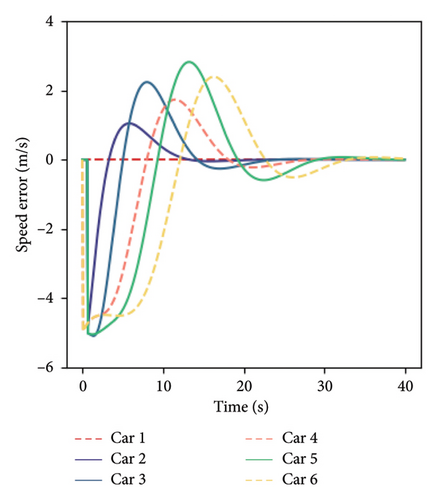
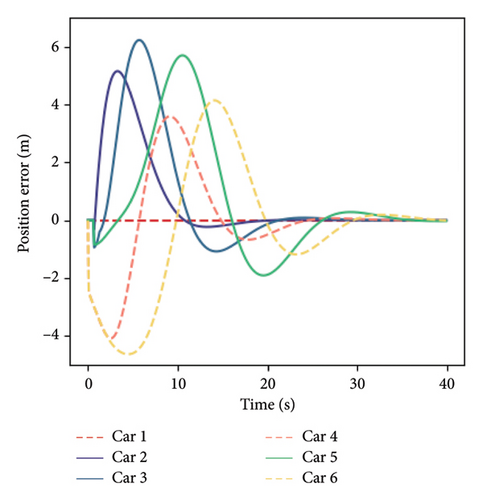
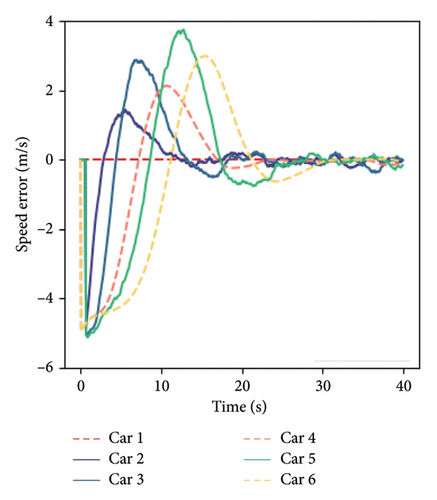
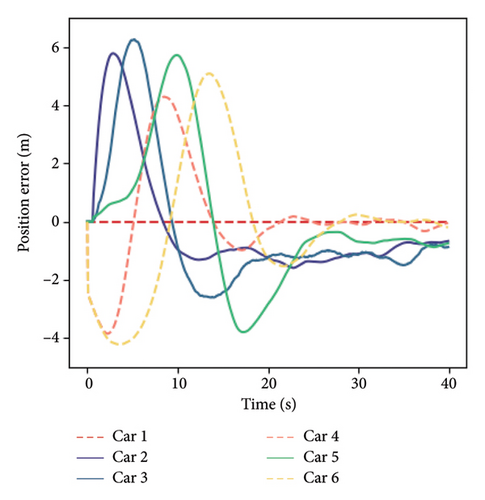
Comparing the time when the platoon returns to the stable state, it can be found that it can restore the expected steady-state speed, and the stability time is the same, which indicates that the model can achieve stable driving of the vehicle platoon and considering the perceived uncertainty will not significantly change the rate at which the formation returns to a stable state. In (a) and (b), the parameter of perceived uncertainty takes a fixed value of 0. However, in actual traffic flow evolution, HDVs have internal disturbances due to the driver’s perceptual randomness and susceptibility to interference, which will negatively impact formation stability and cannot achieve the ideal stable state. The platoons that return to a stable state in (c) and (d) are still in slight oscillation, and HDVs show a non–smooth effect that changes with time, which is related to the perceptual decision-making of HDV drivers. When the driver’s perceptual uncertainty is considered, the hybrid formation has self-disturbance and cannot achieve absolute stability. In addition, observation (d) shows a steady-state error of about 1.0 m in the HDVs in the platoon, which is due to the error of the driver’s perception of the spacing. When the platoon reaches a steady-state speed of 20 m/s, the driver’s choice of car-following spacing and perceived spacing cannot be consistent.
5. Effects of Different Platoon Forms
The mixed vehicle platoon has a variety of forms of formation selection. The formation with the same platoon length and permeability is set up to study the motion state of different platoon forms. The four groups of vehicle platoons with different platoon forms in Figure 1 are simulated and analyzed. As mentioned above, the elastic potential energy is used to characterize the current motion state of the platoons. Figure 8 shows the changes in the elastic potential energy of the four platoons. Each group of platoons gives the virtual elastic potential energy of each vehicle in the vehicle platoon (left) and the overall elastic potential energy of the platoon (right). The elastic potential energy of each vehicle represents the energy stored in the spring force of the preceding vehicle on the vehicle, and the total elastic potential energy represents the energy of all virtual springs in the platoon.
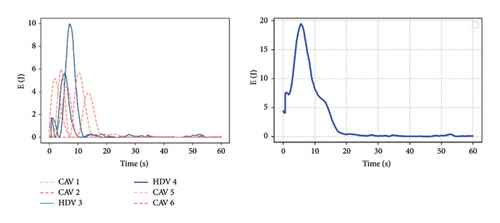
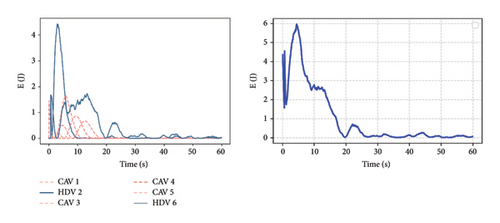
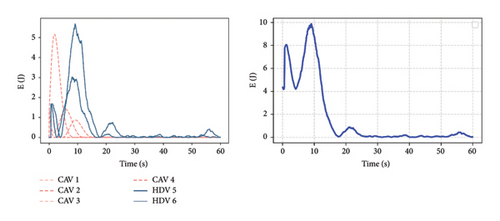
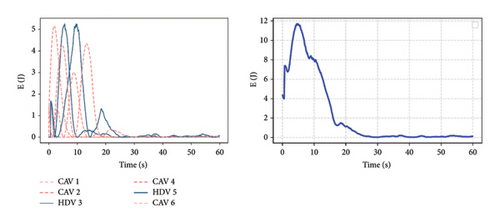
It can be seen from the left figure that the elastic potential energy of each virtual spring gradually decreases to close to 0, which means that each vehicle in the vehicle platoon is adjusted to the desired state. The figure on the right side also shows that the vehicle platoon has reached the expected stable car-following state. However, observing the change of HDV, it is found that the potential energy will deviate slightly from the expected state when it tends to 0. Still, this slight deviation will hardly affect the motion state of CAV, which means that there is only a slight disturbance inside the vehicle platoon, which has little effect on the traffic flow outside the vehicle platoon. After the vehicle platoon reaches a stable state, comparing the potential energy curves of the four platoons, it is found that when there is HDV at the tail of the vehicle platoon (i.e., platoon B, C), the spring potential energy of the vehicle platoon is higher than that of platoons A and D. This is because the CAV vehicle in platoons A and D absorbs the energy of HDV. In contrast, the potential energy of the tail HDV in platoons B and C can only converge to zero over time. Comparing the time when the potential energy curve tends to 0, it can be found that the performance of group A is better than that of other vehicle platoons. Therefore, the platoon form with CAV at the tail can help the vehicle platoon obtain a better, more stable state faster.
5.1. The Influence of Platoon Length
Under the condition of mixed traffic flow, the anti-disturbance of CAV in the formation makes the evolution process of traffic wave relatively smooth. In the above analysis, it is found that when CAV is used as the last vehicle of the platoon, the platoon has better internal stability performance. Therefore, the form of “1 + n + 1” is selected as the formation pattern, as shown in Figure 2, to study the influence of different platoon lengths on the platoon. Three steady-state velocities are set in the experiment, 10, 20, and 30 m/s, representing congestion, normal, and free flow scenarios. The results are shown in Table 3 when the platoon length is 3, 4, and 5, respectively.
| Vehicle number | Vehicle ID | Average (m/s) | Standard deviation (m/s) | ||||
|---|---|---|---|---|---|---|---|
| 10 | 20 | 30 | 10 | 20 | 30 | ||
| N = 3 | 1 | 10 | 20 | 30 | 0 | 0 | 0 |
| 2 | 9.9961 | 19.9904 | 29.9873 | 0.1027 | 0.1376 | 0.1605 | |
| 3 | 9.9931 | 19.9969 | 29.9975 | 0.0568 | 0.0679 | 0.0829 | |
| N = 4 | 1 | 10 | 20 | 30 | 0 | 0 | 0 |
| 2 | 10.0052 | 19.9918 | 29.9899 | 0.0737 | 0.1302 | 0.1497 | |
| 3 | 10.0059 | 19.9997 | 30.0180 | 0.0936 | 0.1681 | 0.1762 | |
| 4 | 9.9999 | 20.0033 | 29.9956 | 0.0493 | 0.1043 | 0.1225 | |
| N = 5 | 1 | 10 | 20 | 30 | 0 | 0 | 0 |
| 2 | 9.9994 | 20.0008 | 30.0031 | 0.0786 | 0.1007 | 0.1143 | |
| 3 | 9.9929 | 20.0074 | 29.9989 | 0.1248 | 0.1737 | 0.1719 | |
| 4 | 10.0053 | 20.0165 | 30.1123 | 0.1417 | 0.2612 | 0.2916 | |
| 5 | 9.9991 | 20.0036 | 30.0102 | 0.0863 | 0.1794 | 0.1853 | |
N is the length of the platoon, and it can be seen from Table 3 that in different traffic flow scenarios, the speed fluctuation of HDV will gradually increase with the transmission of the vehicle following HDV, leading to the instability of the platoon. The continuous change of the motion state of the vehicle platoon may lead to instability or even traffic flow congestion. In different traffic flow scenarios, the standard deviation of the platoon increases with the increase of the equilibrium speed, which means that the higher the running speed of the platoon, the greater the transmission of HDV instability and the greater the fluctuation of the platoon.
Through observation, the CAV standard difference at the tail of the platoon will be smaller than that of its front vehicle, indicating that it can prevent the unstable transmission caused by the overall HDV vehicle. When the platoon length is 4, the velocity standard deviation of the tailed CAV is smaller than that of the first HDV, which indicates that the CAV successfully eliminates the velocity instability of the HDVs in the platoon and controls the oscillation of the platoon. When the platoon length is 5, the attenuation effect of CAV is significantly reduced. Therefore, when the platoon length is 4, the platoon can maintain a stable state in different traffic flow scenarios.
The stable platoon’s length will change when the number of CAVs at the platoon’s tail increases. Table 4 shows that the fluctuation resolution effect is better when the platoon length is 6, and there are 3 HDVs in the platoon. Compared with Table 3, multiple CAVs can eliminate the self-disturbance of more HDVs, and the platoon length can be increased.
| Vehicle number | Vehicle ID | Average (m/s) | Standard deviation (m/s) | ||||
|---|---|---|---|---|---|---|---|
| 10 | 20 | 30 | 10 | 20 | 30 | ||
| N = 5 | 1 | 10 | 20 | 30 | 0 | 0 | 0 |
| 2 | 10.0005 | 20.0124 | 29.9971 | 0.0959 | 0.1523 | 0.1557 | |
| 3 | 9.9958 | 20.0091 | 30.0127 | 0.1292 | 0.1542 | 0.2636 | |
| 4 | 9.9917 | 20.0066 | 30.0058 | 0.0833 | 0.0915 | 0.1549 | |
| 5 | 9.9931 | 20.0050 | 29.9970 | 0.0609 | 0.0695 | 0.1105 | |
| N = 6 | 1 | 10 | 20 | 30 | 0 | 0 | 0 |
| 2 | 10.0002 | 20.0051 | 29.9980 | 0.0896 | 0.1151 | 0.1196 | |
| 3 | 10.0076 | 20.0086 | 29.9927 | 0.1177 | 0.1507 | 0.1609 | |
| 4 | 10.0088 | 20.0100 | 30.0024 | 0.1688 | 0.1989 | 0.1989 | |
| 5 | 10.0072 | 20.0134 | 30.0023 | 0.1113 | 0.1223 | 0.1076 | |
| 6 | 10.0019 | 20.0128 | 29.9915 | 0.0887 | 0.0955 | 0.0821 | |
| N = 7 | 1 | 10 | 20 | 30 | 0 | 0 | 0 |
| 2 | 10.0076 | 19.9939 | 30.0022 | 0.1042 | 0.1181 | 0.1367 | |
| 3 | 10.0073 | 19.9966 | 29.9983 | 0.1429 | 0.1571 | 0.1789 | |
| 4 | 10.0036 | 19.9951 | 30.0004 | 0.2224 | 0.2060 | 0.2355 | |
| 5 | 9.9987 | 20.0099 | 30.0289 | 0.2787 | 0.2334 | 0.3626 | |
| 6 | 9.9937 | 20.0247 | 30.0335 | 0.1926 | 0.1603 | 0.2474 | |
| 7 | 10.0097 | 20.0184 | 30.0122 | 0.1546 | 0.1285 | 0.2068 | |
The platoon formation can consist of multiple combinations of the minimum grouping unit. For this reason, a vehicle platoon with a platoon formation of “1 + n + 1 + m + 1” is designed to study the influence of different-length platoon formations. When N = 6, the platoon contains three HDVs. Comparing Table 4 (N = 6) and Table 5 (N = 6), when the permeability is constant, the higher the concentration of tail CAVs, the more conducive to platoon stability. Comparing the two platoons of N = 6 in Table 5, when there is a continuous HDV disturbance factor in the head of the platoon, the digestion effect of CAV in the platoon will be weakened, and the higher the speed of the platoon, the worse the effect. This means that the fluctuation increases with backward propagation, and the number of CAVs required to eliminate the disturbance increases. When the platoon length is 7 (a combination of two minimum units with N = 4), the platoon can only form a stable platoon at low speed, and the increase in the overall length of the platoon has a significant negative impact.
| Vehicle number | Vehicle ID | Average (m/s) | Standard deviation (m/s) | ||||
|---|---|---|---|---|---|---|---|
| 10 | 20 | 30 | 10 | 20 | 30 | ||
|
1 | 10 | 20 | 30 | 0 | 0 | 0 |
| 2 | 10.0053 | 20.0101 | 30.0018 | 0.0915 | 0.1606 | 0.1484 | |
| 3 | 9.9999 | 20.0107 | 30.0027 | 0.0393 | 0.0839 | 0.0754 | |
| 4 | 9.9926 | 20.0017 | 30.0088 | 0.0755 | 0.1540 | 0.1806 | |
| 5 | 9.9920 | 20.0131 | 29.9994 | 0.1038 | 0.2132 | 0.2046 | |
| 6 | 9.9876 | 19.9889 | 29.9844 | 0.0524 | 0.1293 | 0.1310 | |
|
1 | 10 | 20 | 30 | 0 | 0 | 0 |
| 2 | 10.0012 | 20.0014 | 30.0018 | 0.0892 | 0.1482 | 0.1324 | |
| 3 | 10.0081 | 20.0079 | 30.0227 | 0.1402 | 0.1802 | 0.2107 | |
| 4 | 10.0053 | 20.0048 | 30.0067 | 0.0873 | 0.1054 | 0.1403 | |
| 5 | 10.0022 | 19.9934 | 29.9967 | 0.1093 | 0.1707 | 0.2143 | |
| 6 | 10.0013 | 20.0058 | 29.9765 | 0.0674 | 0.1007 | 0.1396 | |
|
1 | 10 | 20 | 30 | 0 | 0 | 0 |
| 2 | 10.0007 | 20.0103 | 29.9869 | 0.0734 | 0.1039 | 0.1343 | |
| 3 | 10.0073 | 20.0209 | 30.0032 | 0.1087 | 0.1769 | 0.2076 | |
| 4 | 9.9999 | 20.0075 | 30.0086 | 0.0512 | 0.0992 | 0.1202 | |
| 5 | 10.0034 | 20.0013 | 30.0147 | 0.0943 | 0.1590 | 0.2118 | |
| 6 | 10.0012 | 19.9914 | 30.0168 | 0.1040 | 0.1802 | 0.3115 | |
| 7 | 9.9987 | 19.9976 | 30.0064 | 0.0607 | 0.1097 | 0.2211 | |
6. Conclusion
This paper provides a mixed traffic model and analyzes the characteristics of mixed traffic flow in different platoon forms. Firstly, the randomness existing in the perception behavior of human drivers was analyzed. Then, the normal distribution was utilized to describe this randomness, and a vehicle platoon car-following model was established. Through the numerical analysis of the mixed vehicle platoon, the following conclusions are obtained: (1) The driver’s perception error will cause a specific steady-state error in the platoon, but it will not affect the stability of the vehicle platoon; (2) The grouping form of the mixed platoon has an essential influence on the convergence of the vehicle disturbance. The grouping form with CAV at the tail can help the platoon obtain a better, stable state faster. It is considered that the “1 + n + 1” platoon form can be selected as the minimum grouping unit. (3) When the platoon is the minimum grouping unit, the length is 4, and the number of HDVs is 2, it can converge quickly and maintain its stable state in different traffic flow scenarios to achieve the optimal platoon. (4) When the vehicles are arranged in a combination of two grouping units, the optimal platoon length is 6. Therefore, the optimal grouping unit will be shortened when the platoon combination is more complex.
Conflicts of Interest
The authors declare no conflicts of interest.
Author Contributions
Conceptualization, B.R. and Y.R.; methodology, J.J. and Y.R.; software, J.J.; validation, Y.R. and B.R.; formal analysis, J.J., Y.R., and B.R.; resources, J.J. and Y.R.; data curation, J.J.; investigation, J.J.; writing – original draft preparation, J.J. and Y.R.; writing – review and editing, J.J.; visualization, J.J.; supervision, Y.R. and B.R.; project administration, Y.R.; funding acquisition, Y.R. All authors have read and agreed to the published version of the manuscript.
Funding
This research was funded by the National Natural Science Foundation of China (grant no. 41971342).
Open Research
Data Availability Statement
Data are available on request from the authors.


