Key Perception Technologies for Intelligent Docking in Autonomous Modular Buses
Abstract
Autonomous modular buses (AMBs) constitute a novel form of public transportation, enabling real-time adjustments of module configurations and facilitating passenger exchanges in transit. This approach resolves unpleasant transfer experiences and offers a potential solution to traffic congestion. However, while most existing research concentrates on logistical operations, the technical implementation of AMBs remains underexplored. This paper fills this gap by proposing key perception technologies for the docking process of AMBs, which presents a suite of sensors and segments the docking process into four stages. A late fusion-based perception network, featuring event-driven and periodic modules, is introduced to optimize perception by integrating multisource data. Plus, we suggest a “mutual view and coview” strategy to enhance perception accuracy in the unique scenario of docking. Experimental results demonstrate that our method achieves a substantial reduction of errors in x and y axes, as well as the heading angle compared with other state-of-the-art perception methods. Our research lays the groundwork for advancements in the precise docking of AMBs, offering promising tactics for other intelligent vehicle applications.
1. Introduction
Urban transit systems, while essential for daily commutes, face significant challenges that obstruct their efficacy. Existing studies highlight that conventional transit systems inherently struggle to meet real-time and dynamic demands, often lead to unpleasant transfer experiences, and demonstrate vulnerability to adverse weather conditions [1]. Indeed, various strategies have been explored to address these problems, including the flexible bus system, customized buses, and autonomous modular buses (AMBs) [2–4]. Of these cutting-edge concepts, AMB has garnered considerable attention recently, offering the potential to enhance flexibility in scheduling and operations while reducing substantial driver labor costs and mitigating congestion [5, 6].
The fundamental mechanism of AMB systems involves the dynamic coupling and decoupling of vehicles during transit and adjusting the number of bus modules based on passenger demand [7]. When passengers onboard need to travel in different directions at an intersection, a transfer is required. For instance, as illustrated in Figure 1, if passengers in bus A and bus B need to go straight and turn left at the next intersection, respectively, bus B will follow and then dock with bus A at point S. During this connected state (the transferable area between S and E), passengers needing to go straight board bus A and those needing to turn left board bus B. Once the transfers are complete, A and B will decouple at E, operating independently along their respective routes to transport passengers to their destinations [8].

To this end, modular buses present several primary advantages: they enable optimized ridership distribution and utilization of available capacity through in-motion transfers, allow passengers to follow the shortest path without disembarking, and uphold the fundamental characteristic of public transit by serving passengers with varying destinations [9, 10]. Nevertheless, much of the existing research remains in the theoretical stage, with a focus on logistical operations and contributions to traffic efficiency and energy conservation [11]. Yet, the practical development of AMBs presents numerous challenges, including precision during docking, the uncertainty and dynamism of target locations in planning, and control considerations like power distribution once connected. Limited practical attempts, such as the efforts by NEXT Generation Company, the United Arab Emirates, Sweden, and China, have largely relied on manual control, leaving significant room for advancements in autonomous docking [12]. With the seamless, quick, and smooth docking process being the key technical support to ensure the efficient operation of AMBs, only by ensuring the safety, comfort, and ample transfer time for passengers can the full potential of this concept be realized.
- 1.
We propose a multisensor collaborative layout scheme that divides the docking process into four stages, with each stage adopting a tailored perception strategy.
- 2.
We introduce a fusion perception network and elaborate on its core modules, which enable effective multisource data fusion.
- 3.
We advance a “mutual view and coview” strategy that enhances perception accuracy throughout the entire docking process of AMBs.
2. Related Works
In autonomous vehicle (AV) perception systems, the accuracy and real-time nature of sensor data are vital to the reliability and safety of the vehicle [13–15]. Current sensors that facilitate perception and positioning in AVs primarily include the LiDAR, camera, and radar. LiDAR-based positioning, which matches 3D point cloud maps with LiDAR data to compute vehicle location in the map, is known for its high accuracy and stability and can effectively handle various road and weather conditions [16, 17]. For instance, Veronese et al. [18] developed a positioning method based on the Monte Carlo localization (MCL) algorithm, which evaluated two types of map-matching distance functions and achieved lateral and longitudinal errors of 0.13 m and 0.26 m, respectively. Meanwhile, camera-based positioning primarily relies on image data. Specifically, Brubaker et al. [19] introduced a method based on visual range and road maps using OpenStreetMap to create a probability model that accurately locates the vehicle in graphics. Spangenberg et al. [20] suggested using pole-like landmarks as primary features, combining the MCL algorithm with a Kalman filter for robustness and sensor fusion and achieving lateral and longitudinal position estimation errors between 0.14 and 0.19 m.
To enhance the accuracy, many researchers opt for fusion perception based on LiDAR and cameras [21]. This approach establishes a map with LiDAR data and uses camera data to estimate the vehicle’s relative position. As exemplified, Xu et al. [22] introduced a positioning strategy that aligns stereo images with 3D point cloud maps using the MCL algorithm, estimating vehicle location by matching depth and intensity images from car cameras with those extracted from 3D point cloud maps. This method, when evaluated on real data, yielded position estimation errors between 0.08 and 0.25 m.
While most of the aforementioned methods utilize static objects as references, there are also initiatives aimed at integrating perception data from multiple moving vehicles, utilizing occupancy grids [23] or raw point clouds [24]. These efforts have proven effective but predominantly under low-speed or low-latency conditions. When it comes to high-speed scenarios, these approaches falter due to their inability to maintain a representation of individual vehicles and a lack of velocity information. These limitations consequently complicate the process in the context of communication latency.
Existing perception accuracy methods are diverse, yet they typically exhibit errors at the decimeter level, with many failing to consider angular inaccuracies [25]. While this level of accuracy is sufficient for most autonomous driving scenarios, the docking process of AMBs necessitates centimeter-level accuracy in both lateral and longitudinal positions, as well as high angular accuracy. Excessive perception errors may result in rough docking with significant impact force or even unsuccessful docking attempts. This not only shortens the vehicle’s lifespan but also impairs passenger comfort and safety. Therefore, it is essential to provide a high-accuracy perception solution that minimizes positional and angular errors, ensuring precise docking of modular vehicles.
3. Intelligent Docking Scheme
To achieve precise docking and minimize perception and positioning errors, we employ multiple sensors, each strategically installed. Leveraging the unique characteristics of each sensor, we segment the docking process based on the approximate distance to the preceding vehicle, thereby ensuring a suitable high-accuracy perception strategy is in place at each stage.
3.1. Sensor Suites
In consideration of our docking process, where the final distance between the two vehicles approaches zero and a high level of accuracy is needed, different sensor solutions are required for different distances due to the inherent characteristics of each sensor. The approach we present is general and can be applied regardless of the types of sensors on each vehicle. Since our purpose is the intelligent docking of two AMBs, the sensor suites of an AMB are shown in Figure 2.
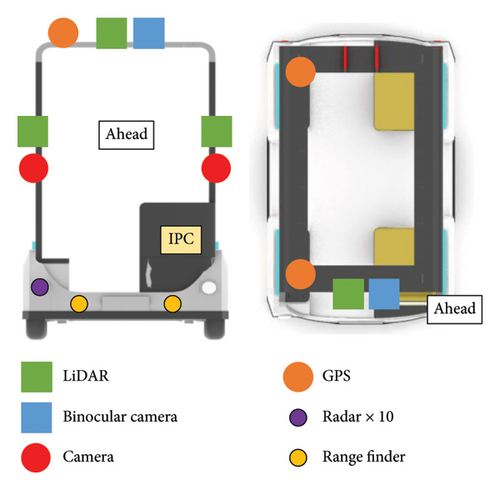
Specifically, a 32-line LiDAR and a binocular camera are installed in the middle of the vehicle’s roof. They provide high-resolution, 3D measurements of the surrounding environment, which are particularly useful for object detection and distance measurement at mid to long ranges. Moreover, a combined navigation antenna is installed on the right side of the vehicle’s roof, which enhances GPS signal reception and accuracy, crucial for high-precision localization. Furthermore, 16-line LiDARs are mounted on the sides of the front pillars, while two surround-view cameras are installed below the LiDAR bracket at the front [26]. They provide a panoramic view of the vehicle’s surroundings and a more comprehensive detection range. Plus, ten ultrasonic radars are installed around the vehicle while two rangefinders are installed at the bottom of the front side. These sensors are particularly effective for short-distance detection, making them useful during the final stages of docking.
3.2. Segmented Docking Procedure
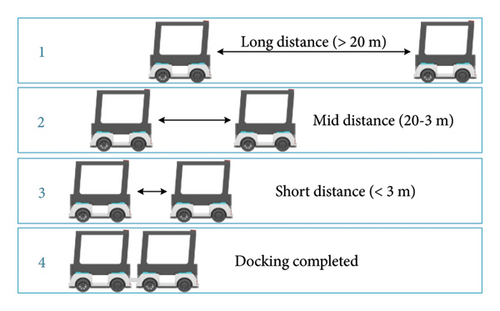
Our docking process is broken down into four stages based on the longitudinal distance (D) from the preceding vehicle. The specific distance thresholds (e.g., 20, 3 m) are determined based on the characteristics of onboard sensors and validated through experimental results. This structured methodology ensures the optimal utilization of each sensor and facilitates high-accuracy perception at all stages, as depicted in Figure 3.
- •
Stage 1 (long distance, D > 20 m): the following vehicle combines the localization information of the preceding vehicle, relayed via vehicle-to-vehicle (V2V) communication, with the perception data from vision and LiDAR systems. This sensor fusion approach facilitates lateral and longitudinal positioning of the preceding vehicle with an accuracy of less than 10 cm, proportional to the distance between the vehicles.
- •
Stage 2 (mid distance, 3 < D < 20 m): based on the first stage, the following vehicle supplements its perception capabilities with a purely vision-based estimation of the preceding vehicle’s position using the camera. This aids in achieving a refined lateral and longitudinal positioning accuracy of the preceding vehicle to within a 5 cm error range. This stage persists until the binocular camera’s longitudinal recognition capabilities reach the threshold.
- •
Stage 3 (short distance, 0 < D < 3 m): in this stage, the following vehicle expands upon its existing sensor fusion strategy by adding a purely vision-based detection and position estimation of the target light on the rear top of the preceding vehicle. In addition, the rangefinder is employed for precise distance measurement. This robust combination enables the vehicle to maintain a lateral and longitudinal positioning accuracy of the preceding vehicle within a 3 cm error range.
- •
Stage 4 (docking completed): upon successful docking, the following vehicle gradually reduces its torque, while the preceding vehicle reciprocates by incrementally increasing its torque. This mutual adjustment ensures a smooth transition of power, marking the completion of the docking procedure.
4. Fusion Perception Architecture
Upon establishing our perception process, it is crucial to determine the appropriate perception network architecture. Generally, data fusion methods can be categorized into early (data level) fusion, intermediate (feature level) fusion, and late (decision level) fusion [27]. Feature-level fusion methods like Bayesian models or clustering models lose precision when faced with multiple similar sensors or homogeneous detection targets. In contrast, decision-level fusion, the most advanced stage, integrates all perception information in depth, boasting low cost and high stability. However, it struggles with large communication latencies from multiple perception units and significant computational load during multitarget fusion [28]. In response to these issues, we proposed a late fusion-based perception network architecture. By blending event-driven and periodic modules, we can effectively tackle the aforementioned problems and satisfy the requirements of intelligent docking.
4.1. Fusion Network
Our fusion network is based on late fusion and is primarily divided into five modules, including Calibration, Input Adapter, Target Estimation, Ego Location, and Fusion Filter. The perception process unfolds as follows: first, sensors such as LiDAR, cameras, and RTK are calibrated and their data are transformed for input to the Input Adapter. During the perception process, the Input Adapter receives data from multiple sensors. Each set of data undergoes processing by a specifically designed preprocessor, and the processed data are then relayed to the corresponding Target Estimator. After further processing, these data are transferred to the Receive Data section of the Fusion Filter. The primary role of the Fusion Filter is to carry out late fusion on the processed information from different sensors, resulting in the final perception output. V2V communication, on the other hand, delivers real-time parameters and state information about the preceding vehicle directly to the final perception output for reference. The detailed architecture of our fusion network is depicted in Figure 4. Here, the purple modules are event driven, while the red module operates periodically.
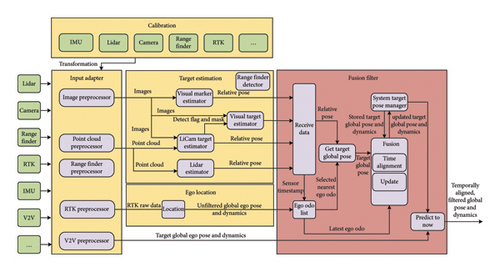
Specifically, several key modules that play crucial roles need further explanation. First, the Ego Location processes RTK signals as inputs and delivers AMB’s position and pose as outputs. Following this, the Visual Marker Estimator and Visual Target Estimator, which take binocular target images as inputs, compute the pose of the midpoint of the rear crossbeam as the output. Next, the LiCam Target Estimator takes point clouds and images as inputs to detect whether the vehicle intended for docking is present. It also outputs the pose of the midpoint of the rear crossbeam. This module ensures that in situations where the training set is limited, other vehicles or objects are not identified as the target and also guarantee an average processing time of no more than 50 ms and a maximum time of 75 ms. Lastly, the Fusion Filter engages in two significant tasks: tracking itself and the vehicle intended for docking. In terms of self-tracking, it takes the absolute global pose and dynamics of itself, timestamped with t2, as inputs. It then produces the absolute global pose and dynamics of itself, timestamped with t3, as outputs. For the tracking of the docking vehicle, it considers a multitude of inputs, including the relative poses computed by mono and stereo vision, the pose calculated by laser-camera fusion, the timestamped absolute global pose and dynamics of our vehicle, and the delayed absolute global pose and dynamics of the preceding vehicle passed on via V2V communication. Based on these inputs, it outputs the timestamped absolute global poses and dynamics of both itself and the preceding vehicle. This module also manages the absolute pose of the target, converting the target’s relative pose into an absolute pose based on the distance and direction.
4.2. High Precision Sensing Approaches
Our proposed schemes predominantly focus on the scenario where the following vehicle perceives the leading vehicle, which generally satisfies the practical requirements for precise docking in AMBs. However, further improvements in perception accuracy can lead to smoother and safer docking processes. To enhance the spatial alignment and fusion of multisource observations, our framework first converts the relative pose of each perception unit to a unified vehicle-centric coordinate frame using extrinsic calibration parameters. The vehicle’s ego pose, obtained through GPS-RTK or LiDAR odometry, is then applied to transform all observations into the global frame via a chain of homogeneous transformations. This mechanism ensures accurate spatial registration, which is critical for subsequent multiagent fusion. Moreover, existing cooperative SLAM techniques often exploit visual place recognition (VPR) in overlapping regions to establish data associations and impose relative pose constraints between vehicles, thereby further improving cooperative localization accuracy [29]. Among the existing methods for AMB perception, AEFusion achieves the highest accuracy [30], and its foundational framework has, therefore, served as a reference in our work. However, it is crucial to emphasize that our docking scenario differs significantly from typical autonomous driving contexts, as both vehicles involved can act as mutual references and provide complementary information supplements [31]. Furthermore, concerns such as heterogeneous vehicle types or data privacy are nonexistent in our case. Therefore, we can enhance perception accuracy via a “mutual view and coview” (M&C) approach in the fusion network.
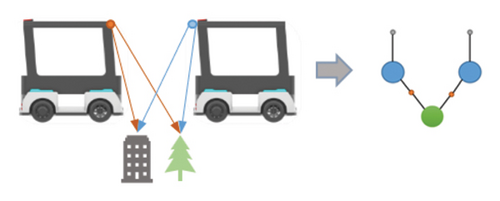
Mutual view can be understood as the two vehicles observing each other, which adds the data from the preceding vehicle perceiving the following one to jointly estimate the AMB’s location, as shown in Figure 5(a). Coview refers to both vehicles observing the same object simultaneously. The results of both vehicles perceiving the same object in the environment are merged and serve as the AMB’s final output for perceiving that object, as illustrated in Figure 5(b). Since the concept of model fusion, such as ensemble learning in machine learning, enhances model performance, and even simple averaging from multiple models or data sources can improve accuracy, our “mutual view and coview” approach has the potential to boost perception and positioning accuracy, thereby ensuring precise docking.

5. Experiments
5.1. Data Collection
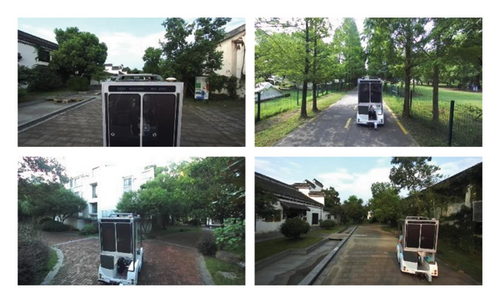
Due to the absence of publicly available datasets like nuScenes [32] specifically designed for AMB, we constructed two 1:2 scale experimental AMBs for data collection. Each vehicle was equipped with a 32-line RoboSense Helios-5515 LiDAR and a ZED-2i binocular camera. Data collection was conducted in various park environments in Jiaxing, China, as depicted in Figure 6. The dataset consists of 29 different types of scenarios, totaling 22,162 frames at varying distances. These scenarios were deliberately selected to represent a board range of real-world conditions and challenges commonly encountered in autonomous driving tasks. To ensure accurate ground-truth reference for subsequent error analysis, we utilized high-precision GPS positioning combined with manual labeling, achieving a localization accuracy within 1 cm.
5.2. Metrics
The collected dataset with 22,162 frames is partitioned into training, validation, and testing sets containing 15,540, 4832, and 1790 frames, respectively. To demonstrate the effectiveness of our proposed method for AMB in-motion docking, we compare our approach with several prominent models including PointPillars, CenterPoint, BEVFusion, and AEFusion. All models are evaluated using the previously mentioned metrics. Each experiment is conducted over 40 epochs under identical hyperparameter configurations and training conditions. The quantitative results for MAE, SD, and zero bias of each model are presented in Table 1, while the CEP metrics are reported in Table 2.
| Model | MAE-x (m) | SD-x (m) | Bias-x (m) | MAE-y (m) | SD-y (m) | Bias-y (m) | MAE-h (°) | SD-h (°) | Bias-h (°) |
|---|---|---|---|---|---|---|---|---|---|
| PointPillars | 0.031 | 0.041 | 0.011 | 0.047 | 0.064 | 0.021 | 1.147 | 1.348 | 0.620 |
| CenterPoint | 0.031 | 0.038 | 0.008 | 0.036 | 0.045 | 0.008 | 1.086 | 1.367 | 0.057 |
| BEVFusion | 0.034 | 0.038 | 0.011 | 0.047 | 0.049 | 0.018 | 1.092 | 1.266 | 0.430 |
| AEFusion | 0.023 | 0.029 | 0.007 | 0.036 | 0.048 | 0.005 | 0.850 | 0.994 | 0.033 |
| Ours (M&C) | 0.018 | 0.025 | 0.006 | 0.018 | 0.022 | 0.008 | 0.807 | 0.594 | 0.038 |
- Note: Bold values indicate the best values.
| Model | CEP68-x (m) | CEP68- y (m) | CEP68-h (°) | CEP95-x (m) | CEP95-y (m) | CEP95-h (°) |
|---|---|---|---|---|---|---|
| PointPillars | 0.138 | 0.146 | 1.557 | 0.168 | 0.196 | 3.339 |
| CenterPoint | 0.138 | 0.136 | 1.338 | 0.170 | 0.172 | 2.691 |
| BEVFusion | 0.115 | 0.122 | 1.133 | 0.188 | 0.190 | 2.468 |
| AEFusion | 0.106 | 0.099 | 1.117 | 0.134 | 0.156 | 2.195 |
| Ours (M&C) | 0.021 | 0.022 | 0.957 | 0.052 | 0.046 | 1.752 |
- Note: Bold values indicate the best values.
5.3. Results Analysis
As a result, the data presented in the tables indicate that our proposed approach, which leverages the M&C strategy, consistently exhibits the highest perceptual accuracy in our test sets, surpassing the high-precision LiDAR-only setups and other LiDAR-camera fusion approaches. Specifically, as shown in Table 1, our model achieves a mean error of only 0.018 m along the x-axis, which represents a 41.9% reduction compared with the AEFusion (0.023 cm) and over 47% lower than other methods whose average errors are greater than 0.03 m. This reduction significantly minimizes the impact caused by distance perception errors during docking. On the y-axis, the mean error has also been reduced to 0.018 m, outperforming other methods by margins exceeding 50%. Moreover, the perception error for the preceding vehicle’s heading angle has been reduced to below 0.85° for the first time, which is critical for maintaining directional stability during docking. Excessive docking angles can lead to deviations in the driving directions of the vehicles, potentially resulting in safety incidents. Furthermore, our method demonstrates superior consistency and robustness, as reflected in lower SD and bias across all dimensions. The SD in heading angle is reduced to 0.594°, with a decrease of 40.2% compared with AEFusion. Meanwhile, the zero bias remains close to 0.006 m in x and 0.008 m in y, indicating negligible systematic error. However, it is noteworthy that the heading bias (bias-h) is relatively higher compared with other models. This can be attributed to directional asymmetries introduced by the M&C strategy, as well as potential temporal misalignments between sensor modalities. Future work will explore adaptive angle correction and temporal synchronization to further mitigate this bias. Furthermore, the CEP68 values and CEP95 values for our model are significantly lower than those of the competing models, indicating that our method maintains a high level of precision in predicting both position and heading. These results highlight the effectiveness of the M&C strategy in improving spatial accuracy during AMB docking.
6. Limitations and Conclusions
This paper proposes key perception technologies for intelligent docking in AMBs. A multisensor collaborative layout scheme is designed to leverage the strengths of individual sensors, dividing the docking process into four stages with tailored high-precision perception strategies. Based on this foundation, we introduce a fusion perception network that integrates both event driven and periodic modules, enabling efficient late fusion of multisource data. In addition, we propose a “mutual view and coview” strategy, specifically optimized for intelligent docking scenarios, to enhance spatial accuracy—improving longitudinal, lateral, and angular perception. Experimental results demonstrate that our method reduces the MAE on the x- and y-axes by over 40% compared with AEFusion and achieves a heading angle MAE of just 0.807°.
However, several limitations remain. First, communication latency between modules is not yet modeled, which may affect real-time performance. Second, the current approach does not address perception failure or sensor dropout scenarios. Third, although ground truth is obtained with high-precision GPS and manual annotation, small errors may still exist. Lastly, the tested scenarios are relatively limited in diversity. Future work will explore delay-aware fusion strategies, enhance ground-truth accuracy using infrastructure-based localization, and incorporate scenario generation techniques to improve environmental diversity. Despite these limitations, our research lays a solid foundation for future advances in precise and intelligent docking of AMBs and other AVs, offering effective strategies and innovative perception solutions.
Conflicts of Interest
The authors declare no conflicts of interest.
Funding
This research was funded in part by the National Key Research and Development Program of China under Grant no. 2023YFB4301800.
Acknowledgments
This research was funded in part by National Key Research and Development Program of China under Grant 2023YFB4301800.
Open Research
Data Availability Statement
The data that support the findings of this study are available from the corresponding author upon reasonable request.


