Assessing the Spatial Sustainability of Urban Bus Transit: A Socioeconomic Sustainability Perspective
Abstract
To promote the sustainable development of urban bus transit, this paper introduces the concept of spatial sustainability for bus networks. This concept aims to achieve a balance in the spatial distribution of bus routes, optimizing both social and economic benefits. The paper presented a novel approach that utilizes multisource big data to assess the spatial sustainability of bus transit, with a specific focus on the existing transit-supportive area (TSA) method. In this study, we employed various data sources, including mobile phone signaling data, residential travel survey data, map API data, and bus credit card data. These datasets were used to identify regions where peak-hour ridership exceeded a defined threshold. Using Nanjing as a case study, we defined the bus sustainable development zone (BSDZ) by evaluating areas where peak-hour bus ridership exceeded 10 trips per grid. The study then compared the BSDZ with both the bus support zone and the bus stop service zone. In addition, we conducted a comparative analysis between the BSDZ and TSA, as well as the existing bus service areas. The findings revealed a spatial imbalance in the current bus network and highlighted areas where optimization was needed. The identified BSDZs offered valuable insights that can serve as a reference for future bus route optimization in Nanjing, contributing to a more balanced and efficient transit system.
1. Introduction
The sustainable development of public transportation plays a pivotal role in attaining sustainable transportation. The achievement of sustainable transportation is a multifaceted undertaking that necessitates the harmonization of diverse systems. At the urban level, the attainment of sustainable transportation is contingent upon the establishment of a city transportation system that primarily relies on sustainable modes of transportation. Public transit, regarded as a sustainable mode of transportation, possesses the capacity to mitigate land consumption and carbon emissions [1]. In addition, it offers affordable travel options for the public to access specific locations within a city [2].
The primary objective of public transportation is to facilitate the movement of the general populace within urban areas, as well as to designated locations within the city. The efficiency of public transportation relies on the ability to transport a significant number of individuals and achieve economies of scale [3]. Bus routes encompass both “cold lines” characterized by low passenger traffic and potential financial losses, as well as “hot lines” that experience high passenger traffic and generate substantial revenue. Public transportation prioritizes public welfare over economic benefits. In order to promote equity in public transportation and cater to regions with lower population densities, governmental bodies offer subsidies. Public transportation plays a crucial role as a public service, ensuring equitable transportation for passengers and enhancing accessibility for marginalized populations. In recent years, there has been a consistent decrease in passenger volume and consistently high vacancy rates in bus transit. This has resulted in the financial insolvency of bus companies in certain cities in China. Exploring the equilibrium between public welfare and the economic sustainability of bus transit is of paramount importance, with the aim of fostering its long-term development.
Previous research has predominantly focused on assessing the spatial dimensions of urban public transportation systems, specifically in terms of their size and service level. However, the findings of these studies do not have a direct impact on the overall accessibility and quality of life for society as a whole. In addition, they do not offer specific recommendations for the sustainable development of bus transit [4–7]. For instance, the study conducted by Thorpe et al. [8] and Rudke et al. [9] examined the correlation between the spatial distribution of urban populations and the effectiveness of public transit networks in meeting the demands of the population. While the authors have acknowledged the positive social impacts of public transit, they have failed to address the economic challenges that arise from its operation.
This study seeks to evaluate the spatial sustainability of the bus network from a socioeconomic standpoint and determine the bus sustainable development zone (BSDZ) through the utilization of mobile phone signaling data, residential travel surveys, and other pertinent data sources. After conducting a comprehensive review of the relevant literature in Section 2, and presenting a detailed description of the data and methodology employed in Sections 3 and 4, this research paper proceeds to compare the BSDZ with transit-supportive area (TSA) and other existing bus service areas in Section 5. Additional discussion and conclusions can be found in Section 6.
2. Literature Review
Literature related to this topic was conducted including spatial sustainability of buses from a socioeconomic perspective and the goals of public transit sustainable development. For further analysis, the threshold of BSDZ based on the TSA was also discussed in the end, which is helpful for understanding the quantitative analysis method given in this paper.
2.1. The Concept of the Spatial Sustainability of Buses From a Socioeconomic Perspective
Sustainability and sustainable development have emerged as significant topics of discussion since the 1970s, as evidenced by the works of Keeble [10] and the United Nations [11]. According to several studies, the concept of sustainability is commonly acknowledged to encompass three dimensions: environment, economy, and society, also referred to as the “triple bottom line” [11–15]. The concept of spatial sustainability was initially introduced by Nijkamp et al. [16], who argues that it involves the balanced coexistence of ecological and socioeconomic development within a spatial context. The concept discussed in this context has garnered minimal scholarly interest within the realms of environmental and ecological economics. The idea of spatial sustainability has been introduced in urban literature through a range of regional studies. These studies have undertaken investigations into the spatial distribution of economic and related activities, examined the concept of the ecological footprint of cities, analyzed the fundamental spatial structure of cities and their street networks, and explored geographies of sustainability transition from an economic geography perspective [17–21]. Taking into account the socioeconomic duality of public transport operations, we have defined the spatial sustainability of a bus network as the process of developing a bus system that achieves a balance between social and economic benefits. The aforementioned considerations encompass factors related to the spatial distribution of bus routes and services.
2.2. The Goals of Public Transit Sustainable Development
In the social dimension, the literature consistently identifies three objectives of sustainable public transport: (1) social progress, (2) equity, and (3) justice [22, 23]. The equity and justice of public transport are manifested through the spatial allocation of bus routes and services. Social exclusion resulting from irrational spatial allocation is a significant factor contributing to the marginalized status of vulnerable groups in economic, social, and civic spheres. Vulnerable populations face barriers that hinder their inclusion in the economic, political, and social aspects of society. These barriers stem from limited access to opportunities, services, and social networks, which can be attributed to the inadequate mobility within a society and environment that is designed with the assumption of high mobility [24–27]. With the advancement of computer technology and the utilization of big data analysis, the measurement of accessibility and equity in public transportation has become increasingly feasible. This is achieved through the examination of objective and quantifiable factors, including potential demand, supply (both in terms of quantity and quality), as well as distance (measured in terms of time and space) [23, 28–32]. However, current methodologies for indicator selection are often based on specific study topics or areas, which pose challenges in accurately capturing the true values of public transport service levels and operational efficiency. In addition, this approach makes it difficult to compare and benchmark the performance of different cities. These limitations undermine the ability to compare and apply the findings [33].
In the economic dimension, a sustainable public transport system should achieve a balance between costs and benefits. This is demonstrated by the provision of adequate funding to support ongoing operations and facilitate system expansion. In addition, the system should have the capacity to recover costs through various revenue streams, such as fares [34, 35]. However, in practical implementation, the revenue generated from fares in public transportation frequently proves insufficient to cover all expenses, necessitating the need for subsidies from the public sector [36]. Transit subsidies have the potential to improve social welfare and promote distributional equity by increasing mobility for low-income individuals. This, in turn, helps to reduce spatial barriers to employment and consumer opportunities [37–39]. Transit subsidies, however, impose additional strain on government finances. In a study conducted by Parry and Small [40], it was found that bus fare subsidies accounted for a significant portion of operating costs in 20 public transport systems in the United States, ranging from 57% to 89%. This phenomenon was defined as the “property conflict” by Campbell, which existed between the social and economic dimensions (Campbell, 1996). Existing studies have primarily focused on examining the costs and benefits associated with the subject matter. For instance, Gulcimen et al. [41] and Varabuntoonvit et al. [42] have undertaken comprehensive analyses regarding the financial implications of public transportation. These studies encompassed the assessment of capital costs, operational and maintenance costs, social security and welfare costs, as well as environmental costs. Daimis and Rebai [43] conducted a study to analyze the operational efficiency, management efficiency, and profitability of public transportation systems. The predominant focus of scholarly research has been on investigating the selection of evaluation indicators; however, a significant gap exists in establishing a correlation between these indicators and spatial considerations. The evaluation outcomes, consequently, do not possess the capacity to effectively guide the optimization of the layout of the public transportation network.
2.3. The Threshold of BSDZ Based on TSA
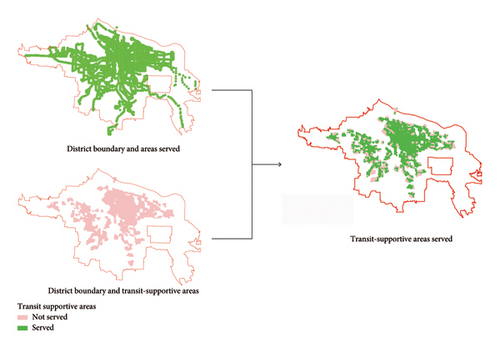
TSA is the largest area that can provide sufficient population and employment density to support hourly bus service [44]. The scope of TSA is determined by the potential bus flow, i.e., whether the job and housing density are sufficient to support transit operations [45], which can be used to measure the service level of bus transit (Figure 1 and Table 1).
| Level | Coverage ratio of TSA (%) | Description |
|---|---|---|
| A | 90.0–100.0 | Almost all major travel destinations and origins are covered |
| B | 80.0–89.9 | Most major travel destinations and origins are covered |
| C | 70.0–79.9 | Three-quarters of the high-density area is covered |
| D | 60–69.9 | Two-thirds of the high-density area is covered |
| E | 50–59.9 | At least 1/2 of the high-density area is covered |
| F | < 50.0 | Less than half of the high-density areas are covered |
As indicated in Table 2, the threshold values for TSA are currently primarily based on empirical values, and there is no universally accepted set of standards. This is due to the fact that these standards are influenced by factors such as density, funding and operational costs, local and regional policy objectives within the service area, and location. Pushkarev and Zupan [46] concluded that an employment density of about 10 jobs/ha gross density could generate the number of transit trips, and a residential density of 7.5 households/ha gross density could generate the number of transit trips that can support transit service per hour. Newman and Kenworthy [47] suggest that 30–40 persons per hectare is the bottom line for maintaining a transit-ready lifestyle. Ewing and Deanna [48] proposed a threshold value of 7 households/acre for basic public bus service and 15 households/acre for premium public bus service. The priority levels are 10 households/acre and 20 jobs/acre for areas with an employment density of 4 jobs/acre.
| Year | Author | Service type | Density |
|---|---|---|---|
| 1977 | Pushkarev and Zupan | 20 buses/day | 4 dwelling units/residential acre |
| 40 buses/day | 7 dwelling units/residential acre | ||
| 120 buses/day | 15 dwelling units/residential acre | ||
| 1989 | The Institute of Transportation Engineers | 1 bus/hour | 4–6 dwelling units/residential acre; 5–8 million sq ft of commercial/office |
| 1 bus/30 min | 7–8 dwelling units/residential acre; 8–20 million sq ft of commercial/office | ||
| 1989 | Newman and Kenworthy | 30–40 persons per acre | |
| 1996 | Ewing | Local bus (every 30 min) | Housing: 7 d.u./acre |
| Population: 5–6k people/mi2 | |||
| Commercial: 8–20 million ft2 | |||
| Frequent/express bus (every 10 min) | Housing: 15 d.u./acre | ||
| Population: 8–10k people/mi2 | |||
| Commercial: 20–50 million ft2 | |||
TSA represents an economically oriented mode for bus development by setting bus stations in areas that meet a certain population density threshold. In order to promote the sustainable development of bus transit, the setting of this threshold should take into account both the economic and social benefits. In other words, bus stations should be located in areas that can generate a minimum level of bus ridership to provide a maximum amount of bus service. On one hand, it can prevent an excessive supply of bus services, which would bring significant economic pressure. On the other hand, it ensures that bus services meet the needs of the majority of residents, improving transportation accessibility and ensuring social fairness. In this paper, we consider that the condition of spatial sustainability of bus transit is that each bus trip has an on and off passenger flow at each stop, i.e., 1 trip. The area that satisfies this condition is BSDZ.
3. Study Area and Data
3.1. Study Area
Nanjing is an important central city in the eastern region, the only megacity in the Yangtze River Delta City clustered with a population of 10.6 million in Nanjing, and one of the first transit metropolises in China. This paper takes the Nanjing metropolitan area as the study area (Figure 2), including Xuanwu, Qinhuai, Jianye, Gulou, Pukou, Qixia, Yuhuatai, all of Jiangning District and most of the Lihe District, as well as the Tuotang area in Lishui District, with a total area of 4388 km2. Due to the continuous decline in passenger traffic and further expansion of losses of public transport enterprises, the city enacted a series of reform measures in 2017 to promote sustainable public transport development by balancing public welfare and corporate efficiency, including specific measures to reform the subsidy method and optimize bus routes. Therefore, it is crucial to evaluate Nanjing’s bus network from a socioeconomic perspective to promote sustainable public transportation development.

3.2. Data
The main data for the study consisted of four parts: Mobile phone signaling data, actual travel distance data, residential travel survey data, and public transportation IC card data.
The mobile phone signaling data for this study were collected by China Unicom operators in June 2019, and the accuracy of the study is 500 m grid. Mobile phone signaling data can record information such as the occurrence time of a series of interactions between users’ mobile phone signals and base stations, and the location data of base stations, which has the characteristics of wide coverage, large sample size, and strong dynamics. Compared to traditional population and economic census data, mobile phone signaling data can not only obtain the spatial population and job numbers but also further analyze the connection between residents’ residence and workplace.
The actual travel distance is obtained based on the Gaode Map open-source data platform. The grid center points are first extracted as travel OD points, and then the inter-OD path planning data are crawled according to the Gaode Map API interface, including crawl status, distance (m), time estimation (s), and travel scheme. Since walking is closer to the actual path, this study crawls the travel distance between OD points through the walking path planning API. Some OD pairs with long distances that cannot obtain walking distances are replaced with actual travel distances by Gaudet Map minibus path distances [35].
The resident travel survey data are obtained based on local government reports. The resident travel survey data include information on residents’ travel distance, activity trajectory, travel mode, and travel time consumption. Based on the resident travel survey data, we can obtain the sharing rate of each transportation mode under different distances.
The bus IC card data can directly reflect the actual passenger flow of public transportation and can reflect the boarding points of passengers but not the alighting points of passengers.
4. Methodology
This paper aims to assess the spatial sustainability of urban bus transit, with a focus on obtaining the spatial distribution of the number of peak-hour bus ridership. It involves 3 key steps: (1) calculating the traffic volume between grids based on mobile signaling data, (2) determining the public transit share between grids based on resident travel survey data and actual travel distances, and (3) calculating the corrected peak-hour bus ridership in each grid by multisource data.
4.1. Calculation of the Inner-Grid Traffic Volume Based on Mobile Signaling Data
In this paper, mobile phone signaling data were used to identify OD pairs. First, the starting point (OD) distribution is identified according to the given rules of workplace identification. This paper determines the OD based on the following rules: (1) 9:00–11:00 and 14:00–16:30. The base station with an average daily stay of more than 2 hours, which is identified as the working place of the mobile phone users whose activity range is fixed within 400 m during the day and night, is excluded. The location of the final identified base station is considered to be the working place of the mobile phone user. (2) The base station with the maximum stay time between 1:00 and 7:00 and the average daily stay time greater than 4 h is identified as the residence of the base station. More details about identifying places of residence and work are summarized in our previous paper [49]. Then, the residential population, the employed population, and the intergrid OD traffic volume can be counted.
4.2. Determining Inner-Grid Bus Sharing Rate Based on Resident Travel Survey Data and Actual Travel Distances
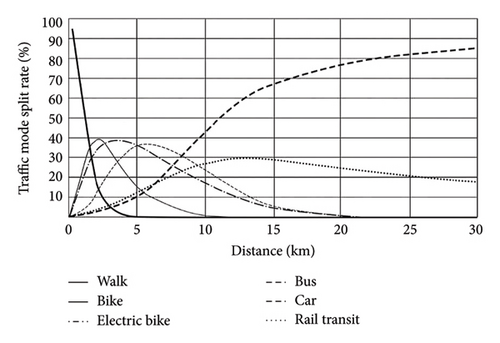
The inner-grid traffic volume obtained in Section 4.1 includes the volume of different transportation modes, such as rail transit. So, it is necessary to multiply the total traffic volume by the sharing rate of the bus to get the bus ridership.
The travel distance curve of Nanjing residents is shown in Figure 3. At a travel distance of 3–8 km, the share of buses is higher than that of nonmotorized vehicles, cars, and rail transit. When the travel distance exceeds 5 km, the sharing rate of cars and rail transportation gradually increases and competes with buses in the 5–8 km range. The share of buses reaches a peak of 36% at 8 km. In order to enhance the accuracy of the research, this paper refrained from utilizing the conventional citywide bus travel rate and instead incorporated actual travel distance data to identify the inner-grid bus sharing rate.
4.3. Calculation of the Corrected Bus Ridership Based on Multisource Data
5. Result
5.1. The Result of the BSDZ
5.1.1. Distribution Characteristics of Employment and Residence in Nanjing
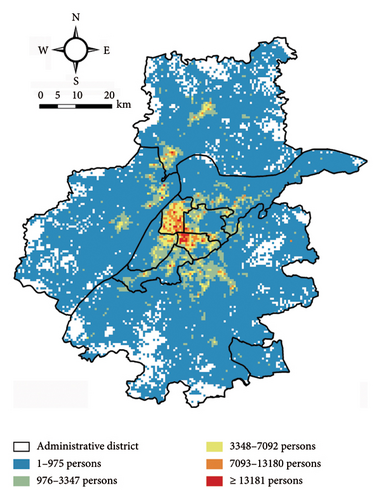
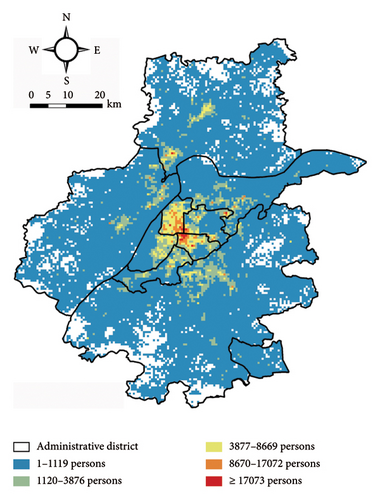
The distribution of work and residence in Nanjing is shown in Figure 4. From the spatial point of view, the grids with high residential and working population densities are basically located in the central city, forming a monocentric circle structure. The number of grids with higher working population density in the central city is more than the number of grids with higher residential population density, and the working population is mainly concentrated in the center. The residential population is relatively dispersed, forming secondary clusters in Dafang, Fenghuang Mountain Park, and Gaochun area. Jiangbei New Area forms a ribbon-like and point-like spreading residential and working area pattern. The separation of work and residence in Jiangbei New Area is more serious, and residents have longer commuting travel times. The phenomenon of tidal commuting between Jiangbei New Area and Jiangnan Main City is clearly evident. Due to the geographical separation caused by the Yangtze River between Jiangbei New Area and Jiangnan Main City, the availability of river crossings is limited. Consequently, during the morning and evening peaks, these river crossings experience significant congestion, resulting in extended commuting times.
5.1.2. Peak-Hour Bus Ridership
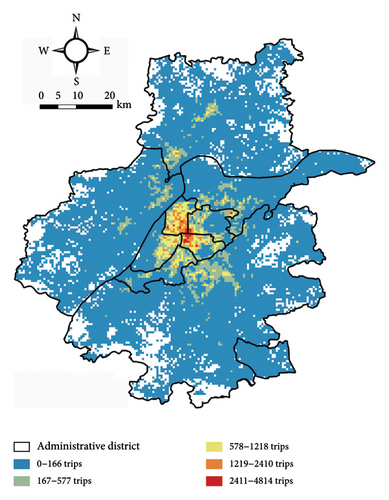
The spatial distribution of peak-hour bus ridership is illustrated in Figure 5. Overall, it exhibits a high internal and low external trend, with a higher number of ridership distributed mainly in the center. As the distance from the city center increases, the number of peak-hour bus ridership decreases, which aligns with the spatial structure of the core-periphery urban pattern in Nanjing.
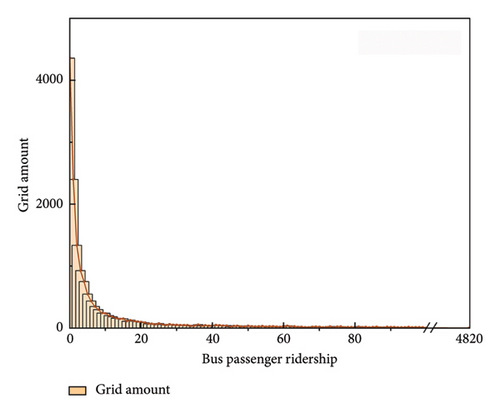
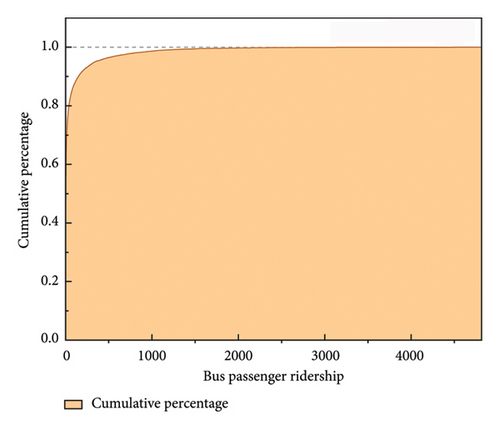
In terms of quantity (Figure 6 and Table 3), the number of peak-hour bus ridership ranged from 0 to 4814. In particular, there are a total of 4358 grids with 0 trips and only 1 grid with 4814 trips. The majority of peak-hour bus ridership fell within the range of 0–150 trips, accounting for 90% of the total. The average number of peak-hour bus ridership in Nanjing was 67 trips, but only 15.53% of the grids had more than 67 trips.
| The cumulative percentage of the study area (%) | Peak-hour bus ridership |
|---|---|
| 24.30 | 0 |
| 37.68 | 1 |
| 45.14 | 2 |
| 54.54 | 3 |
| 57.62 | 6 |
| 70.22 | 14 |
| 80.15 | 40 |
| 84.47 | 67 |
| 90.03 | 150 |
5.1.3. BSDZ
This paper argued that BSDZ should have a minimum amount of bus passenger ridership to support transit services, i.e., at least one boarding or alighting passenger per bus trip at each stop in Section 2.2. Unlike the one-hour intervals in Western cities, the interval of bus operations in Chinese cities is approximately 10–15 min. So, the number of peak-hour bus passenger ridership is approximately five persons at each bus station. Nanjing was one of the earliest transit metropolises certified by the Ministry of Transport of the People’s Republic of China. According to the requirements of the Ministry of Transport, the bus line density in Nanjing should be up to 3 km/km2, and the length of the bus line within a single grid should reach 0.75 km. The distance between bus stations is generally 300 m–500 m, and this paper selected 400 m as the average distance for calculation. Therefore, the average number of bus stations in a single grid is 1.875. In this paper, we identified the grid with peak-hour bus passenger ridership greater than or equal to 5 ∗ 1.875 ≈ 10 trips.
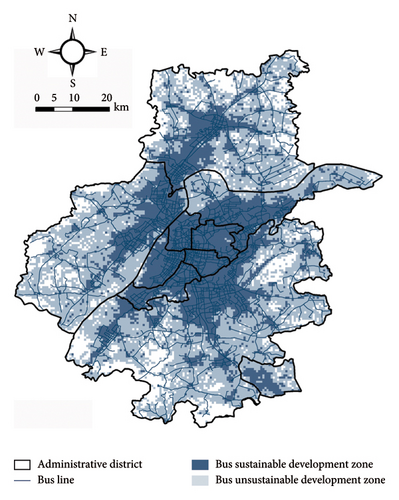
The BSDZ is depicted in Figure 7. The spatial sustainable development zones for the bus network in Nanjing encompassed approximately 35% of the metropolitan area. The spatial distribution of sustainable development zones for the bus network was primarily concentrated in the central urban area, whereas the unsustainable zones were situated on the periphery of the metropolitan area. This distribution pattern aligns with the job–housing density distribution. The Jiangnan main urban area and Xianlin and Dongshan are developed as a cluster, with a continuous piece of land. They are connected by a bus corridor that extends from north to south. On the other hand, the Jiangbei area takes the form of a ribbon, with a longer length. Its development extends to the northern side, specifically to Liuhe, where the Liuhe District sustainable development area is located in a radial pattern. Jiangbei ribbon and Jiangnan regimented area are located near the Nanjing Yangtze River Bridge, forming a connected region. The proximity of this area to both sides of the Yangtze River results in a higher volume of people traveling during peak hours. This can lead to a certain deviation in the population estimation based on the conversion of cell phone base station coverage to grid population. Some of the bus lines, such as Jiangning, Longbao, and Pukou, are primarily located outside the designated sustainable development area for conventional buses. These bus lines are specifically designed to serve remote areas.
5.2. The Overlay Analysis of BSDZ and TSA
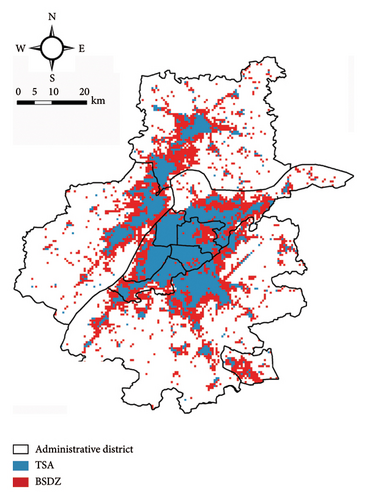
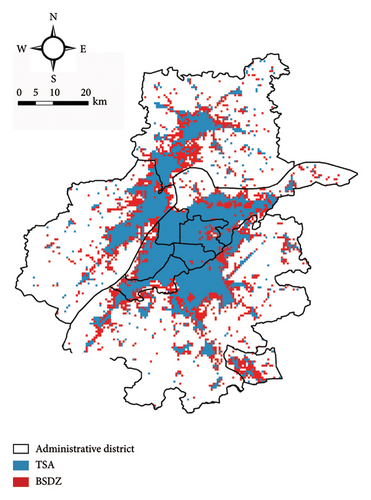
In this section, the identification of TSA in Nanjing is based on the employment density threshold of 10 jobs per hectare and the residential density threshold of 7.5 households per hectare mentioned in Section 2.2. Given that the service radius of bus stops is typically 500 m, the population data obtained from mobile signaling data in this study also have a 500 m grid accuracy. Therefore, this paper directly identifies the grids with a residential population greater than 469 and employment greater than 250.
The results are shown in Figure 8. Whether TSA is based on residential population or employment quantity, both are smaller than that of BSDZ. If TSA based on employment quantity was used as the scope of bus services, compared to using the BSDZ as the scope of bus services, 341,000 residents would be unable to enjoy bus services, and 46,000 passenger trips during peak hours would be lost. Similarly, if TSA based on residential population was used as the scope of bus services, 733,000 residents would be unable to enjoy public transportation services, and 94,000 passenger trips during peak hours would be lost.
5.3. The Overlay Analysis of BSDZ and Bus Service Area
The comparison between BSDZ and the current 500 m service area of bus stops can be used to find the problems existing in the current bus network in Nanjing. As shown in Figure 9, the BSDZ in Nanjing does not completely overlap with the current 500 m bus service area. Over 80% of the area within the BSDZ has bus services. It indicates a relatively high level of bus spatial sustainability and a wide coverage of bus service in Nanjing. However, there are some areas within the BSDZ that lack bus services, resulting in several service gaps. This indicates that the supply of bus services in Nanjing is still uneven. These areas should be the significant focus for future optimization of the bus network. In other words, when planning bus routes in the future, priority should be given to improving the bus network in these areas.
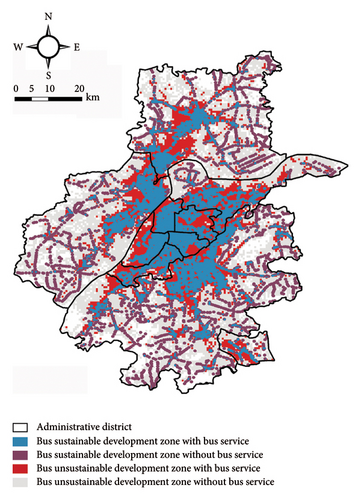
Most unsustainable development zones lack bus services, which helps reduce operating costs and improve efficiency. As for the phenomenon that some unsustainable zones have bus service, there are two explanations: one is that the pursuit of bus coverage has led to a mismatch between supply and demand, and the other is that the bus network layout considers the travel needs of residents in remote areas and does not avoid places with passenger flows below the threshold. In future optimization of the bus network, it is necessary to rigorously demonstrate the necessity of setting up bus routes and stops in these areas. Responsive buses, smart customized buses, flexible buses, or operational measures such as reducing departure intervals and increasing station spacing can be adopted to improve the operational efficiency of the bus network.
6. Discussion and Conclusion
This paper systematically analyzes the spatial sustainability of the bus network from a socioeconomic perspective. In this study, we put forward the concept of spatial sustainability in buses, which refers to achieving a balance of social and economic benefits in the spatial allocation of bus routes and services. To evaluate the spatial sustainability of the bus network, we propose a method based on multisource big data, building upon previous research on TSA. The principle of the method lies in calculating bus ridership using mobile phone signaling data, residential travel data, Gaode map route planning data, and bus IC card data. It directly reflects the passenger flow of buses and the demand for bus transit. The results provide better comparability and transferability than traditional methods, which can be used to determine the scope of sustainable development for public transit space. Furthermore, these results can guide the optimization of bus transit networks and stations. In this section, we will discuss several key findings from the empirical study conducted in Nanjing.
First, the sustainable development of bus transit should take into account both social and economic benefits, rather than solely focusing on economic interests. This article identified BSDZ and TSA. The former refers to the maximum range of bus services during peak hours, under the condition that buses are not empty. It aims to reduce unnecessary economic losses in operations and ensure that bus services reach a larger population. In contrast, TSA only considers whether the area where bus stops are located can generate sufficient passenger flow to sustain bus operations. The comparisons also indicate that there will be 340,000 to 730,000 residents unable to access bus service if TSA is used as the basis for bus services.
Second, the supply of bus services in Nanjing is still uneven and needs further improvement. The results regarding the spatial sustainability of the bus network show that BSDZ in Nanjing accounted for 35% of the metropolitan area. However, only 80% of BSDZ had bus services, indicating an unequal distribution of basic bus services in Nanjing. Transit investment should prioritize reinforcing the transit areas that are strong but have room for improvement [50], i.e., the BSDZ without bus service. For unsustainable marginal zones, i.e., zones where passenger ridership is not sufficient to support the sustainable development of bus service, paratransit, such as demand–response transit, can be used as a supplement to the public transport system. Nanjing should learn from cities such as Copenhagen, Stockholm, Singapore, and other cities to build a transit-oriented sustainable urban form and to prevent the “big pie” form.
The main contributions of this study can be summarized in three aspects. First, the proposed concept of the spatial sustainability of bus transit fills a gap in the research on spatial sustainability in the field of transportation. Second, the research is relevant to the current challenges of bus operations from a socioeconomic perspective, which is of practical significance. Finally, this study evaluated the spatial sustainability of buses by considering the peak-hour ridership trips in each grid, instead of traditional indicators such as residential or employment density. This approach can reflect the population distribution characteristics and traffic travel characteristics at the same time, enabling a more precise identification of deficiencies in the current bus network. Ultimately, this research provides a valuable reference for future optimization of urban bus networks, thereby facilitating the promotion of sustainable development in the public transportation sector.
We want to discuss a few limitations of this research. First, this paper only uses the mobile signaling data from China Unicom. On the one hand, the coverage of data samples is not comprehensive enough; on the other hand, there may be errors in the conversion of mobile signaling data into grid-based or buffer-based data. Second, the sharing rate of buses obtained from residential travel survey data just reflects an average level. So, the peak-hour bus ridership in this paper does not accurately represent the actual boarding and alighting passenger flow. In some cities in China, pilot smart buses equipped with cameras have been deployed, which can use facial recognition technology to identify passengers’ boarding and alighting points, enabling the direct acquisition of residential public transit origin–destination data. In the future, real-time data can be used to accurately identify areas for the sustainable development of buses. Third, this paper defines the concept of BSDZ from an economic and social perspective as the maximum range in which buses can operate without being empty during peak hours and compares it with TSA to examine its benefits. Although the discussion about the sustainable threshold remains insufficient, we believe that this study provides some preliminary and significant insights into the concept and assessment methods of economic and social sustainability in public transportation. This approach allows for easy data acquisition and can be readily applied to other cities, facilitating direct comparisons of results across different urban areas.
Conflicts of Interest
The authors declare no conflicts of interest.
Funding
This research was funded by the National Natural Science Foundation of China (Grant no. 52278065, 51778277).
Acknowledgments
This research was funded by the National Natural Science Foundation of China (Grant no. 52278065).
Open Research
Data Availability Statement
Research data are not shared.


