A Comparative Analysis of the Growth Performance, Morphological Indicators, and Transcriptome Between Two Coastal Regions of China in the Mud Crab (Scylla paramamosain)
Abstract
The mud crab (Scylla paramamosain), a commercially important species in China, is widely distributed along the southeastern coast. This study compares the growth performance, morphological traits, and transcriptomic profiles of two geographically distinct populations from Sanmen County, Zhejiang (SMC) and Zhangpu County, Fujian (ZPC). Juvenile crabs collected from both regions were reared in ponds under identical conditions for 7 months. Key results showed that the SMC population exhibited significantly higher daily weight gain, specific growth rate (SGR), and propodus-to-cheliped length ratio compared to ZPC (p < 0.01 for both sexes). Transcriptomic analysis revealed 44 consistently upregulated differentially expressed genes (DEGs) in SMC individuals. Among these, Otop (Otopetrin 1), Smyd (SET and MYND domain containing), AM1159 (Cancer pagurus Cuticle protein AM1159), PPAF1 (PPAR gamma coactivator 1 α), and NARG2 (NMDA receptor regulated 2) were functionally linked to molting and growth regulation in crustaceans. Notably, two mTOR pathway-associated genes (QDPR [Quinoid dihydropteridine reductase] and NLRC 3 [NLR family CARD domain containing 3]) and several energy/nutrient metabolism genes were also upregulated in SMC. Enrichment analysis identified four active KEGG pathways in SMC: “Melanogenesis,” “Riboflavin metabolism,” “Choline metabolism,” and “Ribosome biogenesis.” These findings suggest that the superior growth performance of SMC crabs may stem from enhanced molting efficiency and nutrient allocation mechanisms. While QDPR and NLRC3 are hypothesized to mediate mTOR-driven metabolic regulation, further functional validation is required to establish their causative roles. This study provides molecular markers (Otop, Smyd, etc.) for selective breeding programs and a transcriptomic framework for understanding regional adaptation in marine crustaceans.
1. Introduction
The Scylla paramamosain, commonly known as the mud crab, is an economically significant species in China, celebrated for its high nutrition value, succulent meat, short growth cycle, and good adaptability [1]. This species is predominantly found along China’s southeastern coastal regions, especially in the provinces of Zhejiang, Fujian, Guangdong, and Guangxi [2]. Beyond China, the mud crab’s range extends across the Pacific and Indian Oceans into tropical and subtropical areas, including Thailand, the Philippines, Malaysia, and Indonesia [3, 4]. As of 2023, China’s marine farming area dedicated to mud crab cultivation covered 24,809 hectares, with the largest farming regions located in Zhejiang, Fujian, and Guangdong provinces [5]. In the same year, the total output of mud crab from marine farming reached 157,012 metric tons, reflecting a 1.52% increase from the previous year, 2022 [5]. The mud crab aquaculture industry remains a crucial component of China’s aquatic supply chain.
Significant progress has been made in several areas of mud crab aquaculture, including the overwintering of parental crabs, refinement of breeding techniques, identification of critical control points in larval incubation, standardization of artificial breeding protocols, and the development of exemplary aquaculture models [6–8]. Notably, the “Dongfang No. 1” new variety, created in 2022, has demonstrated improved growth and survival rates compared to wild juveniles [9]. Despite these advancements, the industry still faces a significant shortfall in seedling numbers due to supply limitations and the specific temporal demands of seedling cultivation. This has led to a pronounced reliance on wild seedlings harvesting for aquaculture. In the Zhejiang mud crab aquaculture sector, for instance, a significant portion of wild seedlings is sourced from Fujian. Nonetheless, aquaculture practitioners have noted that seedlings native to the region generally exhibit better adaptability than those sourced externally.
Species with broad distributions are expected to exhibit morphological, physiological, or behavioral differences in response to local conditions, a phenomenon known as local adaptation [10]. Local adaptation is typically driven by genetic variation, which can provide a foundation for molecular breeding [11]. In China, studies have indicated that mud crabs from different coastal regions show a degree of genetic differentiation and local adaptation [12]. However, research on the local adaptation of the mud crabs remains limited, especially in terms of growth performance, morphological indices, and comparative transcriptomics. Most studies have focused on environmental stress and innate immunity [13, 14], with fewer exploring growth-related aspects. A comparative analysis of the claw muscle transcriptome during various fattening stages identified 121 differentially expressed genes (DEGs)[15]. Additionally, four single nucleotide polymorphism (SNP) markers and two candidate genes, multidrug resistance-associated protein 4 (MRP4) and cystic fibrosis transmembrane conductance regulator (CFTR), were associated with growth-related traits in the species [16].
Conventional genetic improvement strategies, which rely on long-term selection, are often labor-intensive and time-consuming [17]. As a result, the development of artificial breeding programs that focus on economically important traits—such as growth rate, disease resistance, and environmental tolerance—is crucial for improving the sustainability of the mud crab farming industry. Molecular breeding techniques, which can overcome the limitations of traditional breeding methods and enhance breeding efficiency, are emerging as a promising alternative [18]. To effectively implement molecular breeding, a thorough investigation of the biological and genetic foundations of key traits in wild mud crabs is essential.
Zhejiang and Fujian, two neighboring provinces in China, are home to mud crab populations that exhibit notable differences in growth rates. This study aims to compare the growth performance, morphological indices, and eyestalk transcriptomes of mud crab native to these regions. The objectives are twofold: (1) to identify the molecular differences that contribute to the observed growth rate variations between the two geographical populations, and (2) to discover candidate genes for potential use in molecular breeding programs. The findings are expected to enhance our understanding of the adaptability of nonlocal varieties, the inherent advantages of local varieties, and growth differences between sexes. This research will provide new insights into advancing the mud crab industry and lay a scientific foundation for future molecular breeding strategies.
2. Materials and Methods
2.1. Ethics Statement
This study adhered to the guidelines established by the Ministry of Science and Technology of the People’s Republic of China (2017#676) and followed the ARRIVE 2.0 framework. The approval for the study was granted by the Institutional Review Boards of Zhejiang Ocean University and the East China Sea Fisheries Research Institute.
2.2. Animal and Experimental Design
The research was conducted at a designated aquaculture facility in in Sanmen County, Zhejiang Province, China. Wild seed mud crabs (C1 stage, with an initial mean weight of 17.60 ± 2.12 mg) were sourced from Sanmen County, Zhejiang (SMC), and Zhangpu County, Fujian (ZPC), with 2000 individuals from each population, without distinction of sex (as sex differences cannot be discerned by the naked eye at the C1 stage). These crabs were stocked at a density of 1000 individuals per pond in four ponds, each with an area ranging from 1300 to 1800 m2. Pond management followed standard aquaculture practices. Prior to the experiment, the ponds underwent aeration, drying, and disinfection. They were then filled with natural seawater to a depth of 1.2 m with a salinity of 20 parts per 1000 (ppt). The experiment ran from April 6, 2023, to November 6, 2023, over a span of 7 months, during which the crabs were fed twice daily.
2.3. Sampling
At the end of the trial, 5 female and 5 male crabs were randomly collected from each pond, forming four groups in the study: SMCF (female crabs from of the Sanmen population), SMCM (male crabs from the Sanmen population), ZPCF (female crabs from the Zhangpu population), and ZPCM (male crabs from the Zhangpu population). The crabs were anesthetized using tricaine methanesulfonate (MS-222, 200 mg/L). Body weight, carapace length, carapace width, cheliped length, and propodus length were measured. Eyestalks were taken, immediately frozen in liquid nitrogen, and stored at −80°C until further analysis.
2.4. Growth Performance and Morphological Parameters
In addition, morphological parameters including carapace width/length, cheliped/carapace length, and propodus/cheliped length were calculated.
2.5. RNA Extraction, cDNA Library Construction, and mRNA Sequencing
Total RNA was extracted from the eyestalks using the RNAiso Plus reagent. DNase I (from Promega, USA) was added to the isolated RNA to eliminate any residual genomic DNA contamination. Subsequently, the First Strand cDNA Synthesis Kit was employed to synthesize cDNA templates from the total RNA, following the manufacturer’s instructions. The construction of the sample library, sequencing, and subsequent analytical services were provided by Shanghai Majorbio Bio-Pharm Technology Co., Ltd., China.
2.6. Pre-Processing Sequence Data
Quality control of raw reads was performed using FastQC (version 0.11.5). Clean reads were obtained using fastx_trimmer (fastx_toolkit-0.0.13.2) and subsequently mapped to the mud crab reference genome GWHALOH00000000 (https://ngdc.cncb.ac.cn/gwh/Assembly/7810/show%2B10.6084/m9.figshare.13338968), using HISAT2 (version 2.2.1). Raw gene counts were generated using the HTSeq-Count package (version 0.12.3) in Python (version 3.5). The overall similarity between samples was evaluated through principal component analysis (PCA) and correlation analysis in R (version 4.3.0).
2.7. Identification of DEGs
DEGs were identified using the DESeq2 package (version 1.40.1) in R (version 4.3.0), based on the criteria of an adjusted p − value ≤ 0.05 and |log2 fold-change| ≥ 1. Hierarchical clustering analysis of the DEGs was performed using the Pheatmap package (version 1.0.12) in R software (version 4.3.0).
2.8. Gene Set Enrichment Analysis (GSEA)
GSEA was performed using the cluster Profiler package (v 4.8.1) in R (v 4.3.0), with an adjusted p-value ≤ 0.05 as the threshold. The Kyoto Encyclopedia of Genes and Genomes (KEGG; http://www.genome.jp/kegg/) and Gene Ontology (GO; http://geneontology.org) databases were used for GSEA.
2.9. Statistical Analysis
Statistical analyses were performed using R software (v 4.3.0, R Development Core Team 2019). For growth performance and morphological indices, t-tests were conducted after verifying the normality of the data using the Shapiro–Wilk test. If the data did not meet the normality assumption, non-parametric tests were applied instead. All data are presented as mean values ± standard error (SD), and p < 0.05 were considered statistically significant. For RNA—seq data, DESeq2, and FDR correction were used for analysis.
3. Results
3.1. Growth Performance and Morphological Parameters
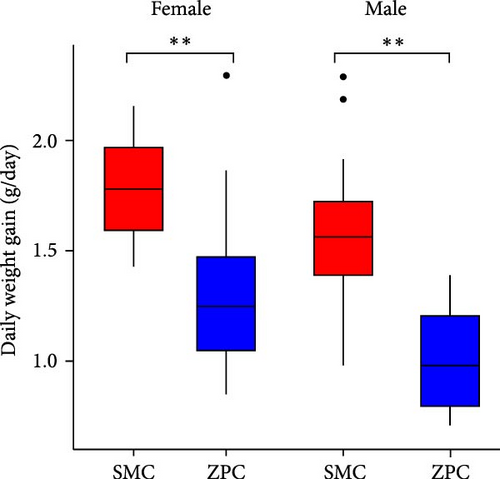
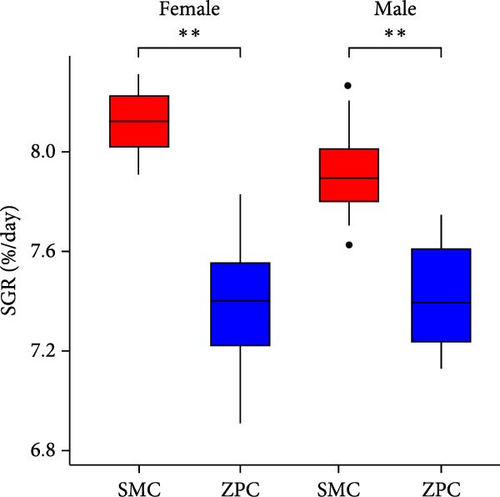
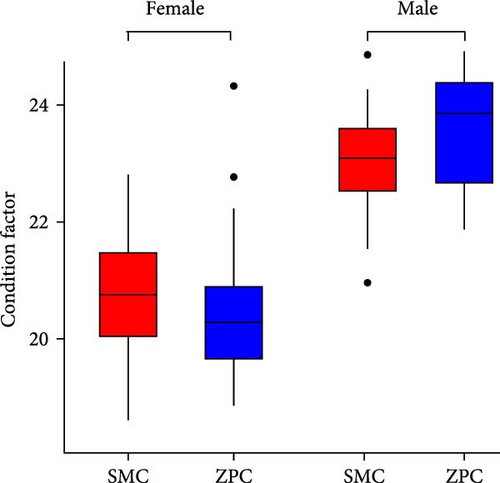
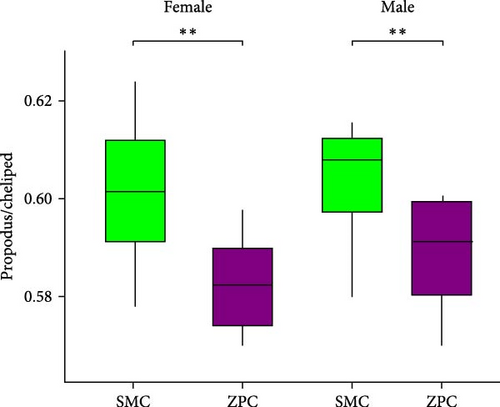
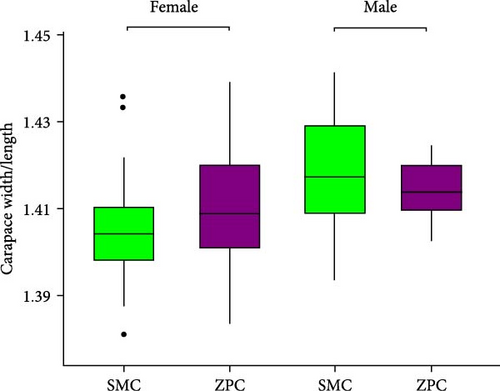
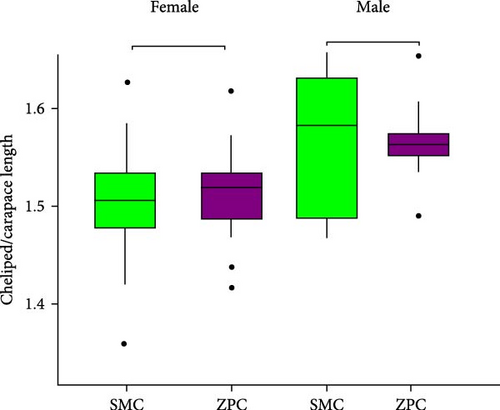
The daily weight gain and SGR of both female and male crabs were significantly higher (p < 0.01) in the SMC population compared to the ZPC population (Figure 1). There was no significant difference (p > 0.05) in condition factor (CF) between the two populations. The propodus/cheliped length of both female and male crabs was significantly greater (p < 0.01) in the SMC population compared to the ZPC population (Figure 2). However, the carapace width/length and cheliped/carapace length ratios were not significantly different (p > 0.05) between the two populations.
3.2. RNA Sequencing Quality Assessment
The quality metrics of the transcriptomes are shown in Table 1. A total of 20 cDNA libraries were constructed from the eyestalks of mud crabs. The raw reads and clean reads of each library were >41 million. The base percentage of Q20 was above 96.42%, while the percentage of Q30 exceeded 90.82%.
| Sample | Raw reads | Raw bases | Clean reads | Clean bases | Q20 (%) | Q30 (%) |
|---|---|---|---|---|---|---|
| SMCF1 | 42,163,758 | 6,366,727,458 | 41,703,260 | 6,121,244,296 | 97.24 | 92.51 |
| SMCF2 | 44,948,432 | 6,787,213,232 | 44,512,306 | 6,477,191,102 | 97.42 | 92.98 |
| SMCF3 | 45,701,400 | 6,900,911,400 | 45,151,128 | 6,617,383,848 | 97.32 | 92.76 |
| SMCF4 | 53,611,560 | 8,041,734,000 | 50,505,582 | 7,575,837,300 | 97.98 | 94.56 |
| SMCF5 | 48,348,832 | 7,252,324,800 | 45,024,564 | 6,753,684,600 | 97.68 | 94.15 |
| SMCM1 | 42,248,680 | 6,379,550,680 | 41,754,064 | 6,074,948,392 | 97.37 | 92.83 |
| SMCM2 | 42,248,626 | 6,379,542,526 | 41,789,816 | 6,132,213,776 | 97.18 | 92.36 |
| SMCM3 | 50,772,510 | 7,666,649,010 | 49,865,750 | 7,176,780,354 | 96.42 | 90.82 |
| SMCM4 | 50,772,466 | 7,615,869,900 | 46,734,744 | 7,010,211,600 | 97.84 | 94.38 |
| SMCM5 | 51,356,872 | 7,703,530,800 | 47,726,012 | 7,158,901,800 | 97.77 | 94.31 |
| ZPCF1 | 43,259,026 | 6,532,112,926 | 42,781,196 | 6,276,920,198 | 97.32 | 92.69 |
| ZPCF2 | 47,612,910 | 7,189,549,410 | 47,101,102 | 6,808,632,688 | 97.23 | 92.49 |
| ZPCF3 | 43,767,612 | 6,608,909,412 | 43,269,236 | 6,311,570,369 | 97.25 | 92.53 |
| ZPCF4 | 55,502,980 | 8,325,447,000 | 51,302,062 | 7,695,309,300 | 97.69 | 94.18 |
| ZPCF5 | 51,977,076 | 7,796,561,400 | 47,609,090 | 7,141,363,500 | 97.77 | 94.24 |
| ZPCM1 | 45,112,080 | 6,811,924,080 | 44,674,234 | 6,534,626,633 | 97.35 | 92.76 |
| ZPCM2 | 50,205,824 | 7,581,079,424 | 49,466,176 | 7,199,605,993 | 97.27 | 92.54 |
| ZPCM3 | 43,094,456 | 6,507,262,856 | 42,685,344 | 6,238,403,468 | 97.28 | 92.58 |
| ZPCM4 | 46,563,676 | 6,984,551,400 | 42,897,688 | 6,434,653,200 | 97.69 | 94.10 |
| ZPCM5 | 56,839,766 | 8,525,964,900 | 52,105,710 | 7,815,856,500 | 97.77 | 94.23 |
- Note: Q20, sequencing error rates lower than 1%; Q30, sequencing error rates lower than 0.1%.
- Abbreviations: SMCF, Female of Sanmen County population; SMCM, Male of Sanmen County population; ZPCF, Female of Zhangpu County population; ZPCM, Male of Zhangpu County population.
3.3. Transcriptome Alignment
The results of the trimming and read mapping are shown in Table 2. The total mapped ratio of reads to the reference genome of all the samples ranged from 81.13% to 88.42%. The ratio of uniquely mapped reads ranged from 64.20% to 85.27%.
| Sample | Total reads | Total mapped | Mapping rate (%) | Multiple mapped | Mapping rate (%) | Uniquely mapped | Mapping rate (%) |
|---|---|---|---|---|---|---|---|
| SMCF1 | 41,703,260 | 35,734,470 | 85.69 | 8,192,693 | 19.65 | 27,541,777 | 66.04 |
| SMCF2 | 44,512,306 | 38,862,952 | 87.31 | 7,854,905 | 17.65 | 31,008,047 | 69.66 |
| SMCF3 | 45,151,128 | 38,620,476 | 85.54 | 7,779,334 | 17.23 | 30,841,142 | 68.31 |
| SMCF4 | 50,505,582 | 42,939,845 | 85.02 | 6,325,039 | 14.73 | 36,614,806 | 85.27 |
| SMCF5 | 45,024,564 | 38,825,354 | 86.23 | 6,293,308 | 16.21 | 32,532,046 | 83.79 |
| SMCM1 | 41,754,064 | 36,919,173 | 88.42 | 6,530,008 | 15.64 | 30,389,165 | 72.78 |
| SMCM2 | 41,789,816 | 36,416,871 | 87.14 | 6,094,845 | 14.58 | 30,322,026 | 72.56 |
| SMCM3 | 49,865,750 | 42,914,569 | 86.06 | 8,052,846 | 16.15 | 34,861,723 | 69.91 |
| SMCM4 | 46,734,744 | 40,653,435 | 86.99 | 6,339,164 | 15.59 | 34,314,271 | 84.41 |
| SMCM5 | 47,726,012 | 41,509,846 | 86.98 | 6,383,835 | 15.38 | 35,126,011 | 84.62 |
| ZPCF1 | 42,781,196 | 37,786,956 | 88.33 | 7,563,948 | 17.68 | 30,223,008 | 70.65 |
| ZPCF2 | 47,101,102 | 40,581,190 | 86.16 | 6,573,041 | 13.96 | 34,008,149 | 72.20 |
| ZPCF3 | 43,269,236 | 35,102,815 | 81.13 | 6,275,211 | 14.50 | 28,827,604 | 66.62 |
| ZPCF4 | 51,302,062 | 44,173,636 | 86.10 | 7,106,491 | 16.09 | 37,067,145 | 83.91 |
| ZPCF5 | 47,609,090 | 41,502,747 | 87.17 | 7,180,252 | 17.30 | 34,322,495 | 82.70 |
| ZPCM1 | 44,674,234 | 38,550,930 | 86.29 | 6,938,317 | 15.53 | 31,612,613 | 70.76 |
| ZPCM2 | 49,466,176 | 42,834,449 | 86.59 | 11,077,232 | 22.39 | 31,757,217 | 64.20 |
| ZPCM3 | 42,685,344 | 36,893,878 | 86.43 | 6,215,727 | 14.56 | 30,678,151 | 71.87 |
| ZPCM4 | 42,897,688 | 37,230,595 | 86.79 | 6,426,983 | 17.26 | 30,803,612 | 82.74 |
| ZPCM5 | 52,105,710 | 45,077,454 | 86.51 | 8,191,950 | 18.17 | 36,885,504 | 81.83 |
- Abbreviations: SMCF, Female of Sanmen County population; SMCM, Male of Sanmen County population; ZPCF, Female of Zhangpu County population; ZPCM, Male of Zhangpu County population.
3.4. PCA and Correlation Analysis
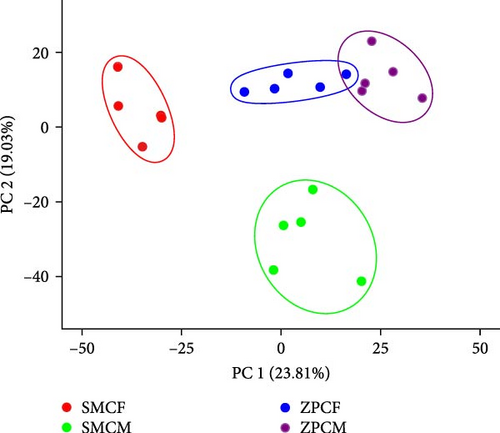
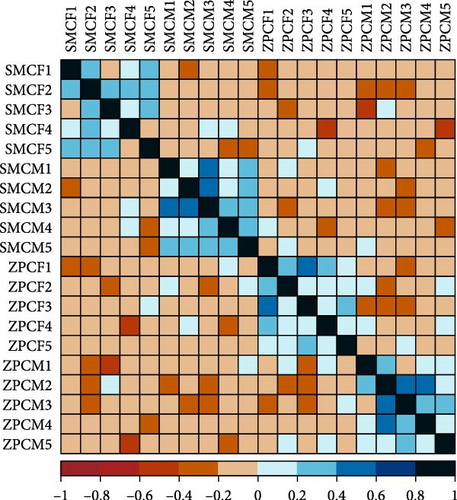
In the PCA score plot, the samples were separated into four distinct groups based on population and gender (Figure 3A). PC 1 and PC 2 explained 42.84% of the total variation in the data. Consistent with the PCA results, the correlation analysis of the samples also demonstrated a good intragroup correlation (Figure 3B).
3.5. DEGs
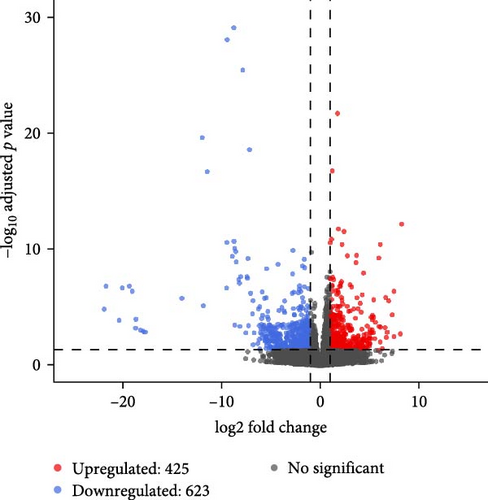
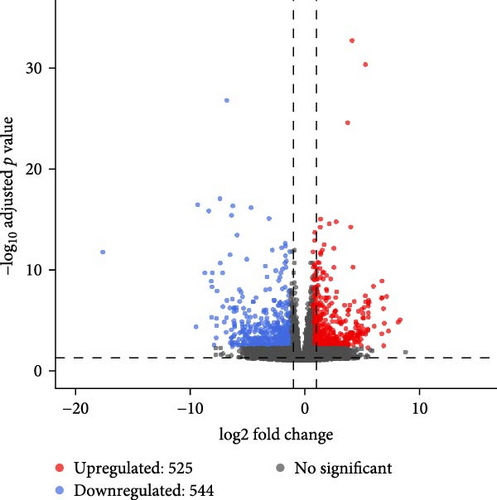
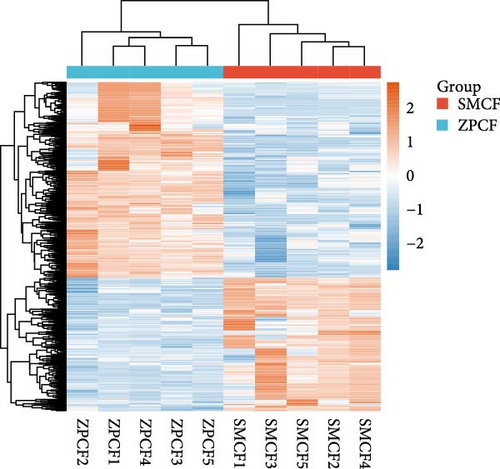
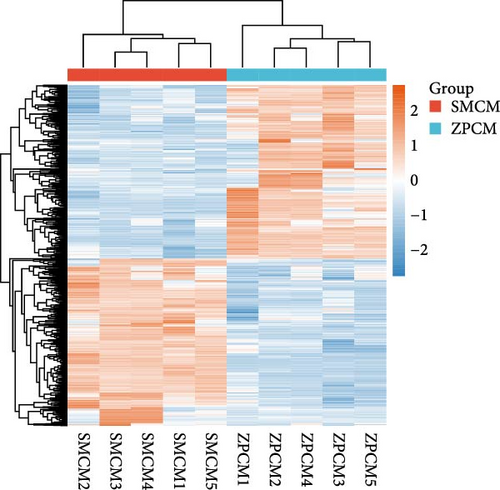
In females, a total of 1048 DEGs were identified, with 425 upregulated genes and 623 downregulated genes in the SMCF group (Figure 4A, Supporting Information 1: Table S1). In males, 1069 DEGs were identified, including 525 upregulated genes and 544 downregulated genes in the SMCM group (Figure 4B, Supporting Information 2: Table S2). Heatmaps illustrated the differences in gene expression patterns between different groups (Figure 5). A total of 44 DEGs were upregulated in both female and male crabs from the SMC population (Figure 6A). Among these, five DEGs, Otop (Otopetrin 1), Smyd (SET and MYND domain containing), AM1159 (Cancer pagurus Cuticle protein AM1159), PPAF1 (PPAR gamma coactivator 1 α), and NARG2 (NMDA receptor regulated 2), might directly regulate the molting and growth (Table 3). Meanwhile, nine DEGs, QDPR (Quinoid Dihydropteridine Reductase), NLRC3 (NLR Family CARD Domain Containing 3), RVT1 (Reverse Transcriptase 1), SMCT (Sodium-Monocarboxylate Cotransporter), NDUFB3 (NADH: Ubiquinone Oxidoreductase Subunit B3), NP4 (Neutrophil peptide 4), FCN (Ficolin), SelM (Selenoprotein M), and FABP3 (Fatty Acid Binding Protein 3), were involved in energy metabolism, nutrient metabolism, and immune response, which could also influence the growth. Eighty-seven DEGs were downregulated in both female and male crabs from the SMC population (Figure 6B). Among them, four DEGs, P5CS (Pyrroline-5-Carboxylate Synthase), PGK (Phosphoglycerate Kinase), FABP6 (Fatty Acid Binding Protein 6), and ATGL (Adipose Triglyceride Lipase), were involved in energy metabolism and fatty acid metabolism, potentially affecting growth.
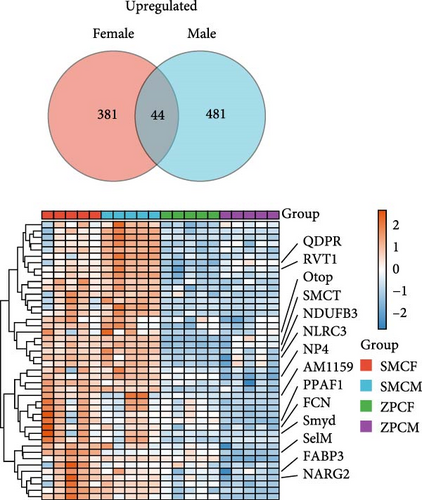
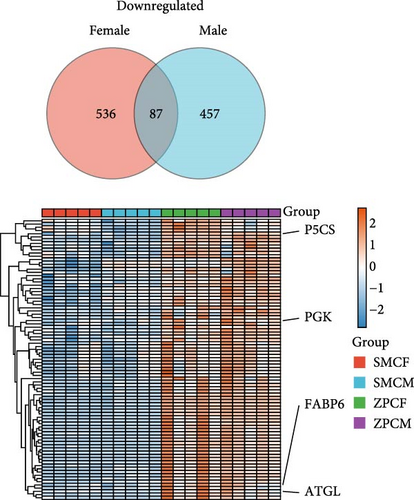
| Category | Gene | log2FC_F | padj_F | log2FC_M | padj_M | |
|---|---|---|---|---|---|---|
| Upregulated genes in sanmen county population | Growth and molting | Otop | 3.5349 | 4.99E-02 | 3.7036 | 2.69E-02 |
| Smyd | 3.0439 | 9.09E-04 | 2.4411 | 1.46E-02 | ||
| AM1159 | 2.9388 | 3.70E-02 | 5.6633 | 3.44E-06 | ||
| PPAF1 | 1.3730 | 2.22E-02 | 1.7916 | 1.25E-03 | ||
| NARG2 | 1.0432 | 2.31E-02 | 1.2220 | 1.16E-02 | ||
| mTOR pathway | QDPR | 5.3993 | 2.14E-06 | 2.1761 | 6.98E-05 | |
| NLRC3 | 1.8463 | 3.01E-04 | 1.2715 | 1.79E-02 | ||
| Nutrient metabolism | SMCT | 3.6848 | 3.27E-10 | 1.8731 | 1.69E-05 | |
| RVT1 | 2.0555 | 1.44E-07 | 1.6999 | 1.13E-06 | ||
| FABP3 | 1.6487 | 3.41E-02 | 1.7249 | 4.33E-02 | ||
| NP4 | 1.1458 | 2.89E-02 | 4.1873 | 2.86E-25 | ||
| Energy metabolism | NDUFB3 | 4.4101 | 2.35E-03 | 4.1521 | 2.74E-03 | |
| SelM | 1.4943 | 1.11E-04 | 1.6074 | 1.56E-02 | ||
| Immune response | FCN | 1.9167 | 2.44E-02 | 2.2087 | 2.38E-02 | |
| Downregulated genes in sanmen county population | Fatty acid metabolism | FABP6 | −3.9944 | 3.59E-04 | −3.2839 | 4.55E-03 |
| ATGL | −2.8915 | 3.34E-04 | −2.9143 | 4.07E-04 | ||
| Energy metabolism | PGK | −1.8925 | 3.18E-02 | −1.8528 | 2.80E-02 | |
| P5CS | −1.0590 | 1.02E-05 | −1.1852 | 2.09E-07 | ||
- Note: log2FC_F, the log2 fold change of DEG in female; padj_F, the adjusted p value of DEG in female; log2FC_M, the log2 fold change of DEG in male; and padj_M, the adjusted p value of DEG in male.
3.6. GSEA
Four KEGG pathways were upregulated in both female and male crabs from the SMC population (Figure 7A)“Melanogenesis,” “Riboflavin metabolism,” “Choline metabolism,” and “Ribosome biogenesis.” Conversely, three KEGG pathways— “Biotin metabolism,” “Arginine and proline metabolism,” and “Phototransduction”— were downregulated in both female and male crabs from the SMC population. Intrestingly, five KEGG pathways were downregulated in female but upregulated in males: “Various types of N−glycan biosynthesis,” “Cell adhesion molecules,” “cAMP signaling pathway,” “Histidine metabolism,” and “Glycosphingolipid biosynthesis.” Additionally, the KEGG pathway “Ubiquinone and other terpenoid−quinone biosynthesis” was upregulated in females but downregulated in males.
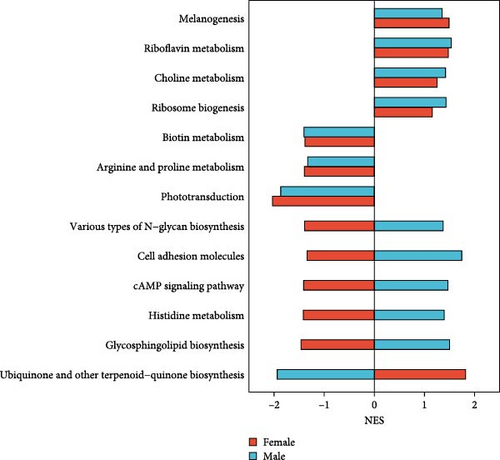
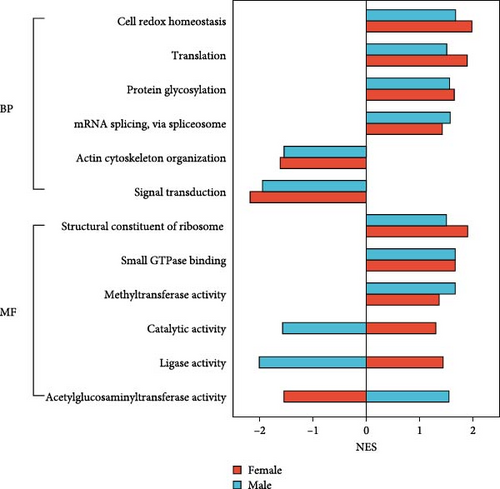
Four GO–BP (biological processes) terms, four were upregulated in both female and male crabs from the SMC population (Figure 7B): “Cell redox homeostasis,” “Translation,” “Protein glycosylation,” and “mRNA splicing, via spliceosome.” Two GO–BP terms—“Actin cytoskeleton organization” and “Signal transduction”— were downregulated in both females and males: Additionally, three GO–MF (molecular functions) terms were upregulated in both sexes: “Structural constituent of ribosome,” “Small GTPase binding,” and “Methyltransferase activity.” Interestingly, two GO–MF terms, “Catalytic activity” and “ligase activity,” were upregulated in females but downregulated in males. Whereas, GO–MF term, “Acetylglucosaminyltransferase activity,” was downregulated in females but upregulated in males.
4. Discussion
Growth rate is critical in aquaculture species, as it directly impacts production efficiency and commercial value. Thus, it is often one of the first traits targeted for genetic improvement [19]. In this study, the growth rates of female and male mud crabs were respectively compared, as these species typically exhibit significant sex-based differences in growth traits [3]. Our results revealed that the SMC population exhibited a faster growth rate than the ZPC population in both sexes, suggesting that it is a suitable model for studying the genetic background of growth trait. Additionally, we observed a morphological difference in the propodus-to-chela ratio between the two populations, which could serve as a key distinguishing characteristic for the SMC population.
The growth of crustaceans occurs through the shedding of the old exoskeleton and the formation of a new one, a special process known as molting, which is primarily regulated by the eyestalk [20, 21]. In the present study, five molting-related DEGs were upregulated in the eyestalk of the SMC population. NARG2, which encodes an NMDA receptor-regulated protein, acts upstream in the methyl farnesoate (MF) signaling pathway [22, 23]. MF is an essential endocrine hormone controlled by the eyestalk and plays an important role in the modulation of molting [24]. The crustacean exoskeleton is constructed from a calcified extracellular matrix called the cuticle. Smyd, encoding lysine methyltransferase, provides a unique epigenetic regulation mechanism for cuticle development and morphogenesis in the Chinese mitten crab (Eriocheir sinensis) [25]. AM1159, which encodes a cuticle protein, interacts with chitin to contribute to cuticle development and structural integrity in crustaceans [26, 27]. Molting also requires the mobilization of CaCO3 for the exoskeleton mineralization [28, 29]. Otops, an evolutionarily conserved family of proton channels found in various animals, have been reported to be critically involved in the mineralization process, providing an exit route for protons liberated during the formation of CaCO3 [30, 31]. In addition, PPAF1, which belongs to the serine proteinases family, has been reported to control and regulate molting in the blue crab (Callinectes sapidus) [32]. Taken together, the present study suggests that the faster growth rate of the SMC population may be attributed to enhanced molting regulation, particularly in exoskeleton formation.
Nutrition and energy are essential for growth and molting in crustaceans, and the mTOR signaling pathway acts as a central hub, coordinating nutrient status, energy homeostasis, and growth [33–35]. Previous studies have reported that mTOR signaling could regulate molting in response to environmental conditions by affecting neuropeptide production in the eyestalk of the Dungeness crab Metacarcinus magister [36]. In the present study, two regulators of the mTOR signaling pathway, NLRC3 and QDPR, as well as two energy metabolism-related DEGs, were upregulated in the eyestalk of the SMC population, suggesting that the SMC population may have a better capacity to enhance energy allocation to molting via the mTOR pathway [37, 38]. Additionally, the protein metabolism-related gene RVT1, the fatty acid transport-related genes FABP3 and SMCT, and the mineral metabolism-related gene NP4 were upregulated in the SMC population, implying their important roles in promoting the growth of the mud crab [39–41]. In addition to the DEGs, the upregulation of the “Ribosome biogenesis” KEGG pathway in the SMC population further supports this, as ribosome biogenesis is essential for protein biosynthesis and typically parallels growth rate [42].
Two nutrient metabolism-related pathways, namely “Choline metabolism” and “Riboflavin metabolism,” were identified as being enriched in this study. Choline is an essential precursor for metabolites like the neurotransmitter acetylcholine, the membrane constituent phosphatidylcholine, and the methyl group donor betaine, all crucial for crustacean metabolism [43]. Choline has been shown to enhance growth performance in the shrimp and crab [44, 45]. Our study indicated that mud crabs from the SMC population may utilize choline more efficiently for growth. Riboflavin, an essential component of the cofactors FAD and FMN, is important for energy metabolism and stress response, although its role in invertebrates is less understood [46]. Riboflavin and choline are metabolically interconnected, both participating in one-carbon metabolism, which may influence growth through their interaction.
Light is a critical ecological factor affecting crustacean growth, development, and reproduction. Its effects depend on factors such as wavelength, intensity, and photoperiod [47]. Specific wavelengths, like blue and cyan light, have been shown to promote growth in mud crabs and other shrimp species [48–50]. Light intensity and photoperiod also play key roles, with a 12-h light:12-h dark cycle being particularly beneficial [47, 51]. Shorter photoperiods may enhance growth rates in some species, while longer ones can support regular metamorphosis [52, 53]. The eyestalk, equipped with photoreceptors, is vital for receiving light signals and adapting to environmental conditions. The enrichment of the “Phototransduction” pathway in the eyestalk transcriptome suggests that the SMC population has an enhanced capacity to regulate growth in response to light signals [47].
5. Conclusion
In conclusion, this study demonstrated that the SMC population of mud crabs exhibited a faster growth rate than the ZPC population. Five DEGs related to molting and growth (Otop, Smyd, AM1159, PPAF1, and NARG2) were identified, which may serve as potential candidate genes for improving growth rates through genetic enhancement. The SMC population also appeared to allocate nutrients and energy more effectively to molting and growth via the mTOR signaling pathway, with regulators NLRC3 and QDPR playing key roles. Furthermore, the “Phototransduction” pathway plays a crucial role in the regulation of growth in mud crabs. These findings provide a solid foundation for future research on the molecular mechanisms underlying growth and support advancements in molecular breeding for mud crabs.
Conflicts of Interest
The authors declare no conflicts of interest.
Author Contributions
Yue Wang: investigation, methodology, data curation, writing–original draft and review, funding acquisition, Xiao-Shan Wang: resource provision, Sheng-Yu Liu: resource provision, Ben-Jian Wang: resource provision, Zhi-Xing Su: investigation, Xiao-Kang Lv: investigation, Jia-Yuan Xu: investigation, Xue-Feng Song: investigation, Bian-Bian Zhang: investigation, Li-Guo Yang: conceptualization, software, supervision, funding acquisition, writing–review and editing, supervision.
Funding
This work was supported by the Bureau of Science and Technology of Zhoushan (2023C41019), and the Scientific Research Foundation for Talents of Zhejiang Ocean University (JX6311101223).
Supporting Information
Additional supporting information can be found online in the Supporting Information section.
Open Research
Data Availability Statement
The data that support the findings of this study are available from the corresponding author upon reasonable request.


