Transcriptome Analysis Highlights Key Differentially Expressed Genes Involved in Autolysis Process in Polychaete Perinereis aibuhitensis
Abstract
Perinereis aibuhitensis belongs to Annelida, Polychaeta, and mainly lives in intertidal zones along the coast of China and several Southeast Asian countries. The P. aibuhitensis has a similar autolysis phenomenon to sea cucumbers, both of which belong to predeath autolysis. This study aimed to investigate the autolysis pathway and reveal the autolysis mechanisms of P. aibuhitensis. The second-generation transcriptomes of the P. aibuhitensis at different stages of autolysis were sequenced and analyzed and the authenticity of the transcriptomic data was verified by real-time fluorescence quantitative PCR (RT-qPCR). A total of 78,653 unigenes were obtained after sequencing, including 1495 differentially expressed genes (DEGs) in the P0h vs. P72hDS (drilled sandworms) groups, 1995 DEGs in the P0h vs. P72hUD (undrilled sandworms) groups and 34 DEGs in the P72hDS vs. P72hUD. The DEGs were mainly concentrated in ECM–receptor interaction (collagen alpha-5[IV], collagen alpha-1[I], agrin), apoptosis-multiple species (caspase-7, bcl-2, baculoviral IAP repeat-containing protein 5-like, septin-5), arachidonic acid (AA) metabolism pathways (carbonyl reductase [NADPH] 1, glutathione (GSH) peroxidase-like, thromboxane-A synthase, secretory phospholipases A2) and metabolism of xenobiotics by cytochrome P450 (CYP450; glucuronosyltransferase, GSH S-transferase, CYP450 family 1 subfamily A1, teroid 17-alpha-hydroxylase, alcohol dehydrogenase). These DEGs were related to cell morphology, cell apoptosis, antioxidant defense response, material and energy metabolism, nerve and muscle damage, etc. In addition, endogenous proteases such as HYAL1 and matrix metalloproteinase-9 (MMP9) were also found to have significant differences between P0h and P72h groups. Four DEGs were screened and subjected to RT-qPCR detection, which confirmed the accuracy of the transcriptome results and also suggested that these genes were closely related to autolysis in P. aibuhitensis. All these results provide a basis for the study of the autolysis process and related genes in P. aibuhitensis and also contribute to the study of the autolysis mechanism in other marine animals.
1. Introduction
Perinereis aibuhitensis belongs to Annelida, Polychaeta, Errantia, Nereididae, Perinereis, also known as sandworms, sea centipedes, or sea locusts. As a dominant species in intertidal estuarine mud and sand beaches, the P. aibuhitensis is distributed in the Bohai Sea, Yellow Sea, East China Sea, and the South China Sea and is also widely distributed in Southeast Asian countries [1]. P. aibuhitensis has high nutritional and medicinal value. It contains a variety of essential and nonessential amino acids and is rich in minerals and trace elements. Because of its high protein content, P. aibuhitensis cannot only be used as a sea fishing bait but also as a living bait for fish and shrimp. Recently, as the important environmental indicator organisms and dominant species for ecological restoration of mudflat, the P. aibuhitensis is being given more and more attention [2].
Autolysis is familiar in aquatic animals and generally occurs after the death of aquatic animals. In addition, autolysis will occur during the transportation and preservation, which will bring great economic losses to aquaculture. Due to the autolysis induced by endogenous enzymes, the texture of seafood becomes soft and the quality decreases rapidly [3]. Autolysis of organisms is mainly due to the role of enzymes in the body, such as phosphorylase, lipase, cathepsin, and intestinal enzymes. Generally, before the death of the organism, most of the endogenous enzymes exist in the form of inactive precursors. Only when the body needs to use some cofactors to activate these enzymes, and some specific enzymes usually exist in specific tissues in the form of activity. However, when the organism dies, the body’s system of regulating enzymes fails, and endogenous enzymes are dispersed in various tissues in the form of activity to cause autolysis of the fish [3]. Autolysis before the death of organisms is currently only observed in sea cucumbers. Studies have shown that the body wall of a sea cucumber will autolyze when it is stimulated by temperature change, salinity change, nutrient deficiency, ultraviolet irradiation, and mechanical damage [4, 5]. The autolysis of sea cucumber is mainly caused by endogenous enzymes such as matrix metalloproteinases (MMPs) [6], cathepsins [7, 8], serine proteases [9], and cysteine proteases [10]. Furthermore, oxidative damage and cell apoptosis were also involved in the process of sea cucumber autolysis [11, 12].
However, this phenomenon is rarely mentioned in the studies about P. aibuhitensis. In a previous study, it was found that the P. aibuhitensis was prone to autolysis during transportation and preservation before death, similar to sea cucumbers (Stichopus japonicus) [13]. The autolysis phenomenon of sandworms is manifested in symptoms such as redness, swelling, congestion, stiffness and curvature of the body, physiological excretion, and tail ulceration until death. However, there are currently few reports and studies on the autolysis of the sandworms, leading to unclear mechanisms of its autolysis. Therefore, in this study, we sequenced the transcriptome of P. aibuhitensis at different stages of autolysis. Meanwhile, autolysis-related gene expression at different stages of autolysis was determined. These findings will be valuable not only for better understanding the autolysis process of P. aibuhitensis, but also preliminarily revealing its mechanism.
2. Materials and Methods
2.1. Experimental P. aibuhitensis
The adult P. aibuhitensis in nonreproductive stage used in this experiment were purchased from Dongtai Guangya Aquatic Products Co., Ltd. The sandworms used in the present study was incubated in our laboratory according to the local standard of Jiangsu (DB32/T2450-2013) for P. aibuhitensis artificial breeding. Several aquariums were prepared, and 7–8 cm of saturated seawater soil was laid inside the aquariums, with a salinity controlled at around 25 psu. The uniformly sized, healthy, and undamaged sandworms were selected and raised for 1 week in soil with saturated water at a temperature of 20°C. Timely supplement artificial seawater to ensure the moist state of sandworms and soil. The sandworms were fed fish meal at 8:00 and 19:00 daily, and the dead sandworms were removed timely to avoid polluting the breeding environment.
2.2. Experimental Processing and Sample Collection
At the end of transient rearing, a total of 180 healthy sandworms with a body length of 18.64 ± 1.27 cm and a weight of 2.9 ± 0.37 g were chosen for breeding experiments. These sandworms were randomly divided into six groups (0, 24, 48, 72, 96 and 120 h) with 30 per group. The sandworms in each group were placed in a new aquarium with 7–8 cm of saturated seawater soil. The feeding conditions were the same as the acclimation period. After the time processing is completed, three sandworms were randomly selected from each container to conducte histomorphological observation to explore the development of autolysis in sandworms.
Based on the preliminary experimental results and observations of the physiological state of the sandworm during the experiment, it was found that the autolysis phenomenon was most obvious at 72 h, and there were some sandworms drilled soil while others did not. In order to understand the molecular mechanism of autolysis and the differences between the sandworms drilled soil and those undrilled, three sandworms were randomly selected from each of 0 h (P0h), 72 h drilled sandworms (P72hDS), and 72 h undrilled sandworms (P72hUD) group, respectively, for transcriptome sequencing. In addition, five sandworms were randomly selected for gene expression level detection at 0, 24, 48, 72, 96, and 120 h. Rinsed the samples with sterile physiological saline to remove surface soil and other debris and immediately frozen them in liquid nitrogen.
2.3. Histomorphological Observation of Autolysis
For the selected sample, the middle part of the body was cut transversely and longitudinally for morphological observation. About 1 cm of the tissue was fixed in paraformaldehyde solution for 24 h. After the fixation was completed, the tissue of the target site was repaired and smoothed with a dissecting knife in the ventilation cupboard, and then the repaired tissue was placed in the dehydration box. Then, the tissue was fixed in Bouin’s solution, and sections (4 μm) were stained with hematoxylin and eosin (H&E). The tissue sections were scanned and analyzed by Case Viewer image analysis system (3DHISTECH Ltd., Budapest, Hungary) to observe the changes of tissue structure at different stages of autolysis.
2.4. RNA Extraction, Library Construction, and Sequencing
A total of nine libraries were constructed by three muscle tissues in a total of three groups. And the muscle tissues were shipped to Gene Denovo Biotechnology Co. Ltd. (Guangzhou, China) for RNA-seq analysis. Total RNA was extracted using Trizol reagent kit (Invitrogen, Carlsbad, CA, USA) according to the manufacturer’s protocol. RNA quality was assessed on an Agilent 2100 Bioanalyzer (Agilent Technologies, Palo Alto, CA, USA) and checked using RNase free agarose gel electrophoresis. After the RNA extraction of the sample was completed, the mRNA was enriched by Oligo (dT) beads, and reverse transcribed to form double-stranded cDNA with random primers. Second-strand cDNA was synthesized by DNA polymerase I, RNase H, dNTP, and buffer. Then the cDNA fragments were purified with QiaQuick PCR extraction kit (Qiagen, Venlo, The Netherlands), end repaired, poly (A) added, and ligated to Illumina sequencing adapters. The ligation products were size-selected by agarose gel electrophoresis, PCR amplified, and sequenced using Illumina HiSeqTM 4000 by Gene Denovo Biotechnology Co. (Guangzhou, China).
Reads obtained from the sequencing machines included raw reads containing adapters or low-quality bases, which would affect the following assembly and analysis. Thus, to get high quality clean reads, reads were further filtered by fastp [14] (version 0.18.0). The parameters were as follows: (1) removing reads containing adapters; (2) removing reads containing more than 10% of unknown nucleotides (N); and (3) removing low quality reads containing more than 50% of low-quality (Q-value ≤ 20) bases.
2.5. De Novo Assembly
For de novo assembly of data processed with the MGIseq system, high-quality clean reads were assembled using the Trinity tool (https://github.com/trinityrnaseq/trinityrnaseq/wiki) with the default setting of K-mer = 25 [15]. Transcripts of length ≥201 bp were considered and were clustered at 97% identity using CD-HIT. The assembled transcripts were then annotated using BLASTX searches against the GenBank non-redundant (nr) database with a cutoff e-value of < 10−5. The transcripts were used as a reference dataset for DEGs analysis using the TopHat v2.1.0 software on the Linux_x86_64 operating system.
2.6. Functional Annotation
The assembled unigenes were annotated by sequence comparison with public databases, including the NCBI nonredundant protein Nr (http://www.ncbi.nlm.nih.gov/), Swiss-Prot (http://www.ebi.ac.uk/uniprot/), the Clusters of Orthologous Groups (COG) (http://www.ncbi.nlm.nih.gov/COG/), and the Kyoto Encyclopedia of Genes and Genomes (KEGG) (http://www.genome.jp/kegg/), with an E-value < 1e−5 [16]. Gene Ontology (GO) analysis of biological functions, cell components, and molecular functions was performed using the GoStats program (Roswell Park Center Institute, Buffalo, NY, USA) as implemented in the Blast2GO sequence annotation tool (BioBam Bioinformatics SL, Valencia, Spain). Protein functional annotations could then be obtained according to the best alignment results.
Unigenes were aligned by BLASTx (e value < 0.00001) to protein databases in priority of nr, Swissprot, KEGG, and COG/KOG. The best alignment results were chosen to decide the sequence direction of unigenes. When a unigene could not be aligned to any of these protein databases, protein coding sequence and sequence direction would be confirmed using TransDecoder program. Advanced annotation of unigenes includes CDS prediction of unigenes, SSR prediction, Pfam protein domain prediction, SMART protein domain prediction, transcription factor (TF) prediction (plant/animal), R-gene prediction (plant), PHI database annotation (bacteria/fungi), and post-translational modification site prediction.
2.7. Differentially Expressed Genes (DEGs) Analysis
To analyze DEGs between P0h, P72hDS, and P72hUD, the value of reads per kb per million (RPKM) was applied to calculate and normalize the gene expression levels [17]. The DESeq2 software was applied to analyze the read count data, and the genes with the parameter of false discovery rate (FDR) < 0.05 and absolute fold change ≥ 2 were considered DEGs. Finally, the enrichment analysis of GO and pathway was conducted to recognize the main biological functions and pathways in DEGs.
2.8. Verification of DEGs
To verify the accuracy of the transcriptome sequencing, 18 sandworms in the undrilled sandworms were randomly selected at each time point (0, 24, 48, 72, 96, 120 h) with three at each time point. All these sandworms were ground with liquid nitrogen, and total RNA was extracted with Monad Total RNA Extraction Kit. Reverse transcription was completed with MonScript RTIII Super Mix with dsDNase (Two-Step) to synthesize the first-strand cDNA. All primers for real-time fluorescence quantitative PCR (RT-qPCR) were designed with software Oligo 7 according to the corresponding sequences and listed in Table 1, and actin was used as a house-keeping gene. 12.5 μL RT-qPCR reaction volume was containing the following components: 6 μL MonAmp ChemoHS qPCR Mix, 0.5 μL each of forward and reverse primer, 0.5 μL of cDNA and 5 μL of distilled water. The cycling parameters were as follows: (1) pre-denaturation (95°C, 10 min); (2) denaturation (① 95°C, 15 s; ② 60°C, 30 s; ① and ② repeated for 40 cycles); and (3) final extension (72°C, 5 min). All reactions were done in triplicate with the actin gene as the internal reference. The relative expression of genes was calculated according to the 2−ΔΔCt method, three biological replicates were set for the quantification of each gene, and the data were presented as mean ± SD.
| Gene ID | Gene | Primer sequence (5′–3′) | Expected size (bp) |
|---|---|---|---|
| Unigene0012714 | COL5 |
|
178 |
| Unigene0054615 | BCL2 |
|
218 |
| Unigene0073825 | CBR1 |
|
180 |
| Unigene0032893 | GST |
|
170 |
2.9. Data Analysis
Data are presented as means ± SD. Significant differences among the treatments were analyzed by one-way analysis of variance (ANOVA), and Duncan’s post hoc multiple comparisons were performed following one-way ANOVA. SPSS 19.0 was used to perform statistical calculations, and the statistical significance level was set at p < 0.05.
3. Result
3.1. Morphology of the Autolysis
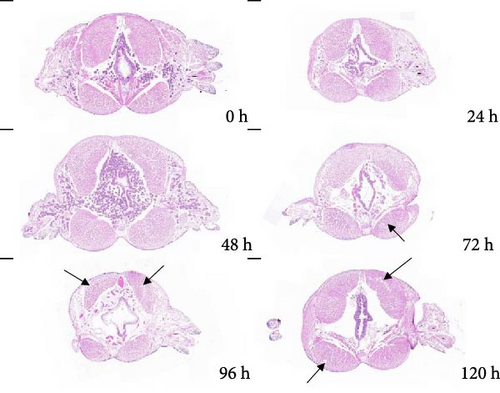
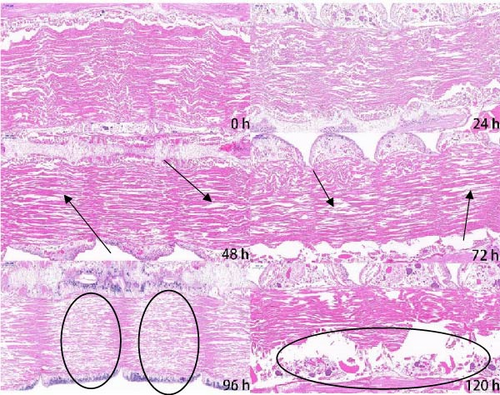
Figure 1 shows the pictures of transverse and longitudinal cutting at different stages (0, 24, 48, 72, 96, and 120 h at 20°C) of autolysis in P. aibuhitensis. It can be seen from these figures that the muscle fibers of P. aibuhitensis at 0 h were closely arranged and regular. At 24 h, some muscle fibers of the P. aibuhitensis began to break. Especially in the transverse section, gaps appeared between the muscle fibers, which were not tightly arranged. No significant difference was observed between 48 and 24 h in both longitudinal and transverse sections. At 72 and 96 h, the longitudinal section showed a large amount of dissolution and breakage appeared between the muscle fibers, and the transverse section showed several cavities appeared in the muscle tissue, and the arrangement of muscle fibers is loose and disordered. At 120 h, there is a significant amount of muscle fiber dissolution and a large number of cavities present in the muscle tissue.
3.2. Transcriptome Sequencing and De Novo Assembly
The number of raw data varied from 47,999,936 (P0h-3) to 80,821,220 (P72hDS-3), and the number of clean reads varied from 47,931,476 (P0h-3) to 80,701,948 (P72hDS-3), which could account for over 99.8% of raw data. The quality control data Q20 of the sandworms is between 97.93 and 98.42, Q30 is between 93.96 and 95.13, and the GC content is between 47.63 and 49.63, all within the normal range. The filtering statistics Data were showed in Table 2. The datasets for all experimental groups are available at the NCBI Short Read Archive (accession no. PRJNA1132303).
| Samplea | Raw datab | Clean data (%)c | Clean data (bp)d | Q20 (%)e | Q30 (%)f | GC (%)g |
|---|---|---|---|---|---|---|
| P0h-1 | 48,819,482 | 48,766,682 (99.89) | 7,273,903,593 | 98.28 | 94.81 | 48.68 |
| P0h-2 | 55,327,898 | 55,250,114 (99.86) | 8,244,792,600 | 97.93 | 93.96 | 48.61 |
| P0h-3 | 47,999,936 | 47,931,476 (99.86) | 7,154,824,405 | 98.07 | 94.24 | 47.85 |
| P72hDS-1 | 63,693,224 | 63,640,126 (99.92) | 9,474,422,724 | 98.42 | 95.13 | 49.63 |
| P72hDS-2 | 53,475,714 | 53,393,324 (99.85) | 7,977,364,980 | 97.96 | 94.03 | 47.63 |
| P72hDS-3 | 80,821,220 | 80,701,948 (99.85) | 12,048,606,519 | 98.04 | 94.23 | 47.77 |
| P72hUD-1 | 51,240,518 | 51,172,012 (99.87) | 7,633,005,008 | 98.08 | 94.35 | 47.94 |
| P72hUD-2 | 71,971,310 | 71,878,170 (99.87) | 10,732,808,398 | 98.09 | 94.34 | 48.06 |
| P72hUD-3 | 53,822,168 | 53,750,614 (99.87) | 8,027,951,766 | 98.13 | 94.43 | 47.63 |
- aSample.
- bRawDatas: Number of RawReads.
- cCleanData: Number of high-quality reads and (based on RawReads) percentage.
- dCleanData(bp): Total number of bases of filtered high-quality data (bp).
- eQ20(%): Percentage of bases with sequencing base quality values above Q20 level in CleanData.
- fQ30(%): Percentage of bases with sequencing base quality values above Q30 level in CleanData.
- gGC(%): GC ratio of filtered sequence bases.
3.3. Functional Annotation of Unigenes
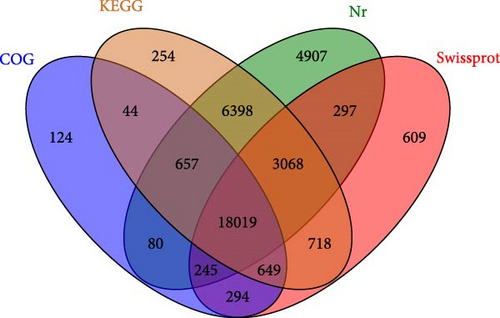
A total of 78,653 unigenes were obtained after sequencing, ranging from 201 to 34,069 bp. The mean length of unigene was 1000 bp with an N50 value of 1927 bp. Unigene sequence alignment to protein databases Nr, SwissProt, KEGG, and COG/KOG by blastx (E value < 0.00001). The result shows that 36,363 annotated genes and 42,290 nonannotated genes were annotated to the four major databases as shown in Figure 2. Nr (33,671), KEGG (29,807), COG (20,112), and SwissProt (23,899), respectively. And there were 18,019 unigenes that could be annotated in all four databases mentioned above.
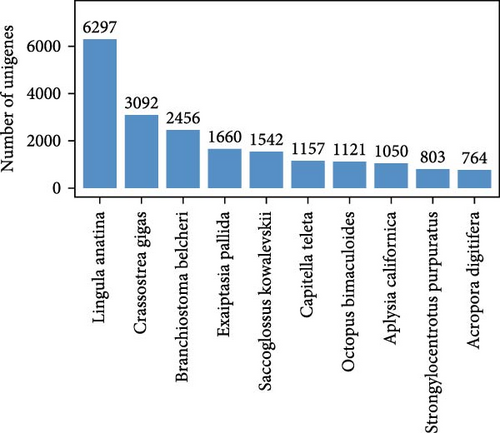
Compared the unigenes obtained from sequencing with the Nr database, listed each unigene as a homologous sequence with the best alignment result in the database and determined the species to which the homologous sequence belonged. Performed statistical analysis on the obtained data to obtain the results in Figure 3. The species with the highest homology among them are Lingula anatina (18.70%), followed by Crassostrea gigas, Branchiostoma belcheri, Exaiptasia pallida, Saccoglossus kowalevskii, Capitella tella, Octopus bimaculatus, Aplysia californica, Strongylocentrotus purpyratus, and Acropora digitifera.
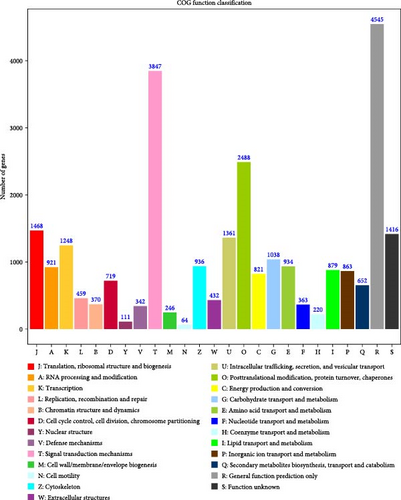
Annotated the protein sequences obtained from sequencing into COGs, where each cluster of COGs is composed of orthologous sequences, thus inferring the function of the obtained sequences. From Figure 4, it can be seen that the sequence responsible for general functional prediction was the highest in the sequence of the sandworms, followed by signal transduction mechanisms and fat transport and metabolism.
3.4. DEGs Identification and Functional Annotation
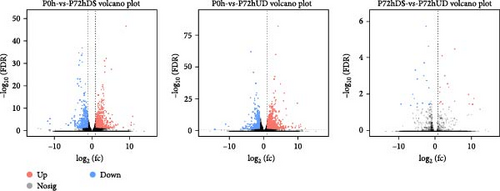
The transcriptome and differential gene expression analysis of P0h, P72hDS, and P72hUD revealed that there were 1495 DEGs (909 up-regulated genes and 586 down-regulated genes) in the P0h vs. P72hDS groups, 1995 DEGs (1348 up-regulated genes and 647 down-regulated genes) in the P0h vs. P72hUD groups, and only 34 DEGs (18 up-regulated genes and 18 down-regulated genes) in the P72hDS vs. P72hUD groups in P. aibuhitensis. A volcano plot of DEGs in the different groups is shown in Figure 5. Moreover, the principal component analysis of the samples revealed that the compositions of the P72hDS vs. P72hUD groups were very similar and both were significantly different from the P0h group, so only the P0h vs. P72hDS groups and the P0h vs. P72hUD groups were analyzed and discussed in this study.
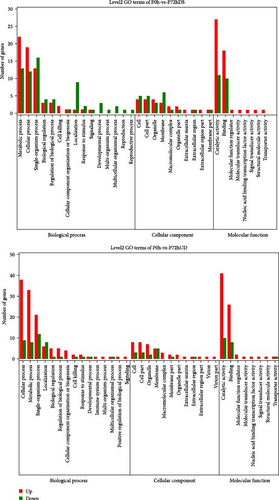
To better visualize the changes in the expression of differential genes, we performed GO enrichment analysis, including GO functional classification annotation and GO functional significance enrichment analysis of the genes. As shown in Figure 6, in the P0h vs. P72hDS group, the number of most up-regulated expression was catalytic activity contained in the molecular function, followed by the metabolic and cellular processes contained in the biological processes. The number of top three down-regulated genes were single-organism process, metabolic, and cellular processes contained in the biological processes, respectively. In the P72hUD group compared with the P0h group, the number of top three up-regulated genes was consistent with the P72hDS group. The top three down-regulated genes were the single-organism process, cellular processes contained in the biological processes, and catalytic activity contained in the molecular function.
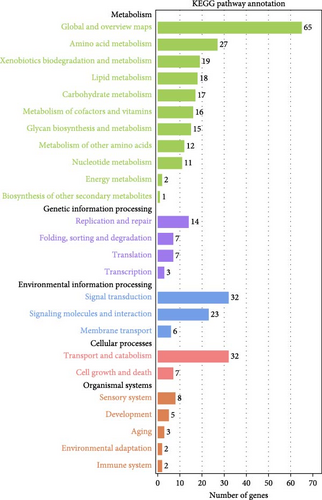
Furthermore, the KEGG pathway enrichment analysis for DEGs of each group was performed. Once mapped to the KEGG database, the results in P0h vs. P72hDS, P0h vs. P72hUD showed that these DEGs were successfully annotated and assigned to 106 and 115 pathways, respectively. Results of KEGG annotation revealed that the DEGs identified in the P0h vs. P72hDS comparison were mapped to 25 KEGG terms, including 11 “metabolism,” 4 “genetic information processing,” 3 “environmental information processing,” 2 “cellular processes,” and 5 “organismal systems” terms (Figure 7a). The most represented two categories in “metabolism” were “global and overview maps” and “amino acid metabolism.” “replication and repair” and “transport and catabolism” were the most represented categories in the “genetic information processing” and “cellular processes” categories, respectively. For “environmental information processing,” the most abundant category was “signal transduction.” The “sensory system” was the most represented categories in the “organismal systems.” The results of KEGG annotations in the P0h vs. P72hUD comparison were basically consistent with that in the P0h vs. P72hDS comparison (Figure 7b). The main difference was the “translation” was the most represented category in the “genetic information processing.”

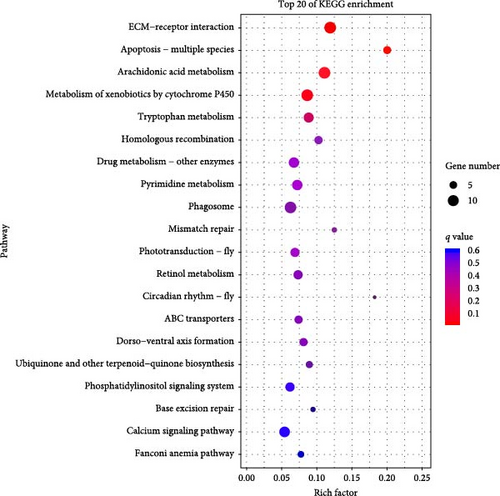
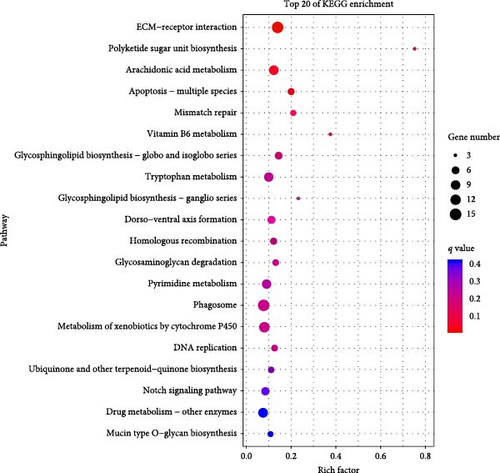
The top 20 pathways with the most abundant DEGs of different treatment groups are observed in Figure 8. In the P0h vs. P72hDS group, the ECM–receptor interaction, apoptosis-multiple species, and arachidonic acid (AA) metabolism were the most abundant pathways. The ECM–receptor interaction, polyketide sugar unit biosynthesis, and AA metabolism were the most abundant pathways in the P0h vs. P72hUD group. Based on the results of KO enrichment and gene function annotations, we had screened some key DEGs involved in autolysis process in P. aibuhitensis, which are shown in Table 3.
| Gene ID | Gene description | Abbreviation | Mean mRNA expression level(RPKM) | Log2Ratio (P72hDS/P0h) | Log2Ratio (P72hUD/P0h) | ||
|---|---|---|---|---|---|---|---|
| P0h | P72hDS | P72hUD | |||||
| ECM–receptor interaction | |||||||
| Unigene0012714 | Collagen alpha-5(IV) chain | COL5A | 19.41 | 67.13 | 58.69 | 1.79 | 1.60 |
| Unigene0035570 | Collagen alpha-1(I) chain | COL1A | 44.97 | 21.87 | 16.79 | −1.04 | −1.42 |
| Unigene0018192 | Agrin, partial | AGRN | 112.20 | 54.05 | 51.02 | −1.05 | −1.14 |
| Apoptosis—multiple species | |||||||
| Unigene0000176 | Caspase-7 | CASP7 | 1.58 | 3.40 | 3.21 | 1.10 | 1.02 |
| Unigene0054615 | bcl-2-like protein | BCL-2 | 7.45 | 15.31 | 16.69 | 1.04 | 1.16 |
| Unigene0023940 | Baculoviral IAP repeat-containing protein 5-like | BIRC5 | 7.13 | 23.63 | 25.39 | 1.73 | 1.83 |
| Unigene0001976 | Septin-5 | SEPT5 | 4.75 | 9.90 | 12.13 | 1.06 | 1.35 |
| Arachidonic acid metabolism | |||||||
| Unigene0073825 | Carbonyl reductase [NADPH] 1 | CBR1 | 11.7 | 46.72 | 29.81 | 2.00 | 1.35 |
| Unigene0032763 | Glutathione peroxidase-like | GPX | 253.74 | 26.92 | 46.68 | −3.24 | −2.44 |
| Unigene0023235 | Thromboxane-A synthase | TBXAS1 | 6.97 | 2.93 | 1.97 | −1.25 | −1.83 |
| Unigene0029063 | Secretory phospholipases A2 | sPLA2s | 1.50 | 8.82 | 8.97 | 2.56 | 2.58 |
| Metabolism of xenobiotics by cytochrome P450 | |||||||
| Unigene0027906 | Glucuronosyltransferase | UGT | 1.57 | 3.78 | 4.37 | 1.2 | 1.47 |
| Unigene0032893 | Glutathione S-transferase | GST | 46.64 | 230.94 | 237 | 2.31 | 2.35 |
| Unigene0010396 | Cytochrome P450 family 1 subfamily A1 | CYP1A1 | 19.50 | 7.74 | 8.08 | −1.33 | −1.27 |
| Unigene0000478 | Teroid 17-alpha-hydroxylase | CYP1B1 | 2.00 | 5.83 | 5.86 | 1.55 | 1.55 |
| Unigene0056550 | Alcohol dehydrogenase | ADH | 1.16 | 3.8 | — | 1.72 | — |
| Endogenous proteases | |||||||
| Unigene0003325 | Hyaluronidase-1 | HYAL1 | 11.25 | 50.49 | 48.24 | 2.17 | 2.10 |
| Unigene0019086 | Matrix metalloproteinase 9, partial | MMP9 | 16.95 | 72.63 | 68.44 | 2.10 | 2.01 |
| Unigene0026748 | Matrix metalloproteinase 9, partial | MMP12 | 5.25 | 13.22 | 15.82 | 1.33 | 1.59 |
| Unigene0010832 | Matrix metalloproteinase-24 | MMP24 | 1.14 | 7.49 | 7.29 | 2.72 | 2.87 |
| Unigene0047797 | Elastase-1 isoform X1 | ELA1 | 10.53 | 37.18 | 45.81 | 1.82 | 2.12 |
| Unigene0053237 | Fibrinolytic protease | FP | 149.21 | 342.55 | 386.60 | 1.20 | 1.37 |
3.5. Real-Time Fluorescence Quantification Validation
We selected four genes (COL5A, BCL2, CBR1, and GST) for RT-qPCR analysis, which mainly involved in ECM–receptor interaction, apoptosis-multiple species, AA metabolism, and metabolism of xenobiotics by cytochrome P450 (CYP450) pathways. These were identified in the DEG analysis as significant transcriptional genes with the same trends between P0h vs. P72DS and P0h vs. P72UD group and therefore acted as representative genes for the different biological processes identified previously. In addition, the sequences of these genes were relatively complete and had clear annotation information for further research. The melting curves of four genes in the results showed a single peak, indicating that these primers did not exhibit primer dimers or nonspecific amplification. The primers met the requirements of fluorescence quantitative PCR experiments and can be used for subsequent analysis. After verification, it was found that the actual expression of these four genes is consistent with the transcriptome data, proving the reliability of the transcriptome data and allowing for further analysis (Figure 9).
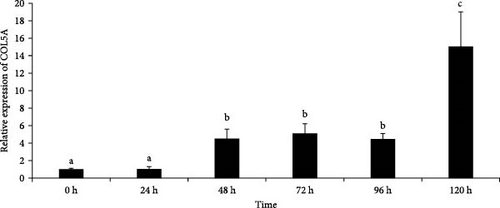
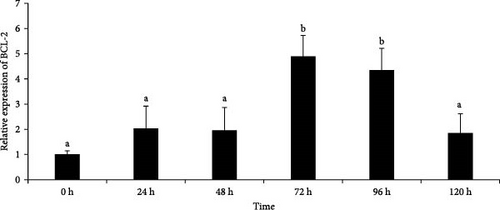


As shown in Figure 9, the expression of COL5A showed an upward trend over time, with significantly higher expression levels at 48 h compared to 0 and 24 h, and reached a maximum at 120 h. The expression of BCL-2 showed a trend of first increasing and then decreasing, with a maximum at 72 h. The expression of CBR1 showed a certain upward trend with the prolongation of autolysis time, and starting from 48 h, the expression level of this gene showed a significant increase. The expression level of GST gene also showed an upward trend with time, but there was a slight decrease at 120 h.
4. Discussion
Autolysis is common in aquatic organisms, including fish, shrimp, octopus, and squid. Important endogenous enzymes that promote autolysis include enzymes from the intestine, enzymes present in muscle tissue, and enzymes synthesized and secreted in the extracellular matrix (ECM) [3]. At present, there are few studies on the autolysis process of living organisms, and only focusing on mollusks such as Octopodidae and S. japonicus. This article reported for the first time on the autolysis phenomenon of sandworms and found that a large number of muscle fibers of P. aibuhitensis began to dissolve after 48–72 h by transverse and longitudinal cutting of the body segments of sandworms at different stages of autolysis. Moreover, voids appeared between the tissues over time, which was consistent with the results of octopus [18]. It was found that after the sea cucumber body wall was treated with the endogenous protease MMP, the tissue block of body wall lost its original shape, and mucilage-like degeneration occurred [6]. Through electron microscopy, it was found that collagen fibers were depolymerized into collagen fiber bundles and single fibers, and there were some fragmented fibril bridges on the surface of the disintegrated collagen fiber. The body wall of sandworms is mainly composed of coelomic membrane, muscle layer, epidermis layer, and cuticle. The body wall structure of Apostichopus japonicus is different from that of sandworms, which is mainly composed of complete collagen fibers and microfibers forming a network structure. Studies have shown that the autolysis of sea cucumber is due to the structural damage of macromolecules such as collagen fibers and microfibers [19]. However, the physiological mechanism of muscle fiber fusion in the autolysis process of P. aibuhitensis is still unclear.
Transcriptomics has become an important means of exploring the biological mechanisms of many farmed animals. According to recent studies, transcriptomic studies have revealed the mechanisms of nutrient metabolism and digestion in fish intestines [20], the relationship between vertebrate evolution and development [21], fish muscle development [22], and related research issues such as the immune system [23]. Therefore, this study aims to explore the autolysis mechanism of the sandworm through transcriptome sequencing.
Early observational studies of histological sections of Tylorrhynchus heterochaetus revealed that it possesses well-developed circular and longitudinal muscles [24]. As time goes on, sandworms gradually show symptoms of decreased motorability, weakness, bleeding, and other symptoms of autolysis. After the time treatment of the sandworms, the transcriptome and differential gene expression analysis of P0h, P72hDS, and P72hUD revealed that there were 1495 DEGs in the P0h vs. P72hDS groups, 1995 DEGs in the P0h vs. P72hUD groups, and only 34 DEGs in the P72hDS vs. P72hUD groups in the sandworms. From the number of DEGs and the results of principal component analysis of the samples, we can infer that the genetic changes in the body of sandworms after 72 h of storage are significant, which is likely due to autolysis process. However, at 72 h, regardless of whether sandworms exhibit soil drilling behavior, the genetic differences in their bodies are relatively small, indicating that soil drilling behavior cannot prevent sandworms from autolysis. Therefore, only the P0h vs. P72hDS groups and the P0h vs. P72hUD groups were analyzed and discussed in this study.
AA is a polyunsaturated fatty acid widely present in animal tissues, especially in phospholipids (PLs) of cell membranes, and the activation of phospholipases (e.g., cytosolic phospholipase A2) releases free AA from the PL pools and makes it available for oxidative metabolism by several enzyme systems, such as cyclooxygenase (COX), lipoxygenase (LOX), and CYP450 in the body [25]. The function of AA metabolism pathway gene, which generally has sequence conservation in eukaryotes, is mainly related to antioxidant activity [26]. And its evolutionary driving force may be the emergence of mitochondria in eukaryotes, leading to new antioxidant defense responses. Reactive oxygen species (ROS) are associated with the damage and pathogenesis of various organisms. Research has shown that certain forms of ROS (such as H2O2) may appear as signal transduction messengers at medium to high concentrations [27]. This study detected significant differences in the expression levels of CBR1, GPX, TBXAS1, and sPLA2s genes between P0h and P72h groups. The increased expression level of sPLA2s gene means that sandworms will release more free AA during autolysis process. Carbonyl reductase (CBR1), also known as 20β-hydroxysteroid dehydrogenase, is a key enzyme in metabolism of prostaglandins (PGs) which are the products of AAs metabolism by COX enzyme, and can participate in physiological processes such as muscle contraction and inflammatory response [28]. The protein encoded by GPX belongs to the glutathione (GSH) peroxidase family, which uses GSH as an electron donor to catalyze the reduction of organic hydroperoxides and hydrogen peroxide (H2O2) to water or corresponding alcohols, thereby protecting cells from oxidative damage and clearing peroxides produced in cells [29, 30]. Xi et al. [31] found that the enzyme activities of SOD, CAT, and GPx in the body wall and intestine of sea cucumber decrease during autolysis, while the content of GSH increases. In this study, the expression level of GPX decreased after 72 h of storage in sandworms, which is similar to that in sea cucumber, indicating that autolysis is accompanied by oxidative damage.
Apoptosis, also known as programed cell death, is a cellular mechanism used to remove cells that are injured, infected, or reach the end of their life span [32]. In sea cucumber cells, apoptosis induction was involved in UVA-induced autolysis [4]. In this study, several DEGs involved in the apoptosis—multiple species pathway were detected between P0h and P72h group, such as BIRC5, BCL2, SEPT4, and CASP7. The CASP7 is a key executioner of apoptosis-caspases, which can activate caspases (CASP8, CASP9, and/or CASP10) and cleave CLSPN, PARP1, PTGES3, and YY1 [33]. The SEPT4 gene is a member of the septin gene family and has been confirmed to induce cell apoptosis in various cells, such as HL-60, A549, COS-7, etc. [34]. In the present study, compared to P0h, the increased expression of CASP7 and SEPT4 in the P72hUD and P72hDS group indicates that cell apoptosis occurred during the autolysis process of sandworms. Interestingly, high expression of apoptosis inhibitory proteins-BIRC5 and BCL2, were also observed over time. The increased expression of anti-apoptotic proteins is usually a self-protection mechanism of cells when facing stress. Under stressful conditions, cells are subjected to various stresses, such as oxidative stress, endoplasmic reticulum stress, DNA damage, etc., which may lead to cell apoptosis. To resist these stresses, cells inhibit apoptosis by increasing the expression of anti-apoptotic proteins.
The ECM is a crucial three-dimensional acellular framework that is universally present in tissues and plays key regulatory role in cell signaling, functions, properties, and morphology [34]. In mammals, the role of ECM extends beyond merely offering physical support to maintain tissue integrity and elasticity, it assumes a dynamic structure subject to tissue remodeling processes, regulating homeostasis, and maintenance of tissue repairing processes [35, 36]. Extracellularly secreted as well as cell-boundfactors are among the major members of the ECM family, including collagen, elastin, fibronectin, laminin, glycoproteins, integrins, proteoglycans, and glycosaminoglycans (GAGs) [37, 38]. As an ECM proteoglycan, agrin plays a certain role in the formation of immune synapses, the organization of cytoskeleton, and the improvement of pathological muscle function [39]. Notably, collagens are the principal structural components within ECM, imparting tensile strength to constrain the extensibility of proteoglycan-rich tissues [40]. So far, over 44 collagen genes have been reported, and the collagen gene family accounts for 30% of the total protein mass in mammals [41]. In the present study, the gene expression levels of COL5A and COL1A showed significant differences between P0h and P72h group, among which COL5A showed high expression over time, while COL1A showed a trend of first increasing and then decreasing. This may be due to the fact that COL1A is the main structural protein in the ECM, providing tensile strength and elasticity to muscle tissue. The decrease in its gene expression level leads to the destruction of sandworm muscle tissue, while COL5A, as a regulatory fiber collagen, participates in tissue repair in the process of sandworm autolysis. Agrin is a nerve derived factor inducing postsynaptic neuromuscular junction (NMJ) differentiation at its contact with the sarcolemma [39]. The agrin (AGRN) splice variant that is inactive in inducing postsynapses at the NMJ has recently been shown to globally affect the cytoskeleton of skeletal muscle through costamere organization [42]. It was found that the AGRN could accelerate cutaneous wound healing by improving mechanoperception of migrating keratinocytes and allowing them to respond to mechanical stresses through MMP12 [43]. In a study on mice, it was found that high expression of the agrin gene affects the signaling function of the neural, thus affecting muscle strength and muscle fiber morphology [44]. The significant elevation of agrin gene in the late stage of autolysis in sandworms might be the causative factor for their muscle fiber damage and loss of soil drilling ability.
During the autolysis process of aquatic animals, important endogenous enzymes that promote autolysis include cathepsin, calpain, MMP, and digestive enzymes [3, 45–47]. Through transcriptomic analysis, significant differences were also observed in the expression of some endogenous enzymes. In order to better understand the role of these enzymes in the autolysis process of sandworms, we further investigated their expression changes in the sandworm time treatment group. Hyaluronidase (HYAL) is glycosidase that can degrade hyaluronic acid (HA) and some GAGs, and plays a role in the initial stage of hyaluronic acid degradation [48]. Research has shown that high expression of HYAL2 in organisms can trigger degradation of hyaluronic acid in the ECM, and the expression of HYAL2 is highly likely to be induced by ROS in vivo [49]. It can be inferred that the damage to the body tissue during the autolysis process of P. aibuhitensis is closely related to the increase of HYAL2 gene expression and oxidative stress in the body. Fibrinolytic protease (FP), as an alkaline serine protease, has been proven by many studies to have significant fibrinolytic activity and potential application value in the prevention and treatment of thrombosis [50]. The experimental results of this study indicate that the relative expression level of the FP gene significantly increased during the autolysis and remained at a high level, indicating that FP plays a crucial role in its autolysis process. Elastase 1 (ELA1) belongs to the elastase family, which can break down elastin. Elastin is an elastic fiber that, together with collagen, determines the mechanical properties of connective tissue [51]. Through antioxidant and anti-aging experiments on human dermal fibroblasts, it was found that the elastin related protein ELA was significantly down-regulated under the stimulation of anti-aging factors [52]. The results of this experiment showed an up-regulation trend of the elastase gene autolysis process of the sandworms, indicating that elastase has a negative effect on maintaining the morphological integrity of the sandworms tissue. MMP belongs to a large family of calcium dependent zinc containing endopeptidases, which play an important role in tissue reconstruction and degradation of ECM, involving elastin, gelatin, collagen, proteoglycans, and matrix glycoproteins [53]. In recent years, it has been reported that MMP hydrolyzes collagen and noncollagen proteins in the body wall of sea cucumber [54]. Ding et al. [55] confirmed that endogenous MMP causes complete depolymerization of collagen fibers into smaller collagen fiber bundles and fibers, which is due to the rupture of bridges between proteoglycan fibers. Meanwhile, endogenous MMP also causes partial degradation of collagen fibers through the release of soluble hydroxyproline and pyridine cross-linking. In our study, we also found that the expression of several MMP gene was significantly up-regulated in the autolysis process of sandworms, indicating the MMP promotes autolysis of sandworms.
5. Conclusions
This study, for the first time, utilized transcriptomic techniques to investigate the molecular mechanism of autolysis in P. aibuhitensi. A total of 78,653 Unigenes and 1495, 1995, 34 DEGs were obtained in the P0h vs. P72hDS, P0h vs. P72hUD, and P72hDS vs. P72hUD, respectively. By functional annotation and pathway enrichment of these differences, we obtained some key signaling pathways involved in the autolysis process of sandworms, including ECM–receptor interaction, AA metabolism pathways, Apoptosis - multiple species, Metabolism of xenobiotics by CYP450. In addition to analyzing differential genes in the aforementioned signaling pathways, we also identified some differentially expressed endogenous proteases, such as HYAL, MMP9, ELA1, and FP. Furthermore, four DEGs were screened and subjected to RT-PCR detection, which confirmed the accuracy of the transcriptome results and also suggested that these genes were closely related to autolysis in P. aibuhitensis. All these results provide a basis for the study of the molecular mechanism of autolysis in P. aibuhitensis and also contribute to the study of the autolysis mechanism in other marine animals.
Ethics Statement
The experimental design in this study was approved by the Biomedical Ethics Committee of Yancheng Institute of Technology (224001, Jiangsu, China).
Conflicts of Interest
The authors declare no conflicts of interest.
Author Contributions
Qing Nie, Shengjie Ren, and Bin Geng designed and performed the experiments and analyzed the bioinformatics data. JinYin Wang and Fengjuan Jiang assisted the experiments. Fu Lv and Jinghui Fang interpreted the data and drafted and revised the manuscript. Zhitao Qi revised the manuscript and supervised the study design and data analysis. All authors contributed to the revision of the intellectual content and approved the final version for publication. Qing Nie and Shengjie Ren contributed equally to this article.
Funding
The authors are grateful to the research project on China Yancheng Fishery High Quality Development Research Project (YCSCYJ2021025), National Nature Science Foundation of China Project (Grant 31902362), and Natural Science Foundation Youth Fund Project of Jiangsu Province (Grant BK20210943) for financial support of this work.
Open Research
Data Availability Statement
The data that support the findings of this study are available from the corresponding author upon reasonable request.


