Boosting Growth, Muscle Development, and Intestinal Morphology in Gangetic Mystus (Mystus cavasius) With Dietary Synbiotics
Abstract
This study examined the impact of dietary synbiotics on the growth performance, muscle proliferation, and intestinal histomorphology of Gangetic mystus (Mystus cavasius). Synbiotics, which combine probiotics and prebiotics, are thought to enhance fish health by improving a balanced gut microbiota. Four experimental diets were prepared with different concentrations of synbiotics (0%, 4%, 6%, and 8%) and fed to this fish over a 45-day period. Growth performance of the fish significantly improved as the level of synbiotics in their diet increased. Key metrics like final weight, weight gain, specific growth rate (SGR), and food conversion ratio all showed improvement. The diet containing 8% synbiotics resulted in the highest growth rates. A second-order polynomial regression of SGR revealed that the optimal growth occurred when the diet included ~8% of synbiotics. Histological analysis revealed that the 8% synbiotic diet led to the greatest increases in villi length, villi width, and goblet cell numbers, indicating enhanced gut health and nutrient absorption. Liver histology showed improved hepatocyte health, while muscle tissue analysis demonstrated higher muscle cell counts with higher synbiotic inclusion. These findings suggest that dietary synbiotics can effectively boost growth performance, intestinal structure, and tissue development in Gangetic mystus, offering potential benefits for aquaculture practices. Future research should explore the long-term effects and applicability of synbiotics across various fish species and environmental conditions.
1. Introduction
The Gangetic mystus (Mystus cavasius), a key species in the aquaculture sector of South Asia, has attracted considerable research attention due to its significant role in local fisheries and economic value [1, 2]. With the increasing demand for sustainable and efficient aquaculture practices, enhancing fish health and growth performance has become a focal point of research. One innovative approach in this area is the use of synbiotics in fish diets [3–6]. Synbiotics are dietary supplements that combine probiotics—live beneficial microorganisms—with prebiotics—nondigestible food ingredients that promote the growth of these microorganisms [7–13]. Synbiotics have gained significant attention in aquaculture due to their potential to optimize growth performance and physiological health in fish. This combination of synbiotics is believed to offer synergistic benefits, potentially improving gut health and overall performance in aquatic species by creating a more favorable gut environment when used in tandem, which can, in turn, positively influence growth rates, immune response, and disease resistance [6, 14–16].
The Gangetic mystus, a species known for its adaptability and resilience, could significantly benefit from dietary synbiotics. Growth performance, an essential metric for assessing aquaculture efficiency, is often influenced by the quality of diet and gut health. Synbiotics have the potential to enhance growth rates by optimizing nutrient utilization and promoting a healthy gut microbiome. Furthermore, muscle development is a crucial factor in the commercial value of fish. By improving nutritional uptake and overall health, synbiotics may contribute to better muscle cell development [17, 18].
The impact of synbiotics on liver and muscle health is of great interest [15]. The liver, being a central organ in metabolism and detoxification, can reflect the overall health and nutritional status of the fish. Histomorphological assessments of liver tissue can reveal changes in cellular structure and function induced by dietary interventions [19]. Similarly, muscle tissue analysis provides insights into the growth and development of the fish, with potential implications for meat quality and yield [20]. The intestinal histomorphology of Gangetic mystus also plays a critical role in understanding the effects of synbiotics. By examining the histological changes in the intestinal lining, researchers can gain insights into how synbiotics influence gut morphology, including villi length, crypt depth, and mucosal thickness. These parameters are indicative of the efficiency of nutrient absorption and overall gut health [21].
This study investigates the effects of synbiotics on growth, muscle development, and intestinal health in Gangetic mystus. We aim to determine if synbiotics can significantly improve growth rates, promote muscle cell development, and enhance gut morphology in this fish species. Through rigorous analysis, we seek to provide valuable knowledge for aquaculture professionals. This research will help optimize feed formulations, thereby increasing the sustainability and productivity of fish farms. As the aquaculture industry continues to evolve, incorporating effective dietary strategies like synbiotics is crucial for improving fish health and overall performance.
2. Materials and Methods
2.1. Synbiotics Preparation
Synbiotics were prepared in a plastic container using the following ingredients: 500 mL of cow milk, 5 g of mannan oligosaccharide (MOS), 7.5 g of NaCl, 50 g of molasses, 5 g of wheat bran, and 2.5 g of probiotics (Aua-Life S, Naphavet Com. Ltd., Vietnam, containing a blend of Lactobacillus acidophilus, Enterococcus sp., Bacillus sp., Rhodococcus sp., B. subtilis, B.coagulans, B. pumilus, B. licheniformis, B. megaterium, B. polymyxa, B. mesentericus, Saccharomyces cerevisiae, and an enzyme complex). The mixture was completed with distilled water to a total volume of 1 L. The ingredients were thoroughly combined with a spoon, and the container was sealed and left at room temperature for 3 days with continuous aeration. After the incubation period, the suspension was filtered using filter paper and transferred into three airtight bottles. A small portion of the suspension was also taken for microbial counting. Bacterial colonies were enumerated on MRS agar plates (HiMedia M641) and recorded as colony-forming units (CFU/mL). The synbiotic solution showed a bacterial count of 3.09 × 10⁸ CFU/mL and was designated as the stock solution.
2.2. Experimental Procedures
Juvenile Gangetic mystus (M. cavasius) were sourced from a local private hatchery in Mymensingh and were housed in a concrete tank measuring 2.5 × 3.5 × 1.5 m. For the initial 2 weeks, the fish were fed a basal diet (Table 1) with 37% protein, administered twice daily at 3% of their body weight, to acclimate them to pelleted feed (0.5 mm). After this acclimation period, the fish, with an average initial weight of 1.10 ± 0.05 g and length of 4.39 ± 0.07 cm, were distributed into 12 plastic containers, each measuring 60 × 60 × 30 cm and holding 90 L of water. A total of 125 fish were assigned to each container to ensure an equal distribution among all groups. The containers were divided into four treatment groups: the first group served as the control, while the second, third, and fourth groups were given diets supplemented with 4%, 6%, and 8% dietary synbiotics, respectively, and were labeled as T0, T1, T2, and T3. Over the 45-day experiment, the fish were fed their respective diets at a rate of 5% of their body weight. The experimental procedures were conducted in accordance with the guidelines set by the Animal Care Committee of Bangladesh Agricultural University.
| Moisture (max) | Crude protein (min) | Fat (min) | CHO (max) | Fiber (max) | Ash (max) | Calcium (max) |
|---|---|---|---|---|---|---|
| 12% | 37% | 8% | 20% | 4% | 16% | 2.1% |
- Note: The proximate composition of the feed, as provided by the manufacturer, is presented in this table.
Water quality was maintained daily by replacing 10% of the water and providing continuous aeration to each container. Temperature was measured using a thermometer, dissolved oxygen levels were monitored with an oxygen meter (Smart Sensor, DO Meter AR8010, China), and pH was assessed with a portable digital pH meter (Water Quality Tester, BLE-P-3, China). Ammonia nitrogen levels were evaluated using a test kit (Model NI, 22669-00, Hach Co.).
2.3. Sampling and Measurement
The experiment spanned 45 days, with random sampling of five fish conducted at intervals of 15 days (on days 0, 15, 30, and 45). During each sampling, average fish length and weight were measured. Unconsumed feed was removed daily through siphoning. Regular visual inspections were performed to monitor the health status of the fish, and careful handling techniques were employed to minimize stress during sampling. Growth parameters, including length gain, weight gain, DWG, percent weight gain, and specific growth rate (SGR), were estimated throughout the experiment. Finally, fish survival was recorded daily.
2.4. Growth and Feed Utilization Parameters
Growth performance and feed utilization parameters were calculated using the following equations:
Weight gain (g) = Mean final weight − mean initial weight.
Daily weight gain (DWG) (g) = (Mean final weight − mean initial weight)/total culture period (days).
Percent weight gain (% WG) = (Mean final weight − mean initial weight)/(mean initial weight) × 100.
Fish fullness = Mean final length − mean initial length.
SGR (%/day) = (Ln final weight (g) − (ln initial weight (g)/total culture period (days) × 100.
Feed conversion ratio (FCR) = Feed intake (g)/weight gain (g).
Survival rate (SR) (%) = (Final number of fish/Initial number of fish) × 100.
2.5. Histological Observations
Five fish were meticulously dissected, and the liver, muscle, and intestines were weighed to the nearest gram. Tissue samples from the liver, muscle, and intestines were initially preserved in Bouin’s solution for 72 h and then fixed in 10% formalin for 48 h. These samples were processed using the traditional paraffin inclusion method. Sections of 5 µm thicknesses were cut from each sample using a microtome (KD-3358 Semi-Automated Rotary Microtome, China), placed on slides, and stained with hematoxylin and eosin.
The slides were examined with a microscope equipped with a digital video camera (Sony DXC-930P, Sony Corporation, Tokyo, Japan). Image analysis was performed using the Cast Image System (Version 2.3.1.3). Measurements included the length and width of nine randomly selected villi per section, as well as the number of goblet cells, hepatic cells, and proliferation of muscle fiber. Villi width was measured from the lamina propria to the villi apex, while villi length was measured from the apex to the villi crypt junction.
2.6. Statistical Analysis
For statistical analysis, one-way analysis of variance (ANOVA) was performed, followed by Duncan’s multiple range test (DMRT) and Tukey’s test as post hoc analyses to evaluate mean differences at the p < 0.05 level for synbiotic supplementation. A second-order polynomial regression analysis method [22] was conducted to analyze the SGR of the Gangetic mystus in response to dietary synbiotics supplementation levels. Data were analyzed using SPSS (Statistical Package for Social Sciences, version 25.0; SPSS Inc., Chicago, Illinois, USA), following Zar [23]. All results are presented as mean ± SD (n = 7).
3. Results
3.1. Growth Parameters
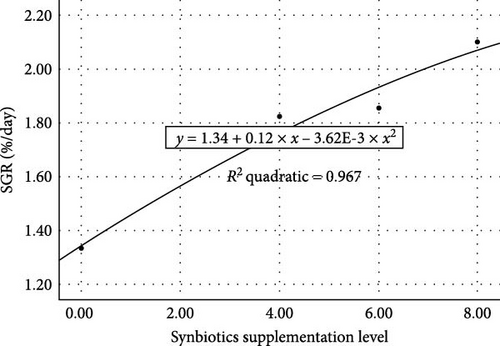
The growth performance of Gangetic mystus was significantly enhanced by increasing synbiotic levels (Table 2). Fish fed 8% synbiotics (T3) exhibited relatively higher final weight, weight gain, and length gain compared to the T1 and T2 groups, with T3 achieving a weight gain of 1.74 g and a fish fullness of 2.22 cm. The percentage of weight gain was also highest in T3 (163.38%), followed by T2 and T1. In contrast, the control group (T0) showed the lowest weight gain (0.74 g) and fish fullness (0.88 cm). SGR and FCR followed a similar trend, with T3 exhibiting the best growth rate (2.10%/day) and the most efficient food conversion (1.69). A second-order polynomial regression analysis for SGR indicated that a growth optimum occurred about at 8% supplementation of synbiotics (Figure 1). However, there were no significant differences in SR among the dietary treatments. These findings demonstrate that synbiotics, particularly at 8%, promote better growth and feed efficiency in Gangetic mystus.
| Parameter | T0 (0%) | T1 (4%) | T2 (6%) | T3 (8%) |
|---|---|---|---|---|
| Initial weight (g) | 0.99 ± 0.07 | 1.04 ± 0.06 | 1.06 ± 0.03 | 1.07 ± 0.04 |
| Final weight (weight at 45th day (g) | 1.73 ± 0.06b | 2.61 ± 0.10a | 2.65 ± 0.11a | 2.81 ± 0.07a |
| Weight gain (g) | 0.74 ± 0.01b | 1.57 ± 0.03a | 1.59 ± 0.02a | 1.74 ± 0.03a |
| Daily weight gain (g) | 0.02 ± 0.03b | 0.03 ± 0.01a | 0.03 ± 0.07a | 0.04 ± 0.01a |
| Weight gain (%) | 89.41 ± 1.13b | 131.21 ± 1.21ab | 132.22 ± 1.01ab | 163.38 ± 2.03a |
| Fish fullness (cm) | 0.88 ± 0.03c | 1.62 ± 0.01b | 1.68 ± 0.02ab | 2.22 ± 0.04a |
| SGR (%/day) | 1.33 ± 0.01c | 1.82 ± 0.03b | 1.86 ± 0.02b | 2.10 ± 0.03a |
| FCR | 2.11 ± 0.02c | 1.93 ± 0.14b | 1.78 ± 0.11a | 1.69 ± 0.09a |
| SR (%) | 98 ± 0.09a | 98 ± 0.15a | 97 ± 0.25a | 99 ± 0.75a |
- Note: The data are presented as the mean ± SD (n = 7). Superscript letters (a, b, and c) indicate significant differences (Duncan’s test, p < 0.05) within a row. T0, T1, T2, and T3 refer to dietary treatments with different levels of synbiotics.
- Abbreviations: FCR, food conversion ratio; SGR, specific growth rate; SR, survival rate.
3.2. Intestinal Morphological Indices
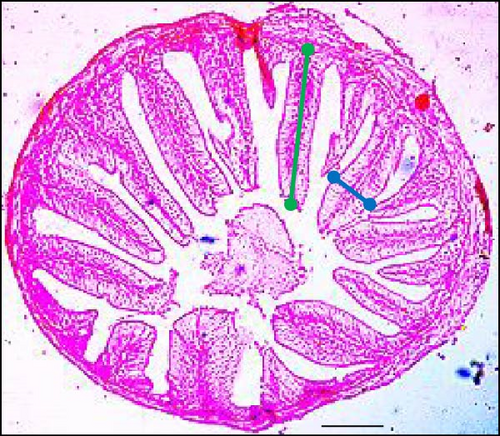
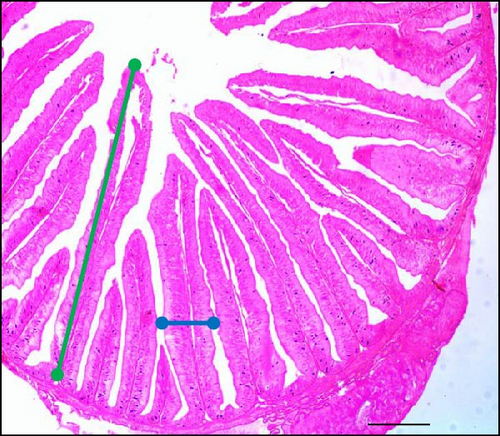
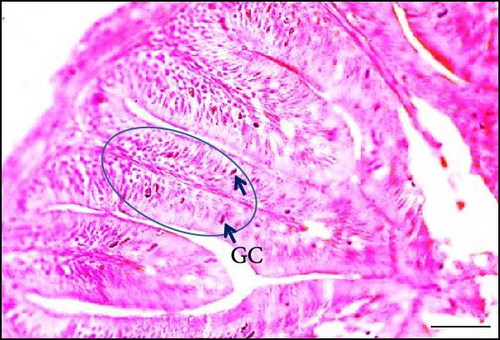
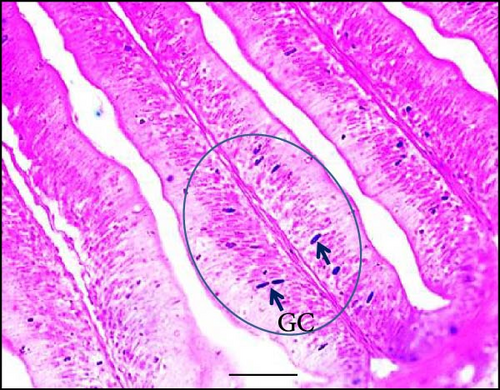
Supplementing the diet with synbiotics led to a significant improvement in the histological characteristics of Gangetic mystus (Table 3). At the end of the 45-day feeding trial, fish fed diets supplemented with various levels of synbiotics exhibited significant (p < 0.05) increases in villi length, villi width, goblet cell numbers, hepatic cell numbers, and muscle cell numbers compared to the control group (T0). Among the dietary treatments, the group receiving the highest dose of synbiotics (T3) demonstrated the most substantial improvements in all assessed parameters when compared to the groups receiving lower synbiotic doses (T1 and T2). Figures 2 and 3 show that 8% dietary synbiotics significantly increased villi length, width, and goblet cell count compared to the control group. Villi were longer and wider, and goblet cell numbers were higher in the 8% synbiotic-supplemented group, indicating enhanced intestinal structure and function.
| Parameter | T0 (0%) | T1 (4%) | T2 (6%) | T3 (8%) |
|---|---|---|---|---|
| Initial villi length (µm) | 103.33 ± 0.27 | 103.08 ± 0.17 | 103.26 ± 0.15 | 103.19 ± 0.78 |
| Villi length at 45th day (µm) | 154.91 ± 0.55d | 236.21 ± 0.43c | 270.77 ± 0.40b | 308.35 ± 0.93a |
| Initial villi width (µm) | 15.25 ± 0.18 | 15.70 ± 0.19 | 15.56 ± 0.10 | 15.74 ± 0.13 |
| Villi width at 45th day (µm) | 21.73 ± 0.11c | 26.52 ± 0.05b | 28.06 ± 0.08b | 31.34 ± 0.11a |
| Initial goblet cells (mm)2 | 187.07 ± 0.89 | 186.13 ± 0.91 | 183.73 ± 0.80 | 184.87 ± 1.10 |
| Goblet cells at 45th day (mm)2 | 227.93 ± 0.54d | 276.20 ± 0.60c | 316.00 ± 0.79b | 352.27 ± 0.97a |
| Number of initial hepatic cells | 153.40 ± 0.60 | 154.40 ± 0.72 | 154.60 ± 0.67 | 154.33 ± 0.65 |
| Number of hepatic cells at 45th day | 191.60 ± 0.41d | 208.20 ± 6.02c | 233.27 ± 0.43b | 250.13 ± 0.31a |
| Number of initial muscle cells | 23.93 ± 0.51 | 24.93 ± 0.51 | 24.47 ± 0.38 | 23.93 ± 0.52 |
| Number of muscle cells at 45th day | 45.53 ± 0.27d | 55.13 ± 0.27c | 63.93 ± 0.25b | 72.13 ± 0.38a |
- Note: The data are presented as the mean ± SD (n = 7). Superscript letters (a, b, and c) indicate significant differences (Duncan’s test, p < 0.05) within a row. T0, T1, T2, and T3 refer to dietary treatments with different levels of synbiotics.
3.3. Histology of Liver and Muscle
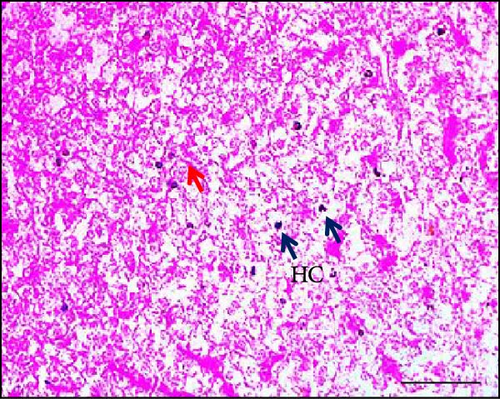
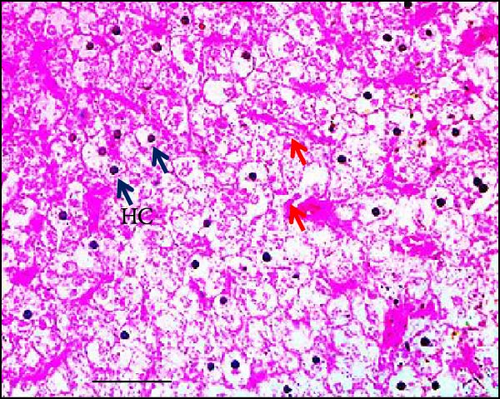
The results of the study on the effects of dietary synbiotics on hepatic cells in Gangetic mystus revealed that the initial counts of hepatic cells were quite similar across the different treatment groups. However, after 45 days, significant differences emerged in the hepatic cell counts among the groups (Table 3). The group receiving the highest level of dietary synbiotics (T3) exhibited the greatest increase in hepatic cell numbers, whereas the control group, which did not receive any synbiotics, showed the least growth. Additionally, numerous flattened von Kupffer cells were observed (Figure 4). Statistical analysis confirmed that these differences were significant, with clear distinctions between the groups in terms of hepatic cell proliferation. This indicates that dietary synbiotics have a substantial impact on hepatic cell development in this species.
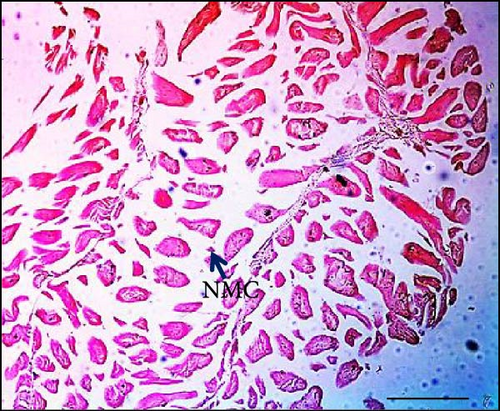
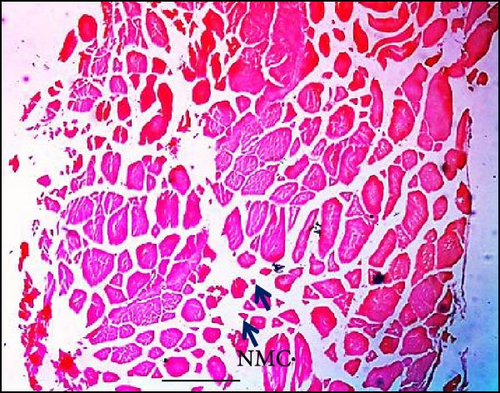
The impact of dietary synbiotics on muscle cells in Gangetic mystus was evaluated, with the findings detailed in Table 3. The group without synbiotics showed a lower muscle cell count compared to the groups receiving synbiotics, where the counts increased progressively with higher levels of supplementation (Figure 5). The group with the highest synbiotic intake had the greatest muscle cell count, and this result was significantly different from those of the other groups.
4. Discussion
The results of this study provide valuable insights into the effects of dietary synbiotics on the growth performance, muscle cell proliferation, and intestinal histomorphology of Gangetic mystus (M. cavasius). The findings reveal a positive impact of synbiotics on several key metrics, which aligns with previous research on their benefits in aquaculture [21, 24–26].
Synbiotics may enhance fish growth by promoting the survival and proliferation of beneficial bacteria in the digestive tract. These bacteria may improve nutrient utilization and stimulate the production of substances that promote growth and health [27]. The progressive improvement in growth parameters with increasing dietary synbiotic levels supports the hypothesis that synbiotics can boost growth performance in fish. Significantly, fish fed diets containing 4%–8% synbiotics demonstrated substantial increases in final body weight, weight gain, DWG, percentage weight gain, length gain, SGR, and FCR compared to the control group, highlighting the beneficial effects of synbiotic inclusion, particularly at higher levels. Our findings demonstrate outcomes that are largely consistent with those of previous studies, which have documented significant enhancements in growth rates across various fish species when their diets were supplemented with synbiotics [5, 28–34]. Improved growth performance in fish fed synbiotics can be attributed to several mechanisms, including enhanced digestive enzyme activity, improved intestinal morphology, and the production of short-chain fatty acids (SCFAs) through synbiotic fermentation by gut microbes. The specific effects of synbiotics can vary depending on the fish species and environmental conditions. Ye et al. [35] demonstrated that feeding Japanese flounder (Paralichthys olivaceus) with combinations of FOS, MOS, and B. clausii resulted in superior growth performance, feed efficiency, and health compared to feeding pre- or probiotics alone. Similar synergistic effects were observed in rainbow trout (Oncorhynchus mykiss) fed MOS and Enterococcus faecalis [36].
The significant increase in villi length, villi width, and goblet cell counts in fish fed with the 8% synbiotic diet compared to the control group provides evidence of improved gut health. The positive effects on villi morphology and goblet cell proliferation suggest that synbiotics contribute to a more robust gut environment, enhancing nutrient absorption and overall digestive efficiency. A healthy gut microbiota promotes the production of SCFAs such as acetate, propionate, and butyrate, which are known to stimulate epithelial cell proliferation and enhance the growth of villi [24, 25]. Goblet cells are often described as the “factories” of secretions in the gastrointestinal tract. Those located in the colonic and small intestinal crypts secrete mucus primarily in response to stimuli like endocytosis or acetylcholine. In contrast, surface colonic goblet cells continuously secrete mucus to maintain the protective inner mucus layer. Despite recent advancements, our understanding of goblet cell function and regulation remains limited [37]. A reduction in villi and deeper crypts can impair gastrointestinal performance, increase secretion, and hinder nutrient absorption [38]. Conversely, increased epithelial cell turnover is associated with longer villi and a higher villus length-to-width ratio, with longer villi linked to more active mitosis [39]. Additionally, synbiotic supplements may enhance mucin secretion from the intestinal mucosal surface, helping to inhibit harmful microorganisms [40]. These supplements have also been shown to increase the number of goblet cells, which produce lipoprotein-rich mucins that directly support digestion and gut immunity [41, 42].
Histological examination of liver tissue revealed that synbiotic supplementation positively influenced hepatocyte health, characterized by increased cell numbers, more regular nuclear shapes, and reduced intercellular distances. These findings suggest that synbiotics enhance liver architecture and function, corroborating the findings of Ruiz et al. [43] regarding hepatocyte regeneration and improved liver function. Recognizing the liver’s critical role in both metabolism and immune surveillance [44], studies have highlighted its active role in immune responses [45]. The observed increase in von Kupffer cells in the liver of treated fish provides evidence for the immunomodulatory effects of synbiotics. Activation of these cells triggers the recruitment of other immune cells [46]. This morphological evidence of von Kupffer cell presence in fish livers aligns with observations in trout upon challenge [47]. Additionally, studies on tilapia fish have demonstrated that synbiotics positively affect the maximum density of capillaries and fibers in muscle tissue. Specifically, our experimental fish receiving high doses of synbiotics (8%) exhibited the highest percentage of normal muscle cells compared to controls. This research confirms the relationship between pathological changes and the muscle’s blood supply. Increased cell proliferation and cytoplasmic extent indicate increased growth. Research has demonstrated that synbiotics can positively affect muscle histomorphology [24], potentially benefiting muscle cell proliferation and overall health in tilapia.
The findings of this study underscore the potential of synbiotics as a dietary supplement to improve the growth performance and health of Gangetic mystus. The significant benefits observed in growth rates, gut morphology, and muscle developments suggest that incorporating synbiotics into aquaculture diets could enhance the efficiency and productivity of fish farming practices. By employing innovative feeding strategies that include synbiotics, aquaculture practitioners can potentially achieve better growth outcomes and enhance fish well-being, thereby contributing to the economic viability of aquaculture in South Asia.
5. Conclusion
Incorporating synbiotics at an 8% level into the diet of Gangetic mystus resulted in significant improvements in growth performance, intestinal morphology, and muscle cell development. The enhanced effects observed at higher synbiotic levels suggest that synbiotics could be an effective nutritional approach to promote fish health and boost aquaculture productivity. Future research should focus on determining the long-term effects of synbiotics across different fish species and environments to effectively apply them in sustainable aquaculture practices.
Disclosure
The authors alone are responsible for the content and writing of the paper.
Conflicts of Interest
The authors declare no conflicts of interest.
Funding
This work was supported by a grant from the Ministry of Education (MoE) (ID LS20201284), Peoples Republic of Bangladesh, Bangladesh.
Acknowledgments
This work was supported by a grant from the Ministry of Education (MoE) (ID LS20201284), Peoples Republic of Bangladesh, Bangladesh.
Open Research
Data Availability Statement
All data underlying the results are available as part of the article and no additional source data are required.


