Acute Thermal Sensitivity Varies Among Full Sibling Families of Atlantic Salmon
Abstract
Atlantic salmon production constitutes a growing industry in the United States and is largely reliant upon cage-culture in which fish are cultivated within enclosed nets or pens in environmental settings that are prone to natural variation. Temperature fluctuation in particular can substantially inhibit or accelerate production. Here we investigate the larval respiratory capacity (respiratory Q10) among pedigreed families of Atlantic salmon (Salmo salar) spawned in a hatchery facility exposed to acute thermal stress. Individual larvae from full-sibling families were incubated at three temperatures along a 10°C thermal gradient (6, 12, and 16°C) in calibrated respiration chambers and linear declines in oxygen content were used to determine individual respiration rates and family-based Q10. Metabolites from the tricarboxylic acid (TCA) pathway, a key pathway involved in cellular energy supply, were quantified in preserved whole tissue from each larval family using liquid chromatography tandem mass spectrometry (LC-MS/MS) to identify potential biochemical markers associated with thermal sensitivity. Clear family × environment interactions were observed, whereby some larval families exhibited negative rate-increases with warmer environments as opposed to others that exhibited enhanced respiration rates. Neither total metabolite content nor the abundance of single metabolite(s) were associated with family-specific trends in respiration rate with temperature. Our findings highlight the use for identifying contrasting phenotypes among pedigreed families of Atlantic salmon and their potential in selective breeding programs for tolerance to dynamic environmental conditions.
1. Introduction
Atlantic salmon (Salmo salar) cultivation is a growing industry in the US [1–3] and S. salar is one of the top 10 fish produced worldwide [4]. The culture of this species is largely restricted to regions where temperature regimes are within the narrow thermal tolerances suitable for their growth and reproduction (e.g., 8–14°C) [1, 5]. While salmon can inhabit a variety of temperatures (4– to >22.5°C), conditions greater than 18°C can significantly slow production [6, 7]. There is currently no commercial or recreational fishery for Atlantic salmon in the United States and as such all US supplies are farm-reared from commercial and stake-holder operated facilities. Products are shipped worldwide and are an increasingly popular option when wild-catch salmon species are unavailable [4, 8, 9]. Efforts to improve growth rate and disease resistance through selective breeding have shown promise [1, 10], yet the inclusion of other relevant production-enhancing traits have yet to be identified. Selective breeding has substantially impacted food production in terrestrial agriculture [11–13] over the past century and similar methodology may help to expand aquaculture production [3, 10, 14, 15].
A limitation for some aquaculture practices are the dynamic environments [16, 17], in which organisms are cultured during large portions of their life-cycle. Many species are cultivated within net pens or cages deployed in coastal environments [5, 18, 19]. In these environmental settings, cultured species are subject to diel and seasonal fluctuation in conditions (e.g., variation among salinity, temperature, dissolved oxygen, food availability, etc.). Temperature, a main factor dictating growth in ectothermic animals [20–23], can exhibit large seasonal variation. Temperate coastal habitats, along western-boundary currents, are regions rich in aquaculture, are highly dynamic, and can exhibit seasonal variation in temperature >20°C [24–27]. Warming in these zones, associated with climate variability, has also been linked to declines in fisheries yield [28, 29], changes in species distribution [30, 31], and changes in phenology [32], all of which have cascading negative socioeconomic impacts on fisheries and coastal communities.
The sustained production of food remains a primary focus of all developed and developing populations across the globe. Rapid population growth correlates directly to an increased food demand and current estimates suggest 815 million individuals are currently undernourished [33, 34]. The global population is expected to increase to approximately 10 billion individuals by 2050 (United Nations; population.un.org), a corresponding increase in food demand of 35%–56% [35]. Securing sustainable and diverse sources of nutrition will improve our ability to maintain a potent food supply during periods of socioeconomic uncertainty and increased food strain. The potential for “Blue Foods” to contribute to the global food supply has been of growing interest based upon their nutritional value [36], propagation rate [37], and feed conversion efficiency relative to terrestrial-based animal protein [38, 39]. With regard to the environment, “Blue Foods” represent potential for expanded and sustained production of food with less greenhouse gas emission and a relatively low environmental burden [33].
The purpose of this work is to examine respiratory responses among full-sibling families of hatchery-reared larval Atlantic salmon subjected to acute thermal stress. For ectothermic organisms, metabolism and other rate-sensitive biochemical processes (e.g., protein synthesis, ion homeostasis, development, etc.) restrict growth and development and are impacted by temperature. Linking observed phenotypic differences to known genetic variation is a first step in implementing trait-based selection and early-life stage responses to varying environmental conditions may provide insight as to performance and yield at later-life stages. Identification of strains of organisms that can sustain energetic demands associated with acute and chronic thermal stress and the mechanisms by which they do so, may enable their integration into future selective breeding programs. Currently, the National Cold Water Marine Aquaculture Center (NCWMAC) in Franklin, ME operates a S. salar breeding program, where pedigreed families are generated and maintained in recirculating aquaculture systems (RAS) during their early-life stages and grown to broodstock [10]. Individual larvae from full-sibling families were exposed to acute thermal stress at three temperatures along a 10°C gradient (6, 12, and 16°C), resulting respiration rates and corresponding Q10 values, and indication of thermal sensitivity, were determined for each larval family. To provide potential biochemical insight into family differences in respiration Q10, metabolites within the tricarboxylic acid cycle (TCA cycle: a major cellular energy production pathway) were quantified among salmon families using liquid tandem mass spectrometry (LC-MS/MS).
2. Methods
2.1. Larval Salmon
Larval salmon were generated at the NCWMAC (Franklin, ME, USA) from specific sire × dam crosses of adult broodstock. Briefly, eggs collected from individual female-broodstock were fertilized by sperm collected from individual male-broodstock in controlled laboratory conditions. An incubation system was used to keep families separate and to rear early life-stages until first feeding (see details in [10]). Individuals from 10 randomly-selected full-sibling families were included (3-month post-fertilization) in respiration rate assays. All individuals were pre-absorptive and not feeding exogenously, hence, “respiration rate” is used to refer to rate-based measurements in lieu of “standard” respiration rate as individuals in this study are at life-stages and under conditions that are not relevant to those general definitions [40, 41]. All animals were handled according to guidelines established by the National Research Council’s Guide for the Care and Use of Laboratory Animals [42].
2.2. Respirometry
Individuals (n = 150) were from 10 full-sibling Atlantic salmon families (n = 5 family−1 temperature−1) and incubated in 14 ml individually-calibrated micro-respiration vials with glue-on sensor spots (Pyroscience, DEU). Larvae were carefully transferred to vials filled with temperature-equilibrated filtered water (0.2 µm) and allowed to acclimate to vials for 30 min before the start of assays. Declines in oxygen content were quantified using a non-invasive optical-based sensor (Pyroscience, DEU; Firesting GO2) and used to calculate individual- and family-specific respiration rates (µg O2 min−1 larvae−1) at each temperature (6, 12, and 16°C). Each assay persisted for 15–20 min (depending on incubation temperature), during which respiration vials were maintained in temperature-controlled water baths without visual separation to minimize stress. Oxygen concentration within vials were monitored every 3–5 min (depending on exposure temperature). Blank vials, consisting of respiration chambers containing filtered (0.2 µm) water only, were included to correct for background changes in oxygen content, used to correct respiration rate measurements, and were negligible (<1% of observed oxygen declines).
2.3. Q10
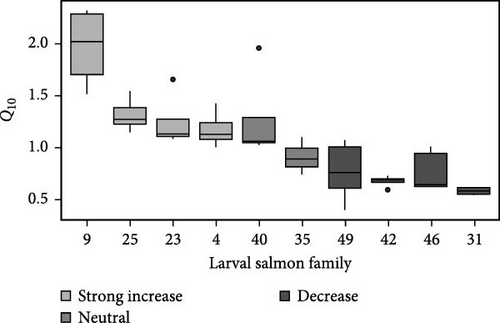
Respiration Q10 (an indication as to the degree by which a rate-process is impacted across a thermal gradient [43, 44) was determined for each larval family from mass-normalized respiration rates (n = 5; Figure 1) at 6 and 16°C using the following formula:
2.4. Liquid Chromatography (LC)/MS Standards
Standards for the TCA metabolites measured in this study (Table 1) included malic acid, α-ketoglutaric acid, citric acid, fumaric acid, and succinic acid (Sigma–Aldrich, USA; all ≥99% purity). All compounds were paired with internal standards that had the same or very similar chemical composition for quantification (citric acid-d4, fumaric acid-d4, succinic acid-d6, Cambridge Isotopes, USA; 98% purity).
| TCA metabolite and standard (IS) | RT (min) | Polarity | Precursor (m/z) | Product (m/z) | Fragmentor (V) | CE (V) |
|---|---|---|---|---|---|---|
| Malic acid | 3.5 | Negative |
|
|
|
|
| α-ketoglutaric acid | 4.0 | Negative |
|
|
|
|
| Citric acid | 4.6 | Negative |
|
|
|
|
| Citric acid d4 (IS) | 4.6 | Negative | 195 | 113 | 78 | 9 |
| Fumaric acid | 5.3 | Negative |
|
|
|
|
| Fumaric acid d4 (IS) | 5.3 | Negative | 117 | 29 | 72 | 10 |
| Succinic acid | 6.2 | Negative |
|
|
|
|
| Succinic acid d6 (IS) | 6.1 | Negative | 121 | 77 | 78 | 11 |
- Abbreviations: CE, collision energy; RT, retention time.
2.5. LC/MS Sample Preparation
Larvae, from each family (n = 5) the end of ambient temperature treatment (12°C) assays, were immediately flash-frozen, freeze-dried (Labconco Corp., USA; FreeZone Triad), and stored (−80°C) until analysis. For extraction, larvae were macerated using sterilized razor blades and homogenized with a bead homogenizer (5 mm beads) in 1 ml of methanol (LC/MS Grade) with 100 µl of a 1 ng µl−1 internal standard. After homogenization, samples were sonicated for an additional minute. Sample homogenates were then centrifuged (13,000 × g for 5 min) and supernatant transferred to sample tubes containing 1 ml of a prechilled 70% MeOH solution to precipitate proteins from the supernatant. Samples were stored at 4°C overnight, centrifuged (13,000 × g for 5 min), and supernatant transferred into 10 mm × 75 mm glass culture tubes. Remaining liquid was removed using a TurboVap II (Biotage, USA) evaporator and dried samples were reconstituted in 200 µl of MeOH, centrifuged (10,000 × g for 5 min), transferred into 2 ml amber vials, and stored at −80°C until analysis.
Calibrants were prepared in blanked S. salar plasma and processed along with samples. All plasma was collected from immature individuals and loaded onto Agilent Bond Elut LMS 500 mg, 6 ml straight barrel solid phase extraction (SPE) cartridges (Agilent, USA) to remove steroid hormones. A 17-point calibration curve (0.1, 0.2,0.5, 1, 2.5, 5, 10, 25, 50, 100, 250, 500, 1000, 2500, 5000, 10,000, and 15,000 ng ml−1) composed of all native standards (Table 1) was established with the addition of 100 µl of internal standard at a concentration 1 ng µl−1. The calibration curve was analyzed with each sample to account for analytical drift. The quantitation of compounds was determined by a 1/x weighted linear regression analysis of the ratios of analyte area to the area of designated internal standard. All calibration curves were linear (R2 ≥ 0.99) and interassay accuracy was confirmed by including a blank matrix sample with each sample extraction.
2.6. LC/MS Instrument Method
Aliquots (5 µl) were injected into an Agilent 1290 Infinity II ultrahigh pressure liquid chromatographer (UHPLC) through a Roc Phenyl Hexyl column (3 µm, 150 mm × 4.6 mm) for compound separation. A gradient with two mobile phases, (A) water with 0.2% formic acid and (B) methanol with 0.2% formic acid were delivered at 0.6 l min−1. The gradient is as follows: 0–3 min 5% B, 3–13 min increased to 32% B, 13:10–15:10 to 95% B, and 15 : 11-18 min 5% B. Mass spectral analysis was conducted using an Agilent 6475 triple quadrupole LC/MS (Agilent, USA) and ionization achieved with an Agilent Jet Stream (AJS) source in negative mode. Drying gas temperature was set at 150°C with a flow of 11 l min−1, sheath gas temperature was set to 350°C and flow established at 11 l min−1. The nebulizer pressure was 40 psi, capillary voltage 2.5 kV, nozzle voltage at 500 V, and the collision cell accelerator voltage (CAV) at 5 V. Columns were maintained at ambient temperature (20°C) and detection and quantitation of all metabolites were accomplished using multiple reaction monitoring (MRM) with a minimum of two transitions per compound (Table 1).
2.7. Data Analysis
Family-specific calculations of Q10 and TCA metabolite contents were compared using a one-way analysis of variance (ANOVA) with family as a fixed effect. To compare respiration rates among families with temperature, an analysis of covariance (ANCOVA) was used with family as a fixed effect and temperature as a covariate. Mean respiration rates and individual TCA-metabolite content among full-sibling families were compared using a one-way ANOVA with family as a fixed effect. When significant differences were observed, a Tukey’s honest significant difference (Tukey) test was performed to assess multiple comparisons. All assumptions of normality and equal variance were verified using Shapiro–Wilk’s and Levene’s Tests, respectively. Results were deemed significant at α ≤ 0.05. Vertical error represents ±one standard error.
3. Results
3.1. Respirometry
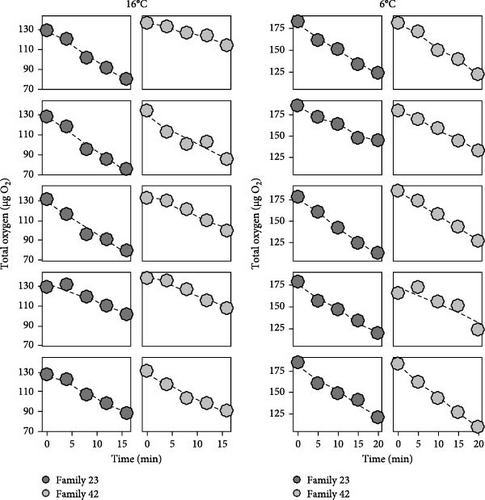
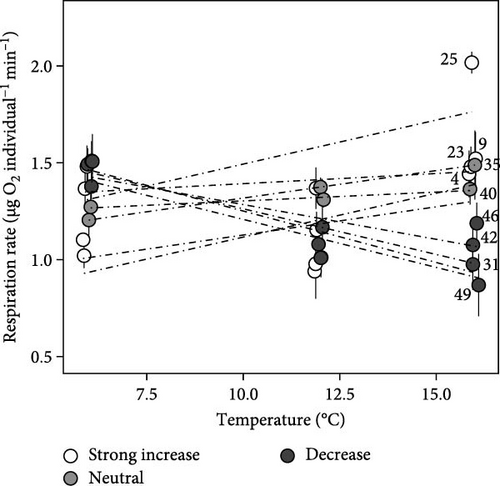
Among larval respiration vials, oxygen concentrations exhibited linear (all r2 > 0.80) declines with incubation time and did not fall below 50% saturation (Figure 2). The mass (g) of larvae did not vary among temperature (F2,116 = 0.75; p > 0.05; ANOVA) or among family-temperature treatment combinations (F18,116 = 1.5; p > 0.05; ANOVA), hence, rates of oxygen consumption per individual are shown. In general, acute thermal sensitivities were low and exhibited strong family variability (Figure 3). Mean respiration rate among salmon families at 6°C was 1.33 ± 0.04 µg O2 min−1 individual−1. At 16°C, mean respiration rates increased to 1.36 ± 0.05 µg O2 min−1 individual−1. When variance was partitioned among families, significant differences were observed (ANCOVA; F9,135 = 2.88; p < 0.01) with certain families responding positively to temperature increases with others responding little or negatively (Figure 3). Specifically, family 25 displayed greater respiration rates with temperature (2.02 ± 0.06 µg O2 min−1 individual−1 at 16°C; Figure 3) and were significantly (p < 0.05; Tukey) different than families 4, 9, 31, and 49. Family 4, exhibited the next greatest rates of respiration with temperature (1.30 ± 0.18 µg O2 min−1 individual−1 at 16°C; Figure 3), but were not significantly (p > 0.05; Tukey) different than rates among the other salmon families. Families 49, 31, 42, and 46 exhibited negative rate-increases when exposed to acute thermal stress (Figure 3).
3.2. Family Q10
Determination of respiration Q10 yielded significant (F9,33 = 11.5; p < 0.001; ANOVA) family effects with individual values ranging from 0.40 to 2.32. Family-specific Q10 was determined and rank-ordered by response (Figure 1). Four families exhibited Q10 values >1 (families 9, 25, 23, and 4), while two families responded neutrally with Q10 values approximately 1 (families 35, and 40; Figure 1). Four families exhibited Q10 < 1 across the acute thermal gradient included. Families 9 and 25 had the greatest mean Q10 values of 1.97 and 1.31, respectively (Figure 1), with family 9 exhibiting significantly greater Q10 values than all other families (all p < 0.05; Tukey). Family 25 displayed significantly (p < 0.05; Tukey) greater Q10 values than families 31, 35, 42, 46, and 49.
A higher respiratory Q10, in the current study, was associated with an ability to exhibit lower respiration rate at cooler temperatures (Figure 3). For example, families 31, 42, and 46 exhibited Q10 values substantially below one and respiration rates (mean = 1.5 ± 0.07 µg O2 min−1 individual−1; Figure 3), among these families at 6°C, were significantly higher (F9,39 = 3.71; p < 0.001; ANOVA) than respiration rates exhibited by family 9 (p < 0.05; Tukey) at 6°C, the family with the highest Q10. Rather, the families (9, 25, and 23) that exhibited slower respiration rate (1.33 ± 0.07 µg O2 min−1 individual−1; Figure 3) at colder temperature exhibited the ability to increase rate with warmer temperature (Figures 1 and 3) displaying Q10 > 1.
3.3. Family-Specific TCA-Metabolite Contents
Total metabolite concentration among larval salmon families was relatively high (e.g., 600–1000 ng mg−1; Figure 4a). Five different metabolites from the TCA-cycle were quantified in each of the larval families at ambient temperature and exhibited broad individual- and family-variability (Figure 4a–f). Total contents of malate (Figure 4b), α-ketoglutarate (Figure 4c), citrate (Figure 4d), fumarate (Figure 4e), and succinate (Figure 4f) were quantified and summed across each larval family (Figure 4a–f). Significant (F9,34 = 4.23: p < 0.001; ANOVA) differences in total metabolite content were observed but were not associated with observed respiratory Q10 potential. While families 9, 25, and 23 had higher metabolite content (~1000 ng mg−1; Figure 4a) than some families and greater respiratory responses to acute thermal stress, families 4 and 49 had similar metabolite content (Figure 4a) and significantly lower Q10.
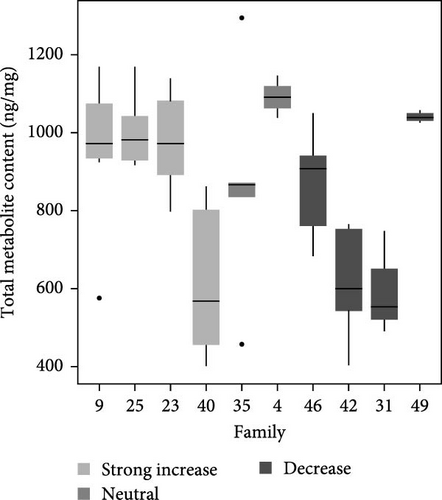
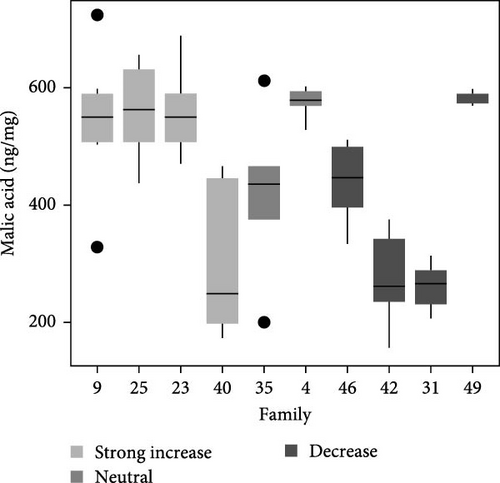
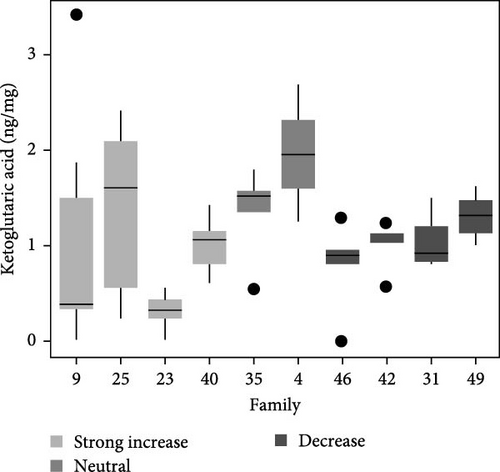
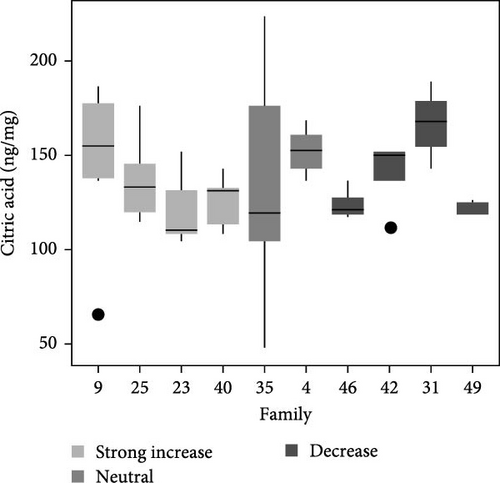
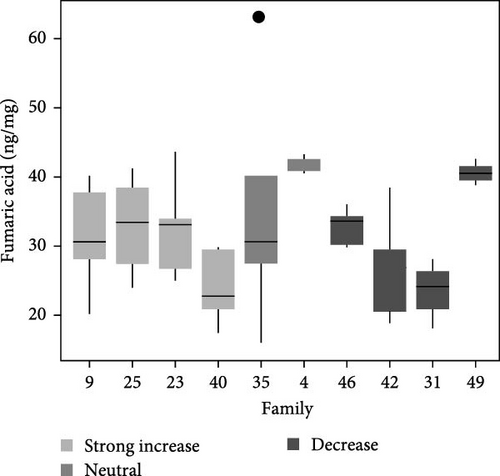
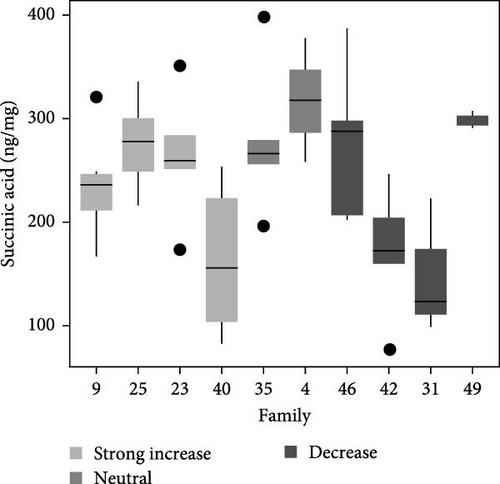
Similarly, differences in single metabolite contents were observed among salmon families (Figure 4b–f) and were not associated with Q10 responses. For example, malic acid content varied significantly among larval salmon families (F9,34 = 6.4; p < 0.001; ANOVA). Families 9, 23, and 25 exhibited contents ranging from 475 to 625 ng mg−1 (Figure 4b), contents significantly (p < 0.05; Tukey) greater than families 31 and 42, both of which exhibited Q10 values below 1. Family 49, however, exhibited similar (p > 0.05; Tukey) malic acid content to families 9, 23, and 25, yet Q10 was similar to families 31 and 42. Family 49 exhibited relatively high contents for all metabolites analyzed with overall content similar or greater to those observed by families 9, 25, 23, and 4 (i.e., families with positive Q10), yet observed Q10 values among this family were below 1 (Figure 1). The presence or absence of TCA metabolites did not account for increased or decreased respiratory capacity (Q10).
4. Discussion
Significant differences in family-based Q10 were observed, whereby some families exhibited a positive-rate response, while some larval salmon families exhibited negative ones. This ability was associated with plasticity in respiration rate, specifically some families exhibited a greater ability to conserve respiration rate at low temperature and increase rates with warming temperature. On the contrary, families with higher respiration rate among low-temperature treatments were less sensitive to warming (relatively lower Q10). Findings highlight family- and genotype-environment interactions observed among already-established sources of known genetic variation and their potential for use in selective breeding efforts. The ability to observe phenotypic plasticity in energy supply (i.e., respiration and metabolic rate) during periods of stress may prove to be a useful early biomarker in identifying strains or species of aquaculture products that can meet the increased energetic demands associated with warmer environmental conditions [45–47].
Most physiological and biochemical rate-processes exhibit Q10 values of 2–3 [48–51], indicating a two- or three-fold increase in overall rate with temperature. Comparatively, Q10 values among pre-absorptive salmon larvae were low. The pooled family mean yielded a Q10 of approximately 1 and individual-specific Q10 values ranged from 0.40 to 2.32. Previous investigation of respiration Q10 for Atlantic salmon have yielded similar observations (1.2–2) as those reported here [52, 53]. The Atlantic salmon is adapted to survive in a variety of habitats [54]. Under optimal conditions, growth rates can be rapid and commercial yields profitable [55, 56]. However, the culture of this species may be limited by varying decadal and nondecadal climate forcings [28, 57, 58] and its limited capacity to respond to thermal stress as demonstrated by a relatively low respiration Q10. Results also suggest that the low Q10 values determined in the current study are not necessarily reflective of a unique bottleneck in their early development given similar Q10 values for later life-stages that have been reported in the literature [52, 53]. The identification of genotypes that are tolerant to acute and chronic thermal stress may have implications for the future expansion of Atlantic Salmon aquaculture into areas previously thought to be too warm. In addition, thermally-robust phenotypes will help to mitigate losses due to anomalous warming events.
There is a wealth of information regarding the responses of “wild-type” and pedigreed salmon (and other fish species) to chronic versus acute thermal stress [59–61] with recent studies observing significant differences in thermal responses among families of post-smolt Atlantic salmon [62, 63]. In addition, acclimation to warm temperature over long periods of time (such as those likely to occur in the environment) has allowed for the ability of certain organisms to acclimate to adverse conditions including thermal stress [59, 64]. Similarly, studies have demonstrated that previous exposure or repeated exposure to stress can offer protective benefits [65, 66] and others have demonstrated eggs pretreated with cortisol may be more suited to cope with thermal stress upon fertilization and later life-stages [67, 68]. Regardless, family-specific differences were observed and future work should identify how these traits are expressed throughout ontogeny and differ by family at later-life stages. Whether the performance of early larval (pre-absorptive) salmon is predictive of performance at later life-stages has yet to be determined. In addition to the expression of traits throughout development, the inheritance of these traits (i.e., additive and non-additive) has yet to be understood. Whether complex traits such as metabolic performance, likely the result of multiple gene variations, can be inherited additively is not currently known. In bivalve models, the inheritance of Q10 traits has demonstrated nonlinearity [69, 70].
While energy supply ([i.e., metabolic rate [µJ time−1]) is a major fitness-determining factor, the allocation of energy is critical. In pedigreed-families of Pacific oyster, the ability to supply energy varied with temperature in addition to quantified rates of protein synthesis [69]. Certain larval families were able to increase respiration rates in warmed environments, but protein synthetic rates were also highly sensitive. The result was an unsustainable allocation of energy (>75%) towards a single cellular process and rendering less for other rate-processes (e.g., RNA/DNA synthesis, ion-homeostasis, calcification, etc.) that are impacted [69, 71]. Other families exhibited sensitivity to warming with regard to respiration yet were less sensitive with regard to protein synthetic rates (energy demand) allowing a more sustainable strategy for energy allocation and was associated with more rapid growth and development [69]. Hence identifying trends in respiration rate (i.e., energy supply) is a first-step in identifying individuals that are robust to dynamic environments and trends in protein metabolism, in particular, may be a strong factor determining resistance to acute and chronic thermal stress [69, 71, 72].
No significant differences in total or individual TCA metabolites were observed that correlated with observed physiological performance. Preceding respirometry measurements may have impacted baseline metabolite content due to the potential stress associated handling, nonetheless consistent sampling revealed broad family-specific responses. While significant differences were observed between families, a higher respiration rate (or low) was not explained by the contents detected between full-sibling families at ambient temperature. Specifically, family 49 exhibited similar metabolite profiles as families 9, 25, and 23 (Figure 4a–f) yet exhibited significantly different Q10 responses. Further, while some substrates displayed lower content among families compared to others, these differences did not account for differences in observed phenotype. Metabolomic profiling has become a rapidly growing field of study among aquaculture [73, 74] and Atlantic salmon in particular [75]. Identifying differences in metabolomic signatures show promise in assessing function among biochemical pathways in addition to the identification of important biomarkers. While previous studies with Atlantic salmon [76], through quantification of metabolites, have identified temperature-dependent responses in regard to glutamine, tyrosine, and phenylalanine (all substrates involved in energy metabolism) content, more information is needed to determine if and how substrate content within the TCA cycle can be used to assess and predict larval phenotype at a single temperature. The relationship between metabolite content(s) and observed respiratory activities are likely nonlinear, vary with time and tissue-type [74, 75], and based upon previous work [21, 77–79], energy production is likely the result of multiple enzyme activities working in concert to manipulate energy substrates. While general substrate content may be necessary for physiological performance, absolute content may not be the limiting factor influencing increased respiration rate with temperature for pre-absorptive larvae.
Aquaculture industries are reliant upon highly-dynamic coastal systems and selective breeding shows promise to mitigate stresses associated with production [3, 14]. In the North Atlantic, multiple sources of climate variability have been described including Arctic Oscillation (AO), Atlantic Meridional Mode (AMM), North Atlantic Oscillation (NAO), and Atlantic MultidecadalOscillation (AMO), each manifesting on different time-scales and impacting regional climate patterns [80–84]. AMO, defined in terms of sea surface temperature anomaly from 0 to 60°N [85], has large-scale impacts on sea surface temperature and alternates between warm (i.e., positive) and cold (e.g., negative) phases on 65–70 year cycles [86]. Sea surface anomalies, associated with warm phases of AMO, have been correlated to reductions in growth and population abundances of stocks of northeast Atlantic salmon [58, 28, 81] and other commercially important fish stocks. NAO, an index based upon pressure gradients between the Azores (subtropical high-pressure) and Iceland (polar low-pressure), has dramatic impacts on air–sea heat flux resulting in variations in sea surface temperature [81, 84, 87]. Shifts between warm phases (periods of higher pressure differential) and cold phases (periods of relatively low pressure differential) of the NAO occur on decadal cycles and has large impact on distribution, growth, and survival of many marine species in the North Atlantic [88], including northeast Atlantic salmon stocks [57]. Varying modes of climate variability occur and have occurred in the past [89, 90] and warming as a result of these transitions pose limitations towards commercial production of aquacultured species as well as fisheries landings [31, 58, 81]. The identification of species or specific strains of species capable of withstanding dynamic environmental conditions may improve our ability to produce food in marine environments.
5. Conclusion
A first obstacle for trait-based selection within breeding programs is to identify contrasting phenotypes among a population with known genetic variance. While future work regarding the expression of respiratory traits throughout ontogeny and the inheritance of complex traits is clearly needed, respiration rate Q10 was a useful and sensitive biomarker in identifying contrasting respiration phenotypes among different families of Atlantic salmon. Future work should seek to identify how other biochemical rate-processes are impacted along a thermal gradient to reveal energy allocation strategies that confer faster growth and production. Results highlight the potential to survey standing genetic variation among salmon breeding programs for the identification of product-enhancing traits that can be used to increase aquaculture yields.
Disclosure
The inclusion of trade names in this manuscript is solely for the purposes of scientific clarity and does not imply endorsement. USDA is an equal opportunity employer.
Conflicts of Interest
The authors declare no conflicts of interest.
Funding
Funding for this work was provided by the USDA ARS CRIS project 8030-31000-005-000-D.
Acknowledgments
The authors wish to acknowledge the professional staff at the NCWMAC for assistance with all aspects of animal husbandry.
Open Research
Data Availability Statement
All primary data are available upon reasonable request.


