Early Identification of Trait Profiles on Local Indonesian Mungbean (Vigna radiata L.) Varieties Revealed by Genotype by Yield ∗Traits
Abstract
Variety (VR) profiling between yield and other traits over multiple seasons is very important to identify superior lines. The goals of this study were to determine the relationship between various traits and to profile local mungbean accessions under two growing seasons. Field experiments were carried out in a randomized complete block design (RCBD) with two replications at the Ciparanje Experimental field, Faculty of Agriculture, Universitas Padjadjaran (UNPAD), Sumedang Regency (West Java, Indonesia). Thirty-six local mungbean VRs from two semi-arid regions of Indonesia (Nusatengara Timur [NTT] and Maluku Barat Daya [MBD]). Data were analyzed by genotype by traits (GTs) biplot, genotype by yield ∗traits (GYTs) biplot, and superiority index (SI). Based on GT biplot, the yields were positively and highly correlated with ash content (AC) and water content (WC) but negatively correlated with carbohydrate content (CC), protein content (PC), and fat content (OC). Based on GYT biplot, all yield-trait combinations were positively correlated with each other, except for OC, which showed negative correlation with other combinations. The trait profiles show that VR6 is located in the peak VR in the sector containing the trait combinations, followed by VR8, VR5, VR7, and VR2. The five VRs performed the best average values for yield and other traits based on the GYT biplot and SI.
1. Introduction
Mung beans (Vigna radiata L.) are a group of legumes (Leguminosae) that contain high protein, essential fatty acids, antioxidants, and minerals. Previous reports stated that mung beans contain polyphenols, peptides, and polysaccharides, which are very good for improving health and can reduce hypertension and prevent cancer [1]. Indonesia is one of the biggest mung bean-producing countries in Asia, with an average production of 316.76 tons per year (www.Pertanian.go.id). The increased productivity of mung beans in Indonesia was due to the increase in production area devoted to the crop [2]. Mung beans are widely used as processed food and raw materials for traditional uses, as well as for the flour industry. Therefore, mung beans have the potential for further improvement in Indonesia.
Nusatenggara Timur (NTT) and Maluku Barat Daya (MBD) provinces were considered as semi-arid regions in eastern Indonesia. It is characterized by a 4-month wet season from December to March with an average annual rainfall of <1500 mm and an 8-month dry season [3]. A short-maturity crop, such as mungbean, is considered as a suitable crop for such a semi-arid cultivation [4]. In both regions, mungbean has been cultivated for generations. Some new modern varieties (VRs) have been introduced but farmers still maintained their favorite local VRs. For example, in NTT, drought-tolerant VRs, such as Fore Belu and Sabu, remain popular, although they only yield less than 0.5 ton/ha [5–7]. Likewise in Moluccas, Yamdena local mungbeans are continuously cultivated as a traditional crop by farmers in Tanimbar island [8, 9]. The check VRs used in this study, Vima 2 (VR29) and Kenari (VR30), are modern VRs developed for high-yield potential but require further validation of their adaptability to semi-arid conditions.
Multiple traits analysis can provide benefits to plant VR selection. However, the magnitude of the interaction between each tested trait against environmental factors has to be considered. Genotype by traits (GTs) biplot analysis has been used previously used to evaluate genotypes and identify superior genotypes based on traits measured [10–13]. This measurement was used by researchers to understand the effect of genotype and environment on the relationship between yield and other traits [14]. However, this measurement can only estimate the relationship between each trait and yield, but it cannot determine the effect of the combined yield by other traits under different environmental conditions. To overcome this, Yan and Frégeau-Reid [14] recently proposed a genotype by yield ∗traits (GYTs) biplot measurement to select genotypes based on yield and other important traits.
The GYT biplot measurement can provide useful information for the evaluation of the genotypes based on various traits tested. This measurement also provides superiority index (SI) that allows breeders to evaluate the genotypes using a wide VR of traits based on the average value of all the traits tested [15]. Several researchers succeeded in selecting plants based on this measurement, including in barley [16], sesame [17], durum wheat [11], and hard red spring wheat [18]. The goals of this study were to select local mungbean VRs from NTT and MBD islands of Indonesia and to profile the traits measured using a GYT biplot.
2. Material and Methods
2.1. Plant Materials
Thirty-six local Mungbean VRs from NTT and MBD were used in this study and grown at Universitas Padjadjaran (UNPAD) experimental station in Sumedang district (West Java, Indonesia) over two seasons. All accessions tested were coded VR (Table 1).
| No. | Code | Origin |
|---|---|---|
| 1 | VR1 | Kisar Island, MBD |
| 2 | VR2 | Kisar Island, MBD |
| 3 | VR3 | Kisar Island, MBD |
| 4 | VR4 | Kisar Island, MBD |
| 5 | VR5 | Kisar Island, MBD |
| 6 | VR6 | Kisar Island, MBD |
| 7 | VR7 | Kisar Island, MBD |
| 8 | VR8 | Kisar Island, MBD |
| 9 | VR9 | Kisar Island, MBD |
| 10 | VR10 | Kisar Island, MBD |
| 11 | VR11 | Kisar Island, MBD |
| 12 | VR12 | Kisar Island, MBD |
| 13 | VR13 | Kisar Island, MBD |
| 14 | VR14 | Kisar Island, MBD |
| 15 | VR15 | Timor Island, NTT |
| 16 | VR16 | Timor Island, NTT |
| 17 | VR17 | Timor Island, NTT |
| 18 | VR18 | Timor Island, NTT |
| 19 | VR19 | Timor Island, NTT |
| 20 | VR20 | Timor Island, NTT |
| 21 | VR21 | Timor Island, NTT |
| 22 | VR22 | Kisar Island, MBD |
| 23 | VR23 | Kisar Island, MBD |
| 24 | VR24 | Kisar Island, MBD |
| 25 | VR25 | Kisar Island, MBD |
| 26 | VR26 | Kisar Island, MBD |
| 27 | VR27 | Kisar Island, MBD |
| 28 | VR28 | Flores Island, NTT |
| 29 | VR29 | Vima 2 (Balikabi) control variety |
| 30 | VR30 | Kenari (Balitkabi) control variety |
| 31 | VR31 | Waitabula, Sumba Barat Daya, NTT |
| 32 | VR32 | Lamboya, Sumba Barat, NTT |
| 33 | VR33 | Melolo, Sumba Timur, NTT |
| 34 | VR34 | Kawis, Lospalos Distrik Iliomar, Kab Lautena, NTT |
| 35 | VR35 | Kawis, Lospalos Distrik Iliomar, Kab Lautena, NTT |
| 36 | VR36 | Kawis, Lospalos Distrik Iliomar, Kab Lautena, NTT |
- Note: Control varieties: VR29 (Vima 2) and VR30 (Kenari) are national improved varieties released by the Indonesian Agency for Agricultural Research and Development (IAARD) and Balai Penelitian Tanaman Aneka Kacang dan Umbi (Balitkabi).
2.2. Data Collection
Yield data was collected during the harvest. Other traits such as MC used Gravimetric method, ash content (AC), protein content (PC), carbohydrate content (CC), and fat content (OC) were collected 1 week after harvest following the method of the Association of Official Analytical Chemist [19]. The experiment was conducted using plots measuring 2 m × 3 m, with 20 plants per plot. Observations were recorded from 10 randomly selected plants per replication.
2.3. Statistical Analysis
3. Results
3.1. GT Biplot on 36 Local Mungbean Accessions
Table 2 shows the traits evaluated from 36 mungbean accessions for two seasons in Sumedang district (West Java, Indonesia). Each genotype has its own advantages in each trait tested. For example, VR35 has the lowest yields but has the highest OC. In contrast, VR6 had the highest yields but had relatively low OC. However, this does not indicate that yield and OC have a strong correlation. Correlations between the traits evaluated are shown in Table 3. Table 3 shows that the yields didnot have a strong correlation with other traits. However, several traits have a strong negative correlation, that is, water content (WC) to CC and CC to PC. This shows that if one trait shows a high value, then the other trait will show a low value.
| No. | Code | Y (kg/plot) | WC (%) | AC (%) | CC (%) | PC (%) | OC (%) |
|---|---|---|---|---|---|---|---|
| 1 | VR1 | 0.06 | 9.20 | 2.80 | 70.69 | 16.44 | 0.87 |
| 2 | VR2 | 0.41 | 11.05 | 3.05 | 67.48 | 17.52 | 0.90 |
| 3 | VR3 | 0.19 | 9.21 | 3.26 | 71.57 | 15.20 | 0.76 |
| 4 | VR4 | 0.05 | 10.20 | 3.12 | 67.12 | 18.76 | 0.80 |
| 5 | VR5 | 0.42 | 8.54 | 3.00 | 68.86 | 18.70 | 0.90 |
| 6 | VR6 | 0.46 | 9.80 | 2.97 | 70.35 | 16.12 | 0.76 |
| 7 | VR7 | 0.41 | 11.20 | 2.89 | 68.76 | 16.20 | 0.95 |
| 8 | VR8 | 0.44 | 9.60 | 3.13 | 68.49 | 18.00 | 0.78 |
| 9 | VR9 | 0.23 | 8.90 | 3.20 | 69.35 | 17.75 | 0.80 |
| 10 | VR10 | 0.27 | 8.75 | 3.21 | 68.59 | 18.54 | 0.91 |
| 11 | VR11 | 0.26 | 10.20 | 3.26 | 71.16 | 14.64 | 0.74 |
| 12 | VR12 | 0.26 | 10.20 | 2.91 | 68.04 | 18.01 | 0.84 |
| 13 | VR13 | 0.34 | 11.50 | 2.76 | 68.64 | 16.20 | 0.90 |
| 14 | VR14 | 0.21 | 10.20 | 3.04 | 68.93 | 16.98 | 0.85 |
| 15 | VR15 | 0.38 | 11.30 | 3.02 | 67.63 | 17.04 | 1.01 |
| 16 | VR16 | 0.35 | 11.50 | 2.85 | 66.72 | 18.12 | 0.81 |
| 17 | VR17 | 0.35 | 11.80 | 3.05 | 67.48 | 16.77 | 0.90 |
| 18 | VR18 | 0.21 | 10.65 | 3.15 | 67.85 | 17.30 | 1.05 |
| 19 | VR19 | 0.27 | 10.53 | 2.95 | 66.06 | 19.34 | 1.12 |
| 20 | VR20 | 0.34 | 11.00 | 2.95 | 67.23 | 18.02 | 0.80 |
| 21 | VR21 | 0.36 | 11.23 | 3.07 | 66.92 | 17.85 | 0.93 |
| 22 | VR22 | 0.40 | 8.90 | 2.87 | 70.76 | 16.45 | 1.02 |
| 23 | VR23 | 0.35 | 8.44 | 2.71 | 71.93 | 16.02 | 0.90 |
| 24 | VR24 | 0.24 | 9.06 | 2.90 | 71.24 | 16.05 | 0.75 |
| 25 | VR25 | 0.27 | 9.12 | 2.79 | 72.99 | 14.22 | 0.88 |
| 26 | VR26 | 0.16 | 10.01 | 2.80 | 70.04 | 16.08 | 1.07 |
| 27 | VR27 | 0.25 | 9.02 | 2.86 | 71.17 | 16.12 | 0.83 |
| 28 | VR28 | 0.19 | 10.77 | 3.07 | 69.15 | 15.97 | 1.04 |
| 29 | VR29 | 0.24 | 8.32 | 2.43 | 68.97 | 19.63 | 0.65 |
| 30 | VR30 | 0.26 | 8.01 | 2.12 | 70.90 | 18.05 | 0.92 |
| 31 | VR31 | 0.21 | 9.46 | 2.85 | 68.30 | 18.25 | 1.14 |
| 32 | VR32 | 0.13 | 9.65 | 2.21 | 67.88 | 18.98 | 1.28 |
| 33 | VR33 | 0.19 | 10.18 | 3.02 | 68.67 | 17.54 | 0.59 |
| 34 | VR34 | 0.02 | 8.16 | 2.54 | 69.79 | 18.09 | 1.42 |
| 35 | VR35 | 0.04 | 9.67 | 2.63 | 68.35 | 17.84 | 1.51 |
| 36 | VR36 | 0.10 | 8.66 | 2.43 | 69.23 | 18.43 | 1.25 |
| Mean | — | 0.26 | 9.83 | 2.89 | 69.09 | 17.26 | 0.93 |
| Stdev | — | 0.12 | 1.06 | 0.27 | 1.62 | 1.28 | 0.20 |
- Abbreviations: AC, ash content; CC, carbohydrate content; OC, fat content; PC, protein content; WC, water content; Y, yield.
| WC | AC | CC | PC | OC | |
|---|---|---|---|---|---|
| Yield | 0.32 | 0.30 | −0.10 | −0.14 | −0.44 |
| WC | — | 0.41 | −0.62 | −0.11 | −0.09 |
| AC | — | — | −0.15 | −0.29 | −0.44 |
| CC | — | — | — | −0.70 | −0.17 |
| PC | — | — | — | — | 0.23 |
- Abbreviations: AC, ash content; CC, carbohydrate content; OC, fat content; PC, protein content; WC, water content.
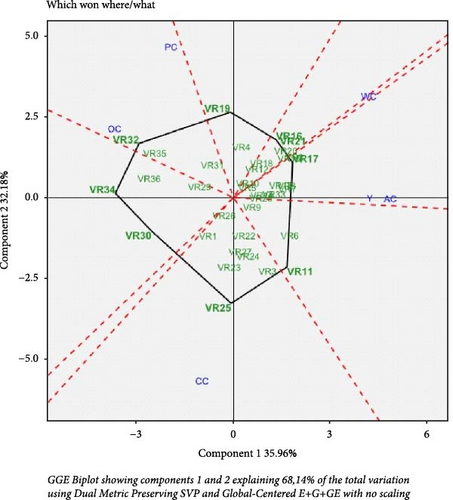
In Figure 1, the GT biplot “which won where” was presented based on data from the two growing seasons. Nine sectors were generated in Figure 1, with the accessions and traits tested in different sectors. Accessions located in the same sector for each trait tested are closely related. VR17 excelled in sector 1 and is correlated with yield, MC (WC), and AC. VR32 excelled in sector 5 and is correlated with PC and OC. VR25 excelled in sector 8 and correlated with CC (WC). Results also showed that the biplot was relatively strong because it represented 68.15% of the total phenotypic variation.
The relationship between traits tested is presented in Figure 2. Traits that have an acute angle (<90°) are positively correlated (have a close relationship) and vice versa. Based on this, yield was positively and highly correlated with AC and MC (WC) but negatively correlated with the CC, PC, and OC, as indicated by their correlation values for each trait (Table 3).
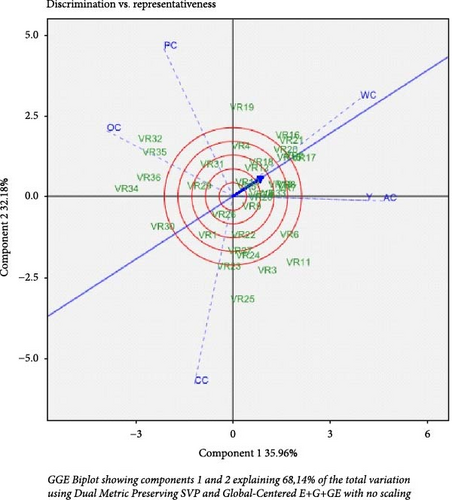
Figure 2 also shows the ideal point, namely the tip of the arrow, which allows the evaluation of the tested accessions based on their proximity or distance to this center. The accessions closest to this point are the most ideal ones. According to Figure 2, VR12 and VR18 were the most ideal because they were closest to the “ideal center,” while VR30, VR34, and VR36 were the least desirable accessions because they were located farthest from the “ideal center.”
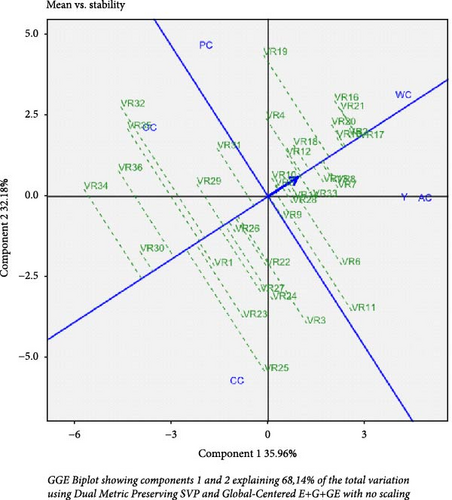
Figure 3 shows the axis of stability (horizontal) and the axis of average (vertical) based on the values of the traits tested. Accessions that were located above the vertical line (in the direction of the arrow) were the expected accessions. However, accessions that were located below the vertical line were the unexpected accessions. On the other hand, the accessions adjacent to the horizontal line were the most stable and vice versa. According to Figure 3, VR2, VR17, VR15, VR8, VR10, and VR5 were the most stable and most referred to because they were located close to the horizontal axis and above the vertical axis. VR25 and VR32 were the least desirable because they were farthest from the horizontal axis and below the vertical axis.
3.2. GYTs Biplot on 36 Local Mungbean Accessions
3.2.1. Trait Profiles of 36 Local Mungbean Accessions
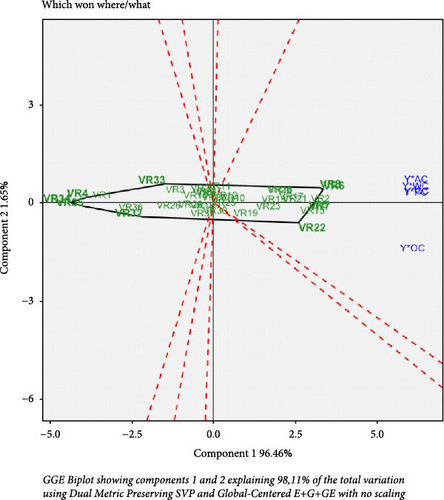
Figure 4 shows the GYT biplot polygon pattern ’which won where’ produced from the combined yield and traits data among 36 local mung bean accessions in two growing seasons. The GYT biplot accounts for 98.11% of the total phenotypic variation. The best accessions per trait profile in each sector were located at the top of the polygon. In this pattern, the GYT biplot was divided into nine major sectors and the combination was in the same sectors. VR6, VR8, VR2, VR7, VR5, VR17, VR21, VR16, VR20, VR13, VR23, and VR22 were located in sector 1 with a combination of AC, PC, WC, CC, and OC, with the VR6 situated at the top of the sector and is the best accession for the combination. VR6 followed by VR8 VR2, VR7, and VR5 accessions had the highest scores for AC, WC, PC, and CC, which means that these accessions were the best at combined yields with AC, WC, PC, and CC (OC). VR22 tends to point toward OC, which means that the accession had the highest score for the combination of yield with OC. VR9 was alone by itself in sector 3. Other accessions were located in the same sector, namely sector 6 with peak accession VR34. The peak position in the sector that does not contain the combination of yield with other traits indicated that the VR34 accession has the lowest value for all the combinations of characters/traits tested. The strong positive correlation between YAC, YWC, and YPC (Figure 5) suggests that selecting genotypes with high ash, moisture, and PC could synergistically enhance yield in semi-arid environments. For instance, VR6 and VR8, which excel in these combinations, are prime candidates for breeding programs targeting drought-prone regions.
3.2.2. Relationship Between Yield-Trait Combinations in 36 Local Mung Bean Accessions
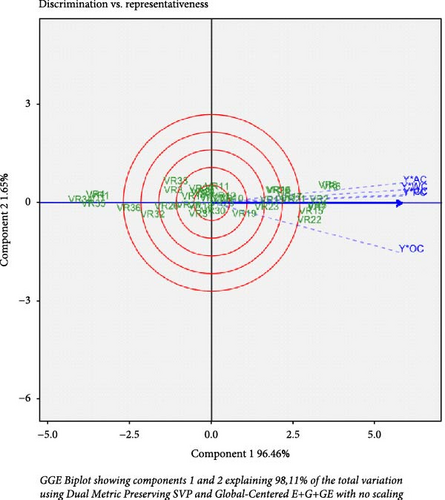
Based on the multiseasons GYT biplot, all yield-trait combinations tended to be positively correlated with each other, although there were negative correlations, as indicated by the angles between their vectors (Figure 5). The most prominent combination between yield and traits were AC, WC, CC, and PC, as indicated by the sharp angles (Figure 5). The high correlation between AC, WC, CC, and PC indicated that the combination of AC, MC (WC), CC (OC), and PC will be suitable to increase yield productivity in several accessions, namely VR6 and VR8. Another combination, Y ∗ OC, shows a difference, with positions spread across different sectors. This combination shows the suitability of the combination of high OC with yields to increase yield productivity in several accessions, namely VR22. The relationship between trait and yield combinations in the two growing seasons shows a difference, which means that there was a differential response of mung bean accessions between the two growing seasons.
3.2.3. Superiority of Local Mung Bean Accessions
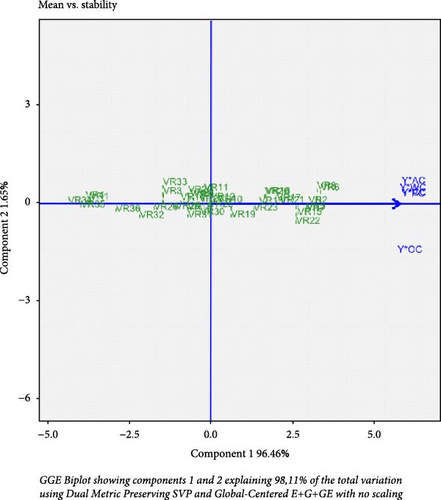
The stability effect and advantages of the accessions based on GYT biplot are presented in Figure 6. The horizontal line with an arrow was the stability line for the combination of yield and other traits. The ranking of the accessions according to the yield-trait combinations was: VR6 > VR8 > VR2 > VR5 > VR7 > VR15 > VR22 > VR21 > VR17. In contrast, VR34, VR35, VR4, VR1, VR36 and VR32 were ranked the lowest. Figure 6 also shows the profile traits of each mung bean accession, where the VR6, VR8, VR2, VR5, VR7, VR21, and VR17 accessions have the stability for the various traits tested. On the other hand, VR22 was the strongest in OC in combination with yield. Quantitatively, the weaknesses and strengths of each accession tested were based on the SI presented in Table 4. The best accessions were VR6, VR8, VR5, VR2, and VR7 which produced the highest average value compared to the others. Meanwhile, VR34, VR35, VR4, and VR1 showed the lowest average values. In Figure 6, the VR6, VR8, VR2, VR5, VR7, VR15, VR22, VR21, and VR17 accessions showed the best yield combinations, while VR34, VR35, VR4, VR1, VR36 and VR32 were the worst accessions. VR12 which was closest to the base point of the axis, with a moderate SI value (5.15), indicated that this accession was in the middle between good and bad accessions. The SI provides a holistic metric for breeders to prioritize genotypes that balance yield and quality traits. For example, VR6 (SI = 9.15) outperforms others by harmonizing high yield with optimal ash and MC, making it suitable for semi-arid cultivation.
| No. | Code | WC | AC | CC | PC | OC | Superiority index (SI) |
|---|---|---|---|---|---|---|---|
| 1 | VR1 | 0.56 | 0.17 | 4.32 | 1.01 | 0.05 | 1.22 |
| 2 | VR2 | 4.50 | 1.24 | 27.45 | 7.13 | 0.37 | 8.14 |
| 3 | VR3 | 1.72 | 0.61 | 13.38 | 2.84 | 0.14 | 3.74 |
| 4 | VR4 | 0.51 | 0.16 | 3.38 | 0.94 | 0.04 | 1.01 |
| 5 | VR5 | 3.56 | 1.25 | 28.70 | 7.80 | 0.38 | 8.34 |
| 6 | VR6 | 4.48 | 1.36 | 32.19 | 7.38 | 0.35 | 9.15 |
| 7 | VR7 | 4.55 | 1.18 | 27.96 | 6.59 | 0.39 | 8.13 |
| 8 | VR8 | 4.22 | 1.38 | 30.09 | 7.91 | 0.34 | 8.79 |
| 9 | VR9 | 2.07 | 0.74 | 16.13 | 4.13 | 0.19 | 4.65 |
| 10 | VR10 | 2.34 | 0.86 | 18.30 | 4.95 | 0.24 | 5.34 |
| 11 | VR11 | 2.60 | 0.83 | 18.17 | 3.74 | 0.19 | 5.11 |
| 12 | VR12 | 2.63 | 0.75 | 17.53 | 4.64 | 0.22 | 5.15 |
| 13 | VR13 | 3.87 | 0.93 | 23.08 | 5.45 | 0.30 | 6.73 |
| 14 | VR14 | 2.12 | 0.63 | 14.35 | 3.53 | 0.18 | 4.16 |
| 15 | VR15 | 4.31 | 1.15 | 25.79 | 6.50 | 0.39 | 7.63 |
| 16 | VR16 | 3.98 | 0.99 | 23.08 | 6.27 | 0.28 | 6.92 |
| 17 | VR17 | 4.19 | 1.08 | 23.94 | 5.95 | 0.32 | 7.10 |
| 18 | VR18 | 2.20 | 0.65 | 14.02 | 3.57 | 0.22 | 4.13 |
| 19 | VR19 | 2.85 | 0.80 | 17.88 | 5.24 | 0.30 | 5.41 |
| 20 | VR20 | 3.79 | 1.02 | 23.18 | 6.21 | 0.28 | 6.90 |
| 21 | VR21 | 4.02 | 1.10 | 23.98 | 6.40 | 0.33 | 7.17 |
| 22 | VR22 | 3.54 | 1.14 | 28.17 | 6.55 | 0.41 | 7.96 |
| 23 | VR23 | 2.91 | 0.94 | 24.83 | 5.53 | 0.31 | 6.90 |
| 24 | VR24 | 2.15 | 0.69 | 16.88 | 3.80 | 0.18 | 4.74 |
| 25 | VR25 | 2.44 | 0.75 | 19.56 | 3.81 | 0.24 | 5.36 |
| 26 | VR26 | 1.61 | 0.45 | 11.27 | 2.59 | 0.17 | 3.22 |
| 27 | VR27 | 2.25 | 0.71 | 17.76 | 4.02 | 0.21 | 4.99 |
| 28 | VR28 | 2.06 | 0.59 | 13.24 | 3.06 | 0.20 | 3.83 |
| 29 | VR29 | 2.01 | 0.59 | 16.69 | 4.75 | 0.16 | 4.84 |
| 30 | VR30 | 2.07 | 0.55 | 18.29 | 4.66 | 0.24 | 5.16 |
| 31 | VR31 | 1.98 | 0.60 | 14.27 | 3.81 | 0.24 | 4.18 |
| 32 | VR32 | 1.29 | 0.30 | 9.10 | 2.54 | 0.17 | 2.68 |
| 33 | VR33 | 1.94 | 0.57 | 13.06 | 3.34 | 0.11 | 3.80 |
| 34 | VR34 | 0.16 | 0.05 | 1.38 | 0.36 | 0.03 | 0.40 |
| 35 | VR35 | 0.37 | 0.10 | 2.60 | 0.68 | 0.06 | 0.76 |
| 36 | VR36 | 0.85 | 0.24 | 6.80 | 1.81 | 0.12 | 1.96 |
| Mean | 2.58 | 0.75 | 17.80 | 4.43 | 0.23 | — | |
| Stdev | 1.26 | 0.36 | 7.98 | 2.02 | 0.10 | — | |
- Abbreviations: AC, ash content; CC, carbohydrate content; OC, fat content; PC, protein content; WC, water content; Y, yield.
4. Discussions
GTs biplot analysis was a multivariate measurement. It assesses genotypes based on several traits and can identify superior genotypes based on the traits tested. The GT biplot technique was used by the researchers to understand the effect of genotype and the environment on the relationship between yields and other traits. According to Kendal [11], the GT biplot was used to compare and define VRs based on the traits tested. This technique can only estimate the relationship between each trait and the yield, but it can’t determine the effect of the combined yield on the other traits under different environmental conditions. Yan and Frégeau-Reid [14] revealed that the combined effect of yield with other traits could be estimated using the GYT biplot technique. The GT biplot test of 36 local mungbean accessions showed relatively strong because they represented 68.14% of the total phenotypic variation. These results were not much different from Kendal [11], who reported that GT biplot used on wheat, produced a fairly strong variation with a value of 61.50% of the total phenotypic variation. Therefore, results of this study were quite reliable.
The result of GT biplot analysis, yield was significantly correlated with AC and MC (WC) because it had an acute angle. According to Yan and Frégeau-Reid [14], vector lines that have an angle of <90° show a significant and positive correlation and vice versa. In addition, in Figure 3, the tested accessions were divided by vertical (average) and horizontal (stability) lines. The expected accessions were those that were above the vertical line and adjacent to the horizontal line [11, 23].
The mungbean accessions favored by farmers and growers were high-yielding and stable to environmental changes. However, yield is heavily influenced by a combination of many traits and other factors. Yield is a quantitative trait strongly influenced by the environment [24–26]. The GYT biplot allows breeders to evaluate genotypes for yield and other traits and shows the SI of each genotype [11, 14, 15, 18]. The GYT biplot can reveal the effects of various traits on yield under various environmental conditions and allows breeders to select superior genotypes. Genotypes selected by this model are stable under similar environmental conditions. GYT biplot can classify genotypes tested based on their rank, strength, and weakness in across environments [14].
Currently, plant breeding does not only select for high yields but also for stability [27], as well as good agronomic and quality traits [11]. Therefore, the combination of yield and quality was very influential in the genotype selection process. In the GT biplot measurement, the high value shown in Table 2 and Figure 2 shows that the average tester coordinate (ATC) line appears less significant, while in the GYT biplot measurement, ATC greatly contributes in selecting the accessions tested because it shows the strengths and weaknesses of the combination in each trait tested (Figure 5).
Figure 5 shows the relationship between the yield and trait-tested combinations. In the GYT biplot analysis, Figure 5 was an important feature [14, 15]. In Figure 5, the tested accessions will be sorted graphically and meaningfully based on the combination of traits tested. According to Mohammadi [15], one of the advantages of GYT biplot measurement can be used to identify additional features to reduce costs in trait measurement in field experiments without sacrificing accuracy. Thus, the strong positive relationship between AC, PC, CC, and WC suggests that one of them is fairly adequate for the expected accession selection criteria.
Generally, In the GT biplot, selection of the best genotype based on the traits tested, was still complicated because it does not show the most stable and best accessions for all the traits tested. In GYT biplot, the stability of genotypes across evaluated traits was clear. GYT biplot measurements identify both good and bad accessions, where GT biplot measurements cannot show this [11]. Based on the GYT biplot, VR6, VR8, VR2, VR5, VR7, VR21, and VR17 were the best stable accessions for all the traits tested.
5. Conclusion
This study underscores the efficacy of GYT biplot for selecting mungbean genotypes adapted to semi-arid regions. VR6, VR8, VR2, VR5, and VR7 are recommended as core breeding materials due to their stability and high SI values. Prioritizing traits like AC and moisture retention (WC) could accelerate the development of climate-resilient VRs for Indonesia. The GYT biplot measurement provides the best local mung bean accessions information for all the traits tested, while the GT biplot identifies the top accessions based on specific traits. Based on GT biplot, the yield was positively correlated with AC and MC (WC) but negatively correlated with the CC, PC, and OC. Based on GYT biplot, all yield-trait combinations tended to be positively correlated with each other (AC, WC, CC, and PC), except for OC, which showed negative correlation with other combinations. In terms of all the traits tested based on the GYT biplot and SI, VR6, VR8, VR2, VR5, and VR7 were the best and stable accessions. To increase the validity of the yields and traits tested, it was necessary to add the different locations and planting seasons in order to determine the response of each trait to changes the planting environment.
Disclosure
The authors state that this paper has been completely original and has never been published or currently being reviewed in another journal. We have quoted the words of other people/researchers exactly according to the rules.
Conflicts of Interest
The authors declare no conflicts of interest.
Author Contributions
Agung Karuniawan: conceptualization, methodology, validation. Haris Maulana: software, visualization, data curation, writing–original draft preparation. Reginawanti Hindersah: writing–reviewing and editing. Hari Hariadi: investigation, writing–reviewing and editing. Welna Kristina Frans: resources, writing–reviewing and editing. Puji Syara Anggia: investigation, writing–reviewing and editing. Andrew Yoel: software, writing–reviewing and editing.
Funding
This research was funded by Pusat Unggulan Maluku Corner, Universitas Padjadjaran multiyears scheme (contract number: 542/UN6.WR3/TU/2018).
Acknowledgments
Thanks to Vergel Concibido, Ph. D. from Sensient Colors, LLC, USA, for reviewing our manuscript.
Open Research
Data Availability Statement
The data that support the findings of this study are available from the corresponding author upon reasonable request.


