Optimizing of Nanocellulose Extraction From Highland Bamboo Arundinaria Alpina for Sustainable Bio-Nanomaterials via Response Surface Methodology
Abstract
Nanocellulose (NC) extraction from agricultural waste and lignocellulosic biomass residues has drawn considerable interest due to its low cost and wide availability. The environmental issues linked to nonrenewable materials have underscored the need for renewable alternatives that are biocompatible, biodegradable, and eco-friendly. This study aimed to investigate the potential of Ethiopian highland bamboo Arundinaria alpina for NC extraction by using acid hydrolysis. An experimental design incorporating response surface methodology (RSM) was applied to identify the optimal hydrolysis process parameters for NC extraction. The optimum conditions for NC extraction were a reaction time of 60 min, temperature of 40°C, and acid concentration of 61.40 wt%, with a yield of 43.15%. Bamboo and extracted NC were characterized for their chemical composition, particle size distribution, and crystallinity, using Fourier-transform infrared spectroscopy (FTIR), dynamic light scattering (DLS), and X-ray diffraction (XRD), respectively. The resulting NC had a particle size of 79.64 nm. XRD analysis revealed the crystallinity indices of the bamboo and its corresponding NC was 44.60% and 74.07%, respectively. These results indicate that highland bamboo A. alpina is a promising lignocellulosic source for sustainable NC extraction, optimization, and industrial applications.
1. Introduction
Nowadays, the environmental problems due to using petroleum-based materials such as global warming, air pollution, and plastic waste need to be replaced by renewable materials which are environmentally conducive and less costly [1]. The most common renewable and abundant natural polymer material currently used is cellulose [2]. Its numerous hydroxyl groups enable strong hydrogen bonding, resulting in its high strength, durability, crystallinity, stiffness, and biocompatibility [3, 4].
Innate cellulose is the source of nanocellulose (NC), a naturally occurring substance that has at minimum one dimension in the nanoscale range [5]. It is made from the cell walls of plants and other parts, and it has the necessary qualities, including great strength, remarkable stiffness, and a large surface area [6, 7]. The utilization of nanoparticles to develop high-performance and functional polymer materials has become a significant area of contemporary research in both academia and industries such as plastics processing industries [8], integrated circuit technologies [3], building and construction [9], biomedical processing service [5], nanocomposite reinforcements [10], and polymer and ceramics processing industries [11]. Over the past decades, much significant research has been directed toward extracting NC from different natural resources such as wheat straw [12], sugarcane bagasse [13], sisal fiber [14], and teff straw [15]. Highland bamboo fibers contain significant lignocellulosic components, including cellulose (30%–55%), lignin (20%–30%), and hemicellulose (15%–20%) [16]. Highland bamboo is a lignocellulosic material that is abundant and renewable, but its potential for NC extraction has not been fully explored [17].
In recent years, multiple studies have examined various chemical techniques that extract cellulose materials into sizes ranging from millimeters to nanometers [18]. NC can be extracted through various methods, including mechanical processes, enzymatic hydrolysis, and acid hydrolysis [4]. Acid hydrolysis is the most widely used extraction technique, because it effectively dissolves the cellulose chains’ disordered sections while leaving the ordered sections intact when combined [19]. The most common acid used for this is sulfuric acid, which creates NC particles grafted with a sulfate ester group. Producing NC with improved properties and smaller particle sizes may be accomplished quickly and effectively by using concentrated sulfuric acid [20].
Therefore, because of its effectiveness and efficiency in producing NC with improved qualities, the sulfuric acid-based hydrolysis approach was selected for this study [21]. It is noteworthy that the NC extracted via acid hydrolysis demonstrated a higher crystallinity index and smaller particle size in comparison to other extraction methods [16]. The world’s bamboo types are estimated to be 1,500, spanning ~14 million hectares of land [21]. Africa is home to around 40 species, distributed across more than 1.5 million hectares, with two types discovered in Ethiopia [21]. Ethiopia has an estimated 1 million hectares of natural bamboo cover, according to Kassahun Embaye [22]. Bamboo’s high cellulose and lignin contents have made it the primary draw for reinforcing in a range of matrices [23].
In engineering applications, response surface methodology (RSM) is a widely recognized approach for optimizing independent process variables [24]. Statistical and mathematical techniques are employed to evaluate the potential effect of these variables on final output [25]. To enhance the applicability of the proposed technique and optimize its parameters, a specialized subset of RSM, known as central composite design (CCD), was employed. The main effects of the independent process variables’ linear and quadratic interactions on the extraction of NC were investigated using this method, which also developed model equations for the response [26]. This methodology provides an inclusive experimental design, enabling data exploration, model fitting, and process optimization [27]. Furthermore, this finding seeks to optimize the process variables for NC extraction using RSM and to characterize the extracted NC. To date, there is no significant research work that has emphasized the optimization of process variables for acid hydrolysis of highland bamboo (Arundinaria alpina) for NC extraction. The purpose of this research is to explore the synthesis of NC from bamboo fibers through chemical hydrolysis, and more particularly, the influence of acid concentration, reaction time, and reaction temperature on the yield of NC using RSM. NC extracted was characterized for its functional groups, crystallinity and particle size, by Fourier transform infrared spectroscopy (FTIR), X-ray diffraction (XRD), and dynamic light scattering (DLS), respectively. The main aim of this work is to report these parameters, which will be helpful in the formulation of green materials that will help reduce the adverse environmental effect of non-renewable materials.
2. Materials and Methods
2.1. Materials
Highland bamboo varieties were obtained from the Jimma Agricultural Research Center located in Jimma, southwest Ethiopia. Sodium hydroxide (NaOH, 97%), sodium hypochlorite (NaClO2, 80%), sulfuric acid (H2SO4, 98%), and glacial acetic acid (CH3COOH, 96%) were the chemicals used to prepare bamboo NC. These were purchased from Alkane Trading PLC in Addis Ababa, Ethiopia. All of the analytical-grade reagents were used exactly as supplied. Various solutions were made following the acceptable concentrations, and the isolation experiments were carried out.
2.2. Methods
2.2.1. Sample Preparation
Highland bamboo was initially sun-dried for 5 days and oven-dried at 105°C for 24 h until the weight became constant. The dried sample was ground to powder in a mortar and passed through a 250 μm sieve. The obtained powder was stored in a polyethylene bag and kept in a desiccator before further experiment.
2.2.2. Extraction of Cellulose
Pure cellulose was obtained when highland bamboo sawdust was treated with 2 wt% sodium hydroxide (NaOH) in distilled water for the removal of lignin and other impurities that were absorbed [28]. This was achieved by combining 100 g of bamboo sawdust and a 2 wt% solution of sodium hydroxide prepared in 1L distilled water. The obtained mixture was stirred incessantly in a water bath maintained at 90°C and agitated for 4 h using an agitation speed of 1000 rpm [29]. The product obtained was subsequently purified under vacuum filtration, and then repeatedly washed with distilled water to remove remaining impurities. After four cycles of washing, the cleaned cellulose was air-dried and then bleached to increase its whiteness [19]. The extraction of cellulose was achieved using the methods outlined by Mandal and Chakrabarty [30]. To eliminate lignin from the bamboo powder, a bleaching process using acidified sodium chlorite (NaClO2) was applied. Particularly, after adding 1 liter of distilled water to 1.7% sodium chlorite, 75 mL of glacial acetic acid and 27 g of sodium hydroxide were added to the mixture afterward [31]. The product obtained was kept at 70 °C in a water bath with constant mechanical stirring at a speed of 1500 rpm [32].
Highland bamboo fiber was a 1:50 (w/v) ratio to the acidified solution [30]. After that, the bamboo powder was heated for 4 h at 70°C in the NaClO2 and NaOH solution while being continuously stirred mechanically at 1500 rpm. Three rounds of bleaching were required to achieve a white color for the bamboo fiber [33]. After vacuum filtration, the solid residue with a yellow color was washed repeatedly using distilled water until decolorized and then air-dried [29].
2.2.3. Component Analysis of Highland Bamboo
Table 1 presents the commonly employed techniques for the chemical characterization and component analysis of highland bamboo.
| Components | Standard |
|---|---|
| Lignin | TAPPI norm T222 om-88 |
| Cellulose | Kurschner–Hofer method |
| Hemicellulose | ASTM D 1104-56 |
Ensuring the accuracy, exactness, and consistency of data obtained during the extraction of NC from highland bamboo is a critical aspect of quality control aspect [34]. Material characterization takes place to eliminate contaminants such as dirt, dust, and extraneous plant materials [26]. Also, the extraction process control steps of the process, which include pretreatment, delignification, bleaching, and mechanical treatment [35] maintain precise control over temperature and duration during chemical treatments to avoid the degradation of cellulose fibers [36] and utilize high-purity chemicals and solvents to reduce contamination and attain consistent results [28]. Finally, various environmental factors can influence the properties of NC and the accuracy of measurement results [14]. Therefore by implementing quality control measures, researchers can ensure that the measurements obtained during the extraction are reliable, reproducible, and accurately reflect the material’s properties [13].
2.2.4. Extraction of Nanocellulose
2.3. Experimental Design
Where N represents, the total number of experiments needed, nc shows the number of replicates, and n is the number of variables. Hence, a central composite design was utilized to investigate the effect of these parameters on the result [33].
Twenty experiments were executed following the designated run sequence after being thoroughly vetted to reduce the impact of unforeseen variability brought on by unrelated causes [40]. The independent process parameters, NC yield, and the response variable were assessed using a second-order polynomial multiple regression equation (Equation (3) [41].
2.4. Characterization of Nanocellulose
2.4.1. Particle Size
DLS was utilized for the analysis of the mean particle size as well as the particle size distribution within the suspension. NC particle size distribution was established by Malvern Zetasizer Nano (ZE3600, Malvern Instruments, UK). Sample suspension dilution using distilled water and calibration at 2 minutes and 25°C temperature was done before analysis [9]. It is possible to ascertain the particle size by random variations in the amount of light scattered by the suspension [19].
2.4.2. Crystallinity Analysis
2.4.3. Functional Group Analysis
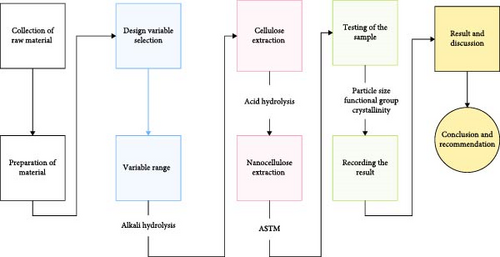
The chemical structure of the material was determined by Fourier transform infrared spectroscopy (FTIR), with spectra recorded on a Perkin Elmer 65 (USA) instrument. The analysis was conducted in potassium bromide (KBr) medium in transmittance mode within a wavenumber of 4000–400 cm−1. KBr was employed because it has 100% transmittance in the above range as compared to other ionic crystals [29]. Generally, the overall framework of the highland bamboo NC extraction procedure was described below (Figure 1).
3. Result and Discussion
3.1. Characterization of Highland Bamboo Components
The components of highland bamboo were characterized according to the standard procedure in detailed way (Table 1). The results indicated that the highland bamboo contains 28.1% hemicellulose, 19.5% lignin, and 52.4% cellulose. Extensive treatments are necessary to isolate cellulose from plants with a high lignin amount, and using chemicals and time to do so is necessary [44]. The cellulose content was determined using the equation specified in Table 1, yielding a value of 52.4% [8]. The findings were consistent with earlier investigations, as indicated in Table 2. Furthermore, the quantity of hemicellulose in the final product can influence its moisture absorption properties [13]. Therefore, based on these findings, highland bamboo A. alpina is a capable alternative natural resource for NC extraction.
Based on this finding, the extracted highland bamboo NC had a main application in reinforcing agents [46], paints [34], coatings [4], special papers [11], pharmaceuticals [5], biomedical materials [13], textiles [3], constructions materials [2], automotive industries [35], and micro-maintenance sectors [15].
3.2. Statistical Study of the Experimental Results
RSM based on a central composite design was employed to identify the optimal operating variables for acid hydrolysis influencing NC yield (Table 3). Sulfuric acid concentration, mixing temperature, and reaction time were the most important factors investigated [41].
| Run order | Standard order | Temperature (°C) | Reaction time (minute) | Sulfuric acid con (wt. %) | Yield (%) | |
|---|---|---|---|---|---|---|
| Actual | Predicted | |||||
| 1 | 7 | 40 | 60 | 65 | 43.40 | 42.90 |
| 2 | 20 | 50 | 45 | 55 | 40.03 | 40.79 |
| 3 | 16 | 50 | 45 | 55 | 42.52 | 40.78 |
| 4 | 2 | 60 | 30 | 45 | 41.95 | 42.67 |
| 5 | 17 | 50 | 45 | 55 | 41.30 | 40.80 |
| 6 | 14 | 50 | 45 | 75 | 28.65 | 28.78 |
| 7 | 15 | 50 | 45 | 55 | 40.55 | 40.79 |
| 8 | 6 | 60 | 30 | 65 | 27.85 | 28.99 |
| 9 | 12 | 50 | 75 | 55 | 37.95 | 38.45 |
| 10 | 4 | 60 | 60 | 45 | 39.15 | 39.92 |
| 11 | 3 | 40 | 60 | 45 | 38.85 | 37.90 |
| 12 | 13 | 50 | 45 | 35 | 37.65 | 37.42 |
| 13 | 11 | 50 | 15 | 55 | 36.60 | 35.89 |
| 14 | 18 | 50 | 45 | 55 | 40.30 | 40.87 |
| 15 | 9 | 30 | 45 | 55 | 37.21 | 37.99 |
| 16 | 8 | 60 | 60 | 65 | 27.50 | 27.44 |
| 17 | 19 | 50 | 45 | 55 | 40.60 | 40.79 |
| 18 | 1 | 40 | 30 | 45 | 33.60 | 33.81 |
| 19 | 10 | 70 | 45 | 55 | 32.50 | 31.36 |
| 20 | 5 | 40 | 30 | 65 | 38.20 | 37.60 |
3.3. Analysis of Variance
Analysis of variance (ANOVA) showed that run 1 produced the highest yield of 43.4%, which was slightly above the expected value of 42.90% (Table 3). Table 4 presents the response surface model’s ANOVA results in detail. The model’s relevance was demonstrated by its F-value of 42.61, which had a 0.01% probability of being the result of experimental noise (Table 4).
| Source | Sum of squares | Df | Mean square | F-value | p-Value | |
|---|---|---|---|---|---|---|
| Model | 434.53 | 9 | 48.28 | 42.61 | <0.0001 | Significant |
| A-temperature | 43.79 | 1 | 43.79 | 38.64 | <0.0001 | — |
| B-reaction time | 6.83 | 1 | 6.83 | 6.02 | 0.0340 | — |
| C-concentration | 75.04 | 1 | 75.04 | 66.22 | <0.0001 | — |
| AB | 23.63 | 1 | 23.63 | 20.85 | 0.0010 | — |
| AC | 151.82 | 1 | 151.82 | 133.97 | <0.0001 | — |
| BC | 0.8778 | 1 | 0.8778 | 0.7746 | 0.3994 | — |
| A2 | 58.99 | 1 | 58.99 | 52.05 | <0.0001 | — |
| B2 | 21.30 | 1 | 21.30 | 18.80 | 0.0015 | — |
| C2 | 97.62 | 1 | 97.62 | 86.15 | <0.0001 | — |
| Residual | 11.33 | 10 | 1.13 | — | — | — |
| Lack of fit | 6.95 | 5 | 1.39 | 1.58 | 0.3131 | Not significant |
The regression model equation closely matches the experimental data when the R2 value, which goes from 0 to 1, is near to 1. A higher R2 rate indicates that the data points closely align with the line of best fit. The R2 score in this investigation was 0.9746, which is near to 1.
This value suggests a strong relationship between the experimental and predicted data. Furthermore, there is a discrepancy of less than 0.2 between the adjusted R2 of 0.9517 and the expected R2 of 0.8581 (Table 5). It is commonly believed that for a strong correlation, the adjusted R2 and predicted R2 should be within 20% of each other [14].
| Std. dev. | Mean | C.V. % | R2 | Adjusted R2 | Predicted R2 | Adeq precision |
|---|---|---|---|---|---|---|
| 1.06 | 37.34 | 2.89 | 0.9746 | 0.9517 | 0.8581 | 20.5368 |
The lack of fit is utilized as a diagnostic tool to examine the adequacy of the model and its ability to identify the variability in the data versus the fitted model. In this case, the lack of fit was statistically insignificant relative to pure error, indicating that the model reasonably represents the data. This conclusion is also consistent with the significant large R2 values and comparatively small error terms evident in the analysis (Table 4) [39]. The RSM core composite design matrix of independent variables, including actual and predicted yields, is shown in Table 3.
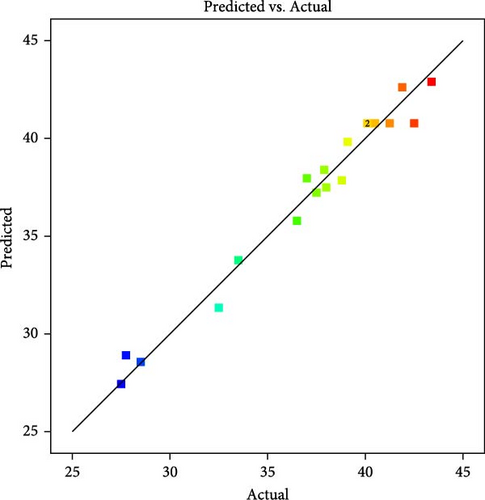
Figure 2 compares the predicted responses from the empirical model with actual experimental values, showing a strong correlation as most data points align closely with the line of perfect agreement. This is supported by a high R2 value near unity, indicating that the model effectively explains the variance in the data. Additionally, the normal probability plot confirms that the residuals follow a normal distribution, validating the model’s underlying assumptions.
3.4. Effects of the Significant Variables on the Nanocellulose Yield
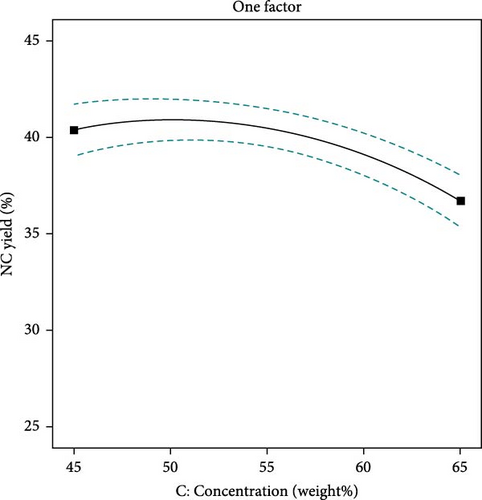
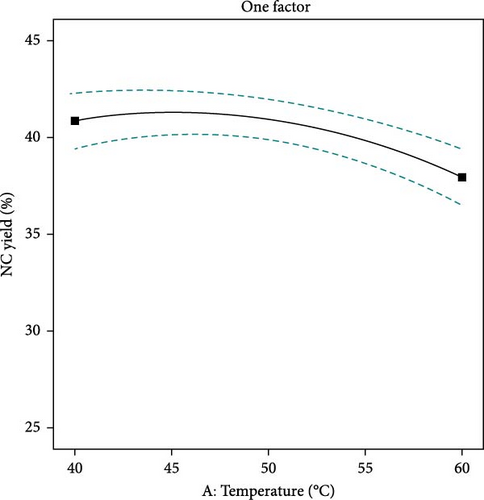
The yield of NC is affected by the concentration of sulfuric acid, the temperature at which hydrolysis occurs, and the length of time of the process. Figure 3 demonstrates that acid concentration significantly impacts NC yield. Increased acid concentration can enhance yield by improving hydrolysis efficiency. However, excessively high concentrations may degrade cellulose fibers, leading to reduced yields. This degradation process occurs when the acid enters amorphous regions of cellulose, thereby increasing the breakdown into NC [38]. With the decreasing concentration of acid, the NC yield slowly decreases consequently, the complete breakdown of cellulose to unwanted by-products takes place. Figure 4 describes that higher hydrolysis temperatures can enhance NC yield by increasing reaction rates and improving the solubility of cellulose fibers. However, excessively high temperatures can also result in degradation and a lower yield [47]. Figure 5, again, reaction times can enhance the yield of NC due to increased hydrolysis and dissolution of the cellulose fibers. The lowest yield was observed at the shortest reaction time, followed by an increase in yield until optimal values were reached. As the reaction time continues to increase, the cellulose degrades more rapidly, reducing the amount of NC produced [45].
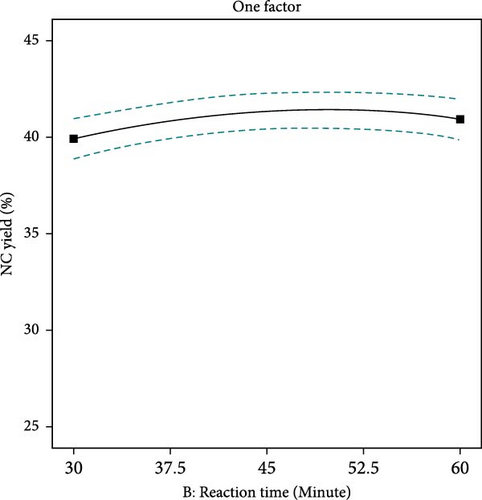
In contrast to cellulose, the isolated NC had a lighter color and appeared like a suspension. Strong acids break down the fiber’s crystalline sections, while the amorphous parts are efficiently dissolved by an acid at the right concentration [48]. As the acid penetrates the fibers and dissolves the crystalline regions of the cellulose, excessively elongated reaction times outcome in decreased yields of NC suspensions [4].
3.5. The Interaction of Significant Variables on the Yield of Nanocellulose
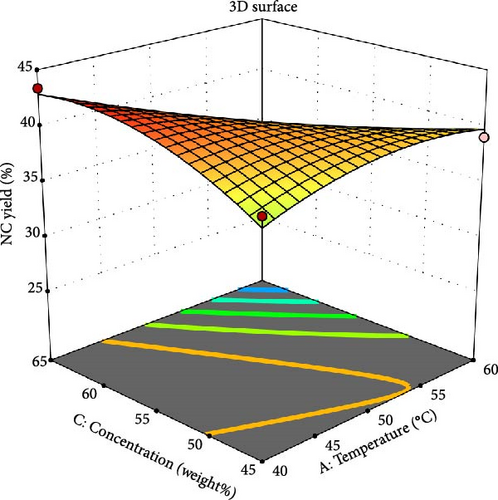
The RSM with the central composite design (CCD) was employed to identify the key factors affecting the NC yield during the extraction process. It was found that the mixture temperature, reaction time, and sulfuric acid concentration all had a significant effect on the NC yield [41]. Figure 6 shows how the concentration of sulfuric acid and temperature impact the amount of NC produced while keeping the hydrolysis time constant at 45 min. Equation (6) indicates that the temperature–acid concentration relationship reduces NC yield (−4.36) to its optimum value. It was noted that at maximum temperatures, a lower acid concentration enhances the product; however, as the temperature continues to rise, the yield begins to decline [33]. Contrarily, variations in acid concentration do not affect the yield at elevated temperatures. Additionally, it was observed that variations in acid concentration influenced yield more substantially at lower temperatures than at higher temperatures [7].
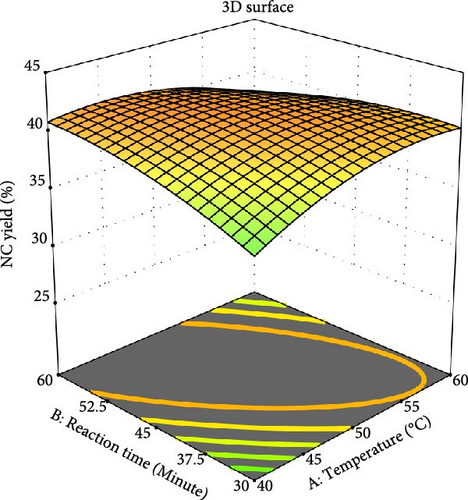
Temperature and reaction time were also shown to have a critical influence on the yield of NC when the acid concentration was maintained at 55 wt%. Lower temperatures and longer hydrolysis times resulted in higher yields of NC [49]. According to the graph, reaction time and mixing temperature have an inverse relationship with the NC yield at a constant acid concentration (Equation 6), and it is consistent with similar studies by Abitbol et al. [3]. Reaction time affects various characteristics of NC, including the crystallinity index, particle size, and yield. Extended reaction times can reduce yield due to the hydrolysis of crystalline surfaces [16]. Conversely, shorter reaction times result in a higher polymerization rate because of the presence of undispersed fibers, foremost in the production of NC with an amorphous structure and larger diameter [5]. Based on various previous studies, the reaction period ranges from 30 min to 4 h [50]. The concentration of sulfuric acid, typically ranging from 40 to 60 wt%, significantly influences the extraction of NC. This concentration is commonly used for isolating NC from agricultural residues and lignocellulosic materials [51].
3.6. Optimization of Acid Hydrolysis Process Parameters and Model Validation
To optimize process variables, involving acid concentration, reaction temperature, and hydrolysis time, values must be set within their allowed ranges, seeking to maximize the response variable, NC yield. As observed in Table 3, the highest yield of NC produced was 43.4%, at the combination of temperature (40°C), time (60 min), and acid concentration (65 wt %). The result shows that the expected numbers for NC yield nearly match the experimental data [52]. The response optimization approach employed in this work, with an acid concentration of 61.404 wt.%, a reaction period of 60.00 min, and a temperature of 40°C, optimized the yield of NC to 43.15%. To validate the optimal settings indicated by the RSM model, quadruplicate tests were carried out under specified conditions. The average yield percentage derived from these tests was 42.75%, which was not appreciably different from the 43.15% expected result. Numerical optimization can be regarded as consistent since the predicted value is sufficiently close to the experimental results, demonstrating the model’s validity and effectiveness in predicting the maximum NC yield [43].
3.7. Characterization of Nanocellulose
To verify the quality, the physicochemical evaluation of the NC suspension was performed under ideal circumstances.
3.7.1. Analysis of Functional Groups
Functional group analysis of bamboo and extracted NC under optimum conditions was characterized using FTIR analysis. Bamboo and NC had similar FTIR spectra (Figure 7), illustrating that no new bonds have been created when cellulose is hydrolyzed by acid. The spectral groups observed around 3405 cm−1 are related to O─H bending, while the band at 2900 cm−1 corresponds to the C─H group. In contrast to bamboo samples, which narrowed after many treatments since some of the shapeless components were removed by bleaching and acid hydrolysis, the peak of O─H stretching vibration in the NC displayed a durable transmittance [33]. Additionally, the peak at 1060 cm−1 suggests the C─O stretching vibrations that are typical of others that have been substituted with alkyls [41]. The minor ultimate at 1108 cm−1 in the NC spectrum is associated with S ═ O vibrations, resulting from the esterification reaction that takes place during the hydrolysis process [53]. After the period of treatment, this was diminished and almost eliminated [19].
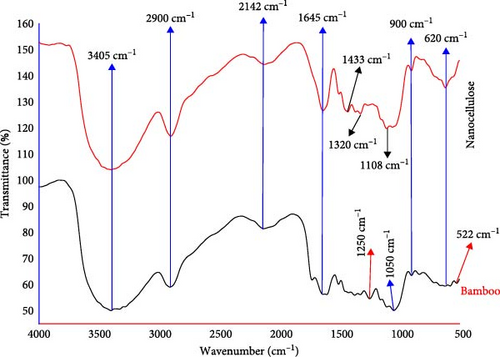
The C ═ O bond, which typically occurs with ester linkages in hemicellulose and lignin, is consistent with the observed peak at ~1728 cm−1 [54]. A C ═ C bond stretching was observed in both samples at the wave number of 1644 cm−1, indicating the existence of lignin [47]. At 1320 cm−1 wavenumber, the peak reduction of CH2 bonding at the C6 position in the cyclic structure of glucose indicates the elimination of some components of the amorphous region [51]. The esterification reaction that occurs throughout the hydrolysis procedure is accountable for the S ═ O vibrations observed in the NC spectrum at the tiny peak at 1108 cm−1 [42]. Besides, C─O alkyl-substituted ether stretching vibrations are linked to the 1050 cm−1 peak [33]. The peak around 900 cm−1 was associated with cellulosic β-glycosidic linkages [35], which are characteristics of the networks between the monomers in cellulose [31].
3.7.2. Particle Size
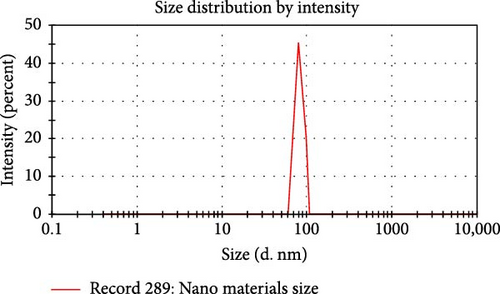
Figure 8 and Table 6 show the results of the DLS particle size investigation. The distribution was unimodal, with particle sizes ranging from 60 to 110 nm. The instrument’s Z-average particle size of 79.64 nm verified that the NC suspension created via acid hydrolysis of cellulose is indeed on the order of Nanometer scale. The Z-average gives the average particle size of the particles, hydrodynamic size-weighted, and the intensity of each particle ensemble as determined by DLS. The polydispersity index (PDI) was utilized to evaluate the homogeneity of the NC suspension. Higher PDI values imply less uniformity, whereas lower values show that the sample is agglomeration-free and uniform [19]. An unimodal peak is often produced by monodisperse samples (PDI <0.1), but bimodal or trimodal peaks may be produced by polydisperse samples (PDI >0.1) [29]. The product’s homogeneous NC suspension is indicated by its PDI of 0.0632, which is less than 0.1 [18]. The findings of this study regarding particle size and PDI align with those reported in previous research (Table 7).
| Parameters | Peaks | Size (d. nm) | % Intensity | St. dev (nm) |
|---|---|---|---|---|
|
Peak 1 | 79.64 | 100.0 | 2.59 |
| Peak 2 | 0.00 | 0.0 | 0.00 | |
| Peak 3 | 0.00 | 0.0 | 0.00 |
Table 6, shows the average particle size of NC extracted from highland bamboo by DLS.
The resulting product was within the nanoscale range and compared favorably to NC produced by other researchers. The information in Table 6, which describes the size of particle dispersion and polydispersity guide of the NC produced in this investigation, supports this consistency.
3.7.3. Analysis of Crystallinity Index
XRD patterns of highland bamboo and NC were analyzed to evaluate their respective crystallinity indices. As shown in Figure 9, the X-ray diffraction analysis of highland bamboo revealed that the diffraction peak became sharper and narrower after chemical treatment. Likewise, a NC top also demonstrated increased sharpness and narrowing, indicating a higher cellulose content and an improved degree of crystallinity due to the chemical treatments [18].
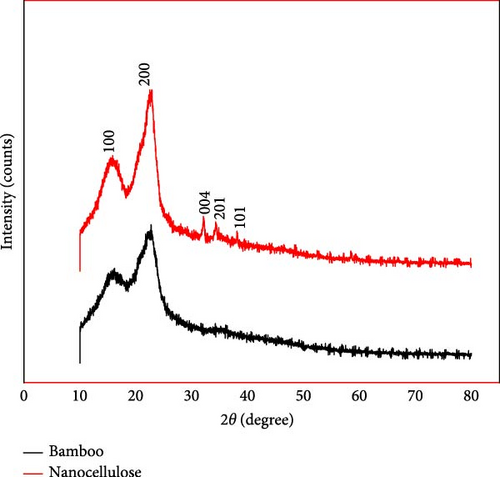
As depicted in Figure 9, the chemical treatments successfully eliminated the amorphous regions of the bamboo, leading to a well-defined peak for the NC. Both materials display a peak at ~2θ = 22.28°. Using Equation (4), the crystallinity index was calculated to be 44.60% for bamboo and 74.07% for NC. The decrease and elimination of amorphous cellulosic components throughout the purifying process, which involved alkali and bleaching treatments, can account for NCs higher crystallinity index as compared to bamboo [56]. Smaller, sharper peaks are produced in the NC after acid treatment because these nanostructures have a higher degree of crystallinity than the raw fibers [13].
During hemicellulose and lignin were extracted from the bamboo and sulfuric acid was accustomed for acid hydrolysis, the crystallinity index improved from 44.60% to 74.07% (Table 8). Highland bamboo’s crystallinity index is lower than NC’s, suggesting that the fiber had amorphous areas before chemical treatments [46]. The source of the material, the length of time spent purifying the sample, and the specific hydrolysis conditions are some of the variables that affect the degree of crystallinity [13]. The sharpness of the diffraction peak after the acid hydrolysis of cellulose showed significant degradation of amorphous regions, as evidenced by the crystallinity index rising to 74.07%. Similar research revealed that NC could be extracted from sugarcane bagasse with a 72% crystallinity value [13]. Similarly, other studies (Table 9) reported that successfully extracted NC from commercial crystalline cellulose with a crystallinity index of 76% [29]. Therefore, based on this characterization, highland bamboo is a suitable raw material for NC extraction in reinforcement applications in nanocomposite production due to its high crystallinity index value.
| Samples | Crystallinity index (CrI) (%) |
|---|---|
| Bamboo | 44.60 |
| Nanocellulose | 74.07 |
4. Conclusion
This study uses sulfuric acid hydrolysis as the chemical extraction process to extract NC from highland bamboo, which is a viable source of cellulose. RSM was accustomed to determining the main factors affecting the yield of NC using a central composite design. The isolated NC was found to have an average particle diameter of 79.64 nm. The resulting NC had a crystallinity index of 74.07%, while the bamboo sawdust was 44.60%. As observed, through this improvement in the crystallinity index of NC, the amorphous cellulose components were eliminated by the chemical treatments conducted during purification. Using RSM, the ideal parameter values that might optimize the NC yield during the acid hydrolysis process were identified. Second-order polynomials are therefore used to predict NC yield. Respectable agreement exists between the actual and anticipated values (R2 = 97.46%). The yield of NC is significantly impacted by the impacts of process factors and their interactions, as shown by ANOVA analysis. A yield of 43.15% was obtained by determining that the ideal parameters for the manufacture of NC were a reaction duration of 60 min, a temperature of 40°C, and an acid concentration of 61.40 wt%. Accordingly, highland bamboo, A. alpina, is a promising lignocellulosic source for the sustainable extraction of NC for reinforcing nanocomposites and biopolymers.
Ethics Statement
The authors have nothing to report.
Consent
The authors have nothing to report.
Conflicts of Interest
The authors declare no conflicts of interest.
Author Contributions
Kafi Mohamed Hamed: assisted with the initial data collecting, carried out experiments, created the experimental setup, described the samples, and helped with the creation, review, and composition of drafts and manuscripts. Ermias Girma Aklilu: the project supervisor and designed the experiment. Temesgen Abeto Amibo: reviewed the manuscript and shared basic ideas. Ebise Getacho Bacha: improving the manuscript, and providing the necessary facilities.
Funding
No funding was received for this research.
Acknowledgments
The authors gratefully acknowledge the support of Jimma University and Bule Hora University for the laboratory facilities used in this research.
Open Research
Data Availability Statement
Supporting data for this study are available from the corresponding author upon reasonable request.


