Wave Dynamics in Design: The Role of Nonlinear Potential Burgers’ Equation With Variable Coefficients
Abstract
This paper investigates exact solutions of the potential Burgers equation with variable coefficients (PBEVCs), contributing to communication engineering, nonlinear acoustics, and fluid mechanics. It explores novel solutions using the improved modified extended tanh–function method (IMETFM), revealing diverse characteristics and providing deeper insights into nonlinear wave dynamics. The study also analyzes the long-term behavior of PBEVC under noise influence, highlighting insights into noise-perturbed systems’ robustness. Moreover, it establishes connections to practical applications like 5G optical fiber transmission and ocean wave oscillations, showcasing the wide applicability of the IMETFM approach. This work’s novelty lies in uncovering diverse solution characteristics and bridging theoretical understanding with real-world applications.
1. Introduction
It is well-known that the world is filled with marvelous and complex natural phenomena, many of which entail numerous mathematical applications. These mathematical applications are not only limited to describing natural phenomena but also widely employed in solving real-world problems. For instance, nonlinear differential equations and soliton theory play crucial roles in fields such as physics, engineering, and biology. Nonlinear differential equations can describe the behavior of many complex systems, including climate models, fluid dynamics, and cardiac biomechanics. Soliton theory finds extensive applications in describing one-dimensional (1D) nonlinear waves, such as in water waves and optics. The application of these mathematical tools enables us to better understand natural phenomena and provides important theoretical foundations and computational methods for addressing complex real-world problems [1–10]. One class of equations that is used to simulate the propagation and reflection of shockwaves is called the Burgers equation. The Burgers equation is a fundamental partial differential equation that finds wide-ranging applications in fields such as fiber-optic communications, ocean engineering, fluid mechanics, and nonlinear acoustics [11]. The study of ocean physics, fluid dynamics, and acoustics has long been focused on the research of the potential Burgers equation variable coefficient (PBEVC), which stands for partial differential equations with variable coefficients. The PBEVC is extensively used in various fields of applied mathematics, such as analyzing waves in fluid dynamics, studying nonlinear waves in atmospheric and oceanic dynamic systems, investigating dynamics with exact closed-form solutions, and studying generalized traveling waves in dynamics [12–16]. Understanding the physical phenomena through the analysis of the PBEVC’s representational and quantitative features is of utmost importance. Therefore, the research on variable coefficient equations is significant in providing solutions for diverse dynamics within wave phenomena.
In this equation, a(t) can be understood as the coefficient function describing the nonlinear term uux. In other words, it controls the degree of influence of the nonlinear term on the evolution of the solution u(x, t). By adjusting the form and value of a(t), different types of nonlinear effects on the equation solution can be explored, providing a deeper understanding of the characteristics of nonlinear waves.
Here, g(t) is the coefficient function describing the diffusion term uxx. Diffusion terms are usually associated with the conduction properties of the medium, and the value of g(t) will affect the way and rate at which the solution propagates in space. By studying the characteristics of g(t), a better understanding of the diffusion behavior of the medium and the interaction of nonlinear waves can be obtained, providing important clues for further investigating the dynamic properties of the system.
As early as 2002, Fan [52] utilized symbolic computation to discover traveling wave solutions for nonlinear equations. In 2003, Fan [53] conducted extensive research on obtaining various forms of exact solutions of nonlinear equations. Later in 2006, Yang and Hon [54] conducted a comprehensive study on the improved modified extended tanh–function method (IMETFM). Recently in 2022, Ananna et al. [55] investigated the exact traveling wave solutions of a class of 3D fractional WBBM equations using the IMETFM. In 2023, Alhojilan and Ahmed [56] conducted further research on the analytical solutions of stochastic Ginzburg–Landau equation driven by Wiener process via the IMETFM. Within our cognitive range, no one has yet studied exact solutions of PBEVC using the IMETFM. In this paper, we apply the IMETFM technique to study the exact solution of PBEVC.
The PBEVCs, as a mathematical physics model, hold significant research importance not only in the field of fluid dynamics but also in nonlinear acoustics and optical fiber communications. In fluid dynamics, it is utilized to characterize the nonsteady behavior of fluids, particularly in examining phenomena such as shock waves, turbulence, and wave propagation. This model provides a profound understanding of complex fluid motion, serving as a basis for designing various engineering applications. In the realm of nonlinear acoustics, the PBEVC aids in comprehending the propagation of sound waves in nonlinear media and phenomena-like wave breaking and dissipation. By modeling and analyzing the process of sound wave propagation, we can better understand the behavior of sound waves in different media, guiding the development of acoustic technologies. Additionally, in optical fiber communications, the PBEVC contributes to modeling and analyzing the transmission and modulation of light signals in fiber-optic systems. Through studying the propagation characteristics of light signals in optical fibers, we can optimize the performance and capacity of optical communication systems, driving the advancement of optical communication technology. Therefore, research on the PBEVC not only deepens our understanding of physical phenomena but also fosters scientific and technological progress in related fields, holding significant theoretical and practical value.
This article is arranged as follows: the precise solution of PBEVC is explored through the utilization of IMETFM in Section 2. We also give some concrete examples of the exact solutions of PBEVC in Section 3. The discussion about the relevance between PBEVC and the stochastic differential equation (SED) is arranged in Section 4. In Section 5, the physical interpretation of the graphs obtained through computer simulations is presented. Section 6 establishes a correlation between mathematical visualizations and real-world phenomena. Section 7 provides a comparative analysis and discussion. Ultimately, the paper provides a comprehensive summary and conclusion in Section 8.
2. Apply the IMETFM to Equation (6)
3. The Exact Solution of PBEVC Is Applied in Some Concrete Examples
The analytic solutions in Equations (14)–(21) for the mentioned function equations involve various forms, including polynomial, exponential, trigonometric, hyperbolic, rational, and Jacobi elliptic function solutions. In these equations, g(t), a(t), q(t) can be chosen as some basic elementary functions. p(t) remains as a nonzero constant p, which is consistent with the literature [59]. To enrich the diversity of our solutions, we can introduce a simple elementary function and attempt to include more different elementary functions. Furthermore, it would be meaningful for our future waveform studies if q(t), a(t), g(t) can be selected as trigonometric, hyperbolic, exponential, or linear functions. The inclusion of these additional elementary functions will contribute to the variety and richness of the solution forms, thereby expanding the scope and significance of our future waveform research. In this chapter, we will provide some particular examples.
4. Connection to SED
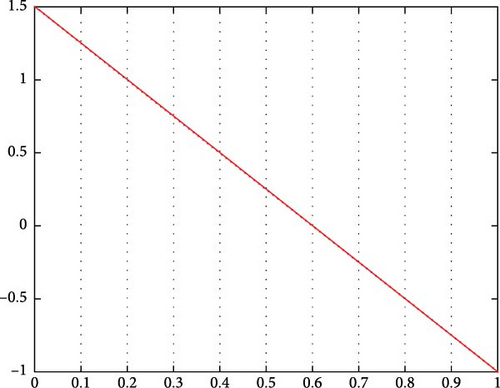
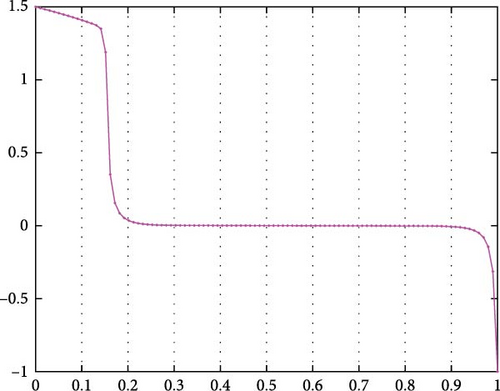
The areas around the stable equilibria are called the basin of attraction. The energy landscape description is useful in analyzing the deterministic system in Equation (29); however, when noise is present, the states of the system in Equation (29) can experience a sudden transition to another equilibrium point. In such cases, the states of the system in Equation (29) undergo an abrupt shift [61]. The concept of “stability” is no longer valid in the presence of noise, as the system jumps from one stable equilibrium to another due to the influence of noise. Therefore, the term “quasipotential” is introduced for systems with noise [61].
5. Physical Interpretations of Graphs Obtained Through Computer Simulations
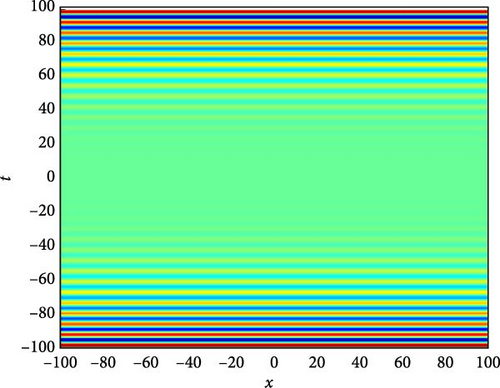
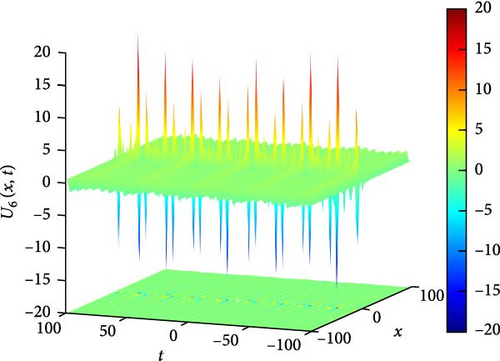
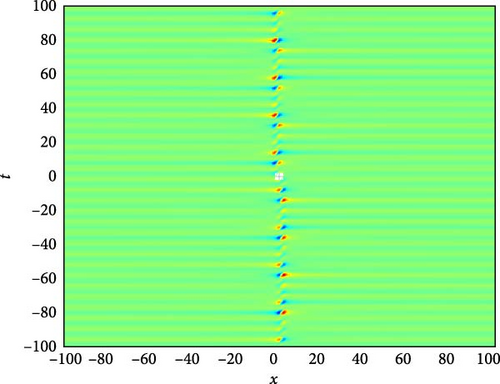
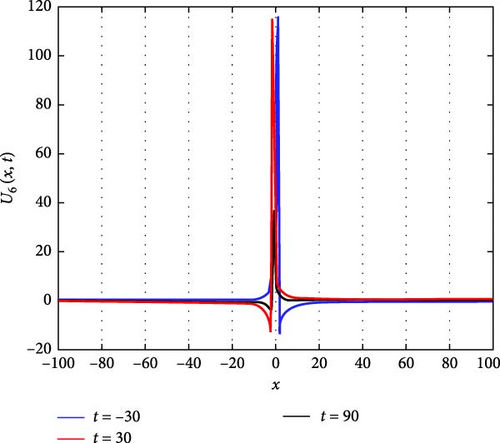
In this section, for further analyzing the nature and dynamic behavior in the physics of the U1(x, t), ⋯, U6(x, t), U7(x, t) in the equations, we make computer simulation images. We may select some appropriate parameter values or some special functions coefficients in the following figures. The following figures are the (a) 3D, (b) 2D contour, and (c) 2D image graph of the above functions via software MATLAB 2021b.
Figure 2(a) displays the periodic wave solutions illustrating the interaction between complex solitons, as represented by the function U1(x, t). Figure 2(b) provides a contour plot depicting the spatial distribution of U1(x, t) over the domain. As shown in Figure 2(c) which is close to the point x = 0, detailed observations reveal distinct behaviors: when U1(x, t) > 0, indicating the presence of a soliton, it attains its maximal amplitude at t = 0.6; conversely, when U1(x, t) < 0, corresponding to the trough of the soliton, it reaches its minimum at t = 0.9. Furthermore, for values of U1(x, t) lying between −1 and 0, the amplitude at t = 0.3 consistently exceeds those at t = 0.6 and t = 0.9, while the values at t = 0.6 and t = 0.9 are approximately equal. This nuanced behavior provides insights into the dynamics of the solitons. The parameters governing these solutions are , g(t) = sech(t), a(t) = csc(t), and q(t) = sin(t).
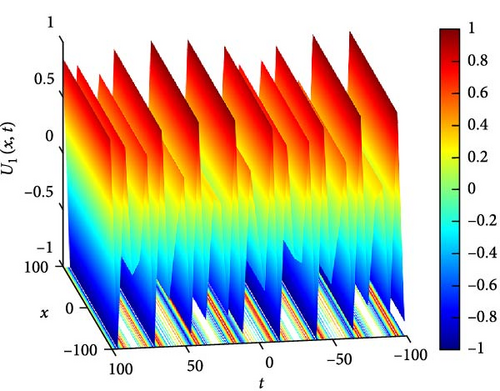
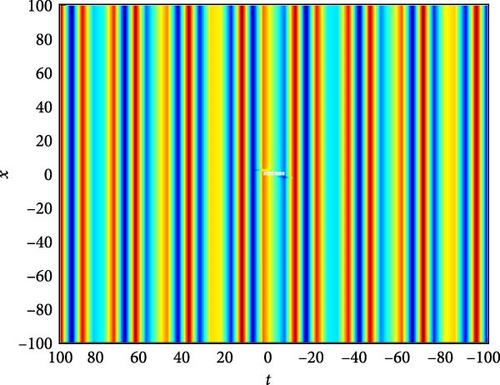
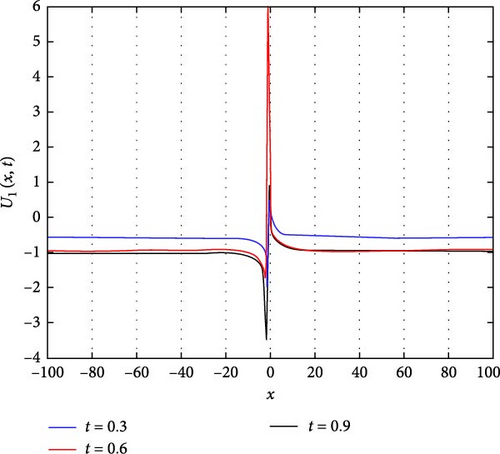
Figure 3(a) illustrates the behavior of an oscillating decaying solitary wave of U2(x, t). In this representation, we observe the gradual dissipation of the wave over time, a characteristic of solitary waves in dissipative media. The oscillatory nature of the wave is evident as it propagates, with successive peaks and troughs becoming less pronounced as time progresses. Figure 3(b) provides further insight through a contour plot of U2(x, t). This visualization allows us to discern the spatial distribution of U2(x, t) at different time points, aiding in the analysis of wave propagation and decay. Figure 3(c) delves into the temporal evolution of U2(x, t), specifically focusing on time instances t = 0.4, t = 0.8, and t = 1.2. At these time points, we observe a systematic decrease in the overall waveform of U2(x, t), indicative of the dissipative nature of the system. Interestingly, despite the overall decay, the oscillation amplitudes of U2(x, t) around x = 0 exhibit a notable increase. This phenomenon highlights the interplay between dissipation and localized energy concentration within the wave.
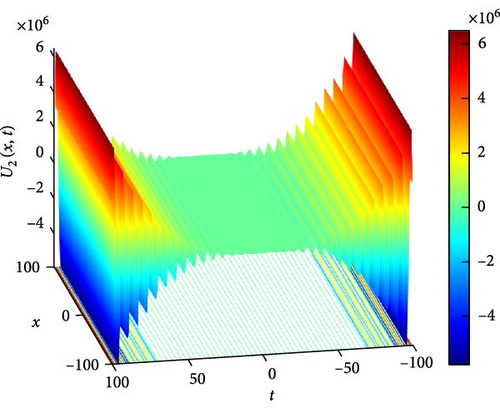
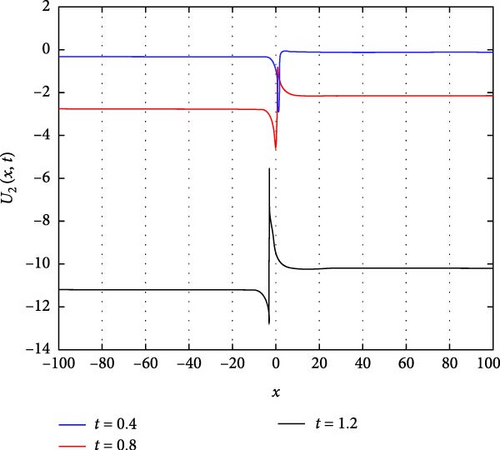
The parameters governing the system dynamics are outlined as follows: p(t), which remains constant at , g(t) characterized by the hyperbolic tangent function tanh(t), a(t) represented by the cosecant function csc(t), and q(t) determined by the polynomial function t4. These parameters collectively influence the behavior of U2(x, t), shaping its evolution and characteristics over time.
Figure 4(a) depicts a singular periodic wave of U3(x, t). This wave exhibits a repetitive pattern with distinct peaks and troughs, indicative of periodic behavior. Such waves are often encountered in systems where periodic forces or boundary conditions govern the dynamics. The singular nature of the wave suggests that it maintains its shape and characteristics unchanged over time, highlighting a stable periodicity. Figure 4(b) presents a contour plot of U3(x, t), offering insights into its spatial distribution at different time points. This visualization aids in understanding how the wave pattern evolves and propagates throughout the domain, providing valuable information about its amplitude and phase variation. Figure 4(c) further explores the temporal behavior of U3(x, t) at specific time instances, namely, when t takes values of −5, 0, and 5. At t = −5 and t = 5, the waveform of U3(x, t) exhibits mirror symmetry about x = 0, indicating that the wave’s profile remains symmetrically unchanged under time reversal. At t = 0, U3(x, t) remains constant at 0, suggesting a momentary state of equilibrium or absence of wave activity. These observations provide insights into the wave’s temporal dynamics and its relationship with the system’s boundary conditions and initial states.
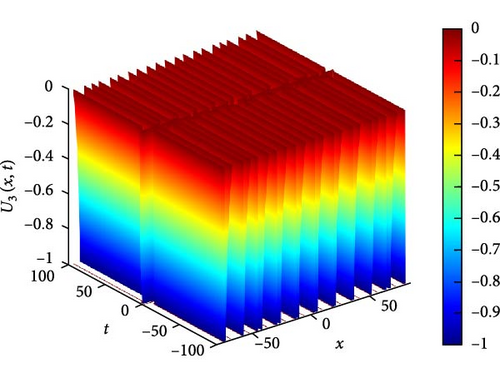
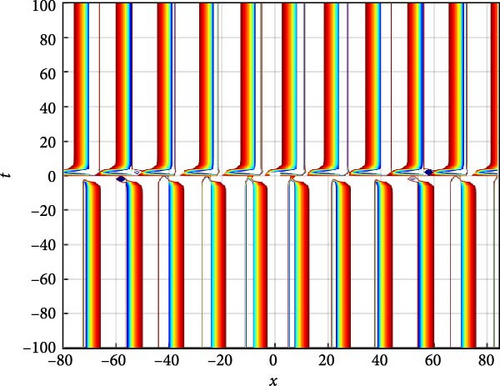
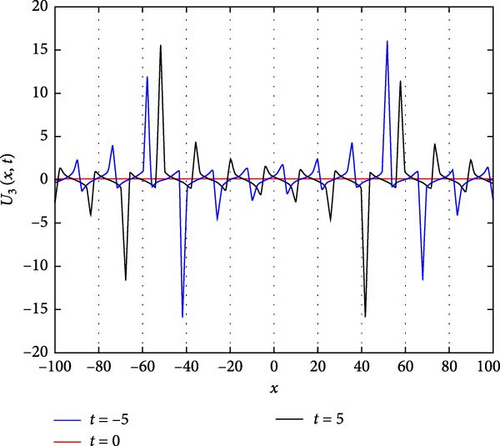
The parameters governing the system dynamics are outlined as follows: p(t) remains constant at , g(t) is characterized by the hyperbolic secant function sech(t), a(t) is represented by the hyperbolic cosecant function csch(t), and q(t) is determined by the hyperbolic tangent function tanh(t), while c4 = 1, c2 = 2, and c0 = 1 contribute to the specific form of the wave equation. These parameters collectively influence the behavior of U3(x, t), shaping its periodicity, symmetry, and overall dynamics.
Figure 5(a) illustrates a Λ-shaped solitary wave of U4(x, t). The Λ-shaped wave is a unique wave structure that resembles the Greek letter lambda (⋀). Solitary waves, also known as solitons, are self-reinforcing waves that propagate without changing their shape due to a balance between nonlinear and dispersive effects. In the context of the system, this solitary wave indicates a localized disturbance that maintains its profile while moving through the medium, demonstrating a stable and localized behavior. Figure 5(b) presents a contour plot of U4(x, t), offering insights into its spatial distribution at different time points. This visualization aids in understanding how the solitary wave pattern evolves and propagates throughout the domain, providing valuable information about its amplitude and phase variation. Figure 5(c) further explores the temporal behavior of U4(x, t) at specific time instances, namely, at t values of 0.6, 1.2, and 1.8. As t increases, the waveform of U4(x, t) shifts downward, indicating a progressive shift in the wave pattern over time. Notably, around x = 0, a larger oscillation amplitude is observed at t = 0.6, suggesting an enhanced wave intensity at this particular time point. These observations provide insights into the wave’s temporal dynamics and its relationship with the system’s boundary conditions and initial states.
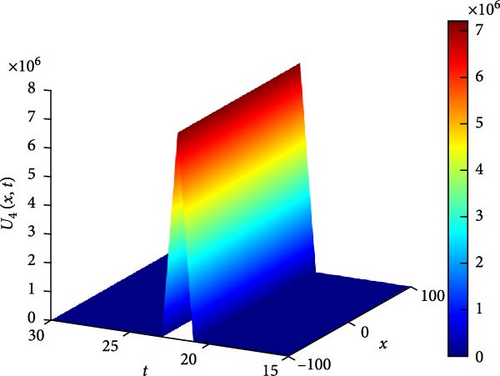
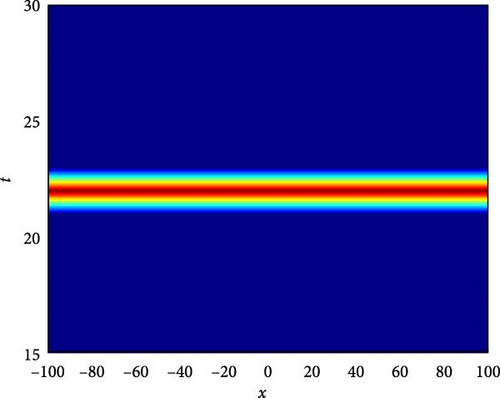
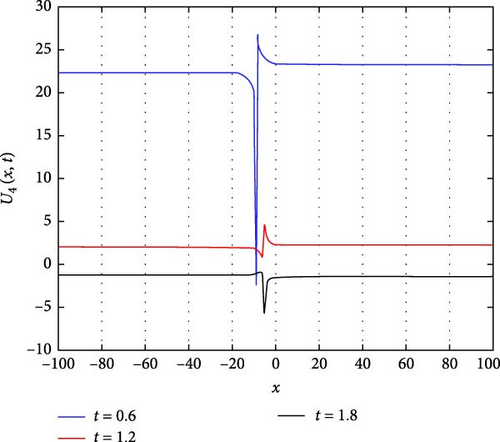
The parameters governing the system dynamics are outlined as follows: p(t) remains constant at , g(t) is characterized by the cosine function cos(t), a(t) is represented by the sine function sin(t), and q(t) is determined by the cosecant function csc(t), while , , and contribute to the specific form of the wave equation. These parameters collectively influence the behavior of U4(x, t), shaping its solitary wave structure, amplitude, phase, and overall dynamics.
Figure 6(a) depicts a three-dimensional (3D) plot illustrating the interaction between two solitons of U5(x, t) as solitary waves. Solitons are self-reinforcing solitary waves that propagate without changing their shape, and the interaction between them can lead to intriguing phenomena such as soliton fusion or reflection. In this representation, the 3D plot provides a visual depiction of how these solitons interact and evolve over time, showcasing their complex dynamics and mutual influence. Figure 6(b) displays a contour plot of U5(x, t), offering insights into its spatial distribution at different time points. This visualization aids in understanding how the soliton pattern evolves and propagates throughout the domain, providing valuable information about its amplitude and phase variation. Figure 6(c) illustrates the intertwined waveform of U5(x, t) at specific time instances, namely, at t values of 3, 6, and 9. From Figure 6(c), it can be observed that as t increases, the value of U5(x, t) increases for x < 0, while it decreases for x > 0. This asymmetrical behavior suggests a complex interaction between the solitons, where one soliton might dominate over the other in certain spatial regions, leading to a nonuniform distribution of wave intensity.
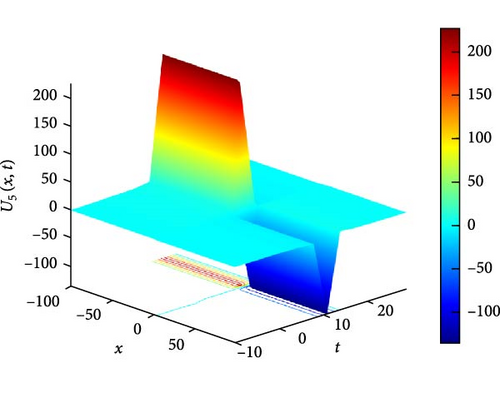

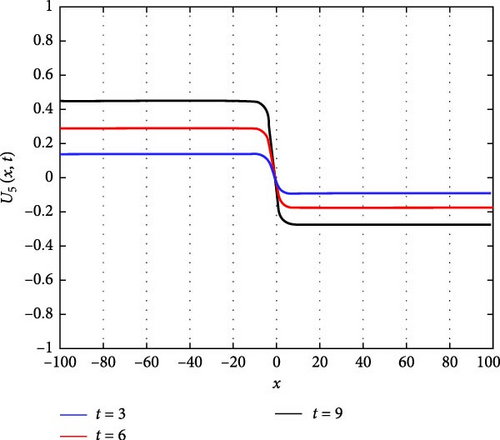
The parameters governing the system dynamics are outlined as follows: p(t) remains constant at , g(t) is characterized by the secant function sec(t), a(t) is represented by the cosecant function csc(t), q(t) is determined by the hyperbolic tangent function tanh(t), and c2 = c4 = 1 contribute to the specific form of the wave equation. These parameters collectively influence the behavior of U5(x, t), shaping its soliton interaction, amplitude, phase, and overall dynamics.
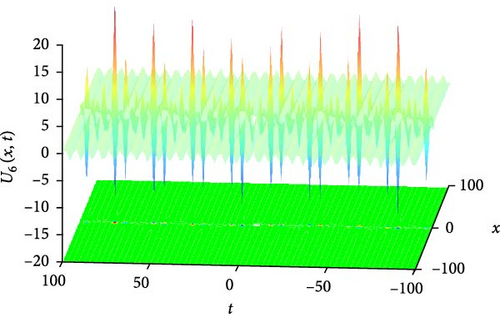
Figure 7(a) presents a 3D plot depicting the needle-shaped solitary wave soliton represented by U6(x, t). Needle-shaped solitary waves are characterized by their narrow and elongated profile, resembling the shape of a needle. These solitons exhibit unique propagation characteristics, often associated with highly localized disturbances that maintain their shape while traveling through the medium. The 3D plot provides a visual representation of the spatial distribution of this solitary wave, offering insights into its elongated structure and propagation dynamics. Figure 7(b) showcases a 2D contour plot illustrating the profile of the needle-shaped solitary wave soliton. This visualization aids in understanding the spatial distribution of the soliton’s intensity and phase, providing valuable information about its amplitude variation along the spatial domain. Figure 7(c) represents a series of 2D graphics of U6(x, t) at specific time instances, namely, when t takes values of −30, 30, and 90. From Figure 7(c), it can be observed that when t takes values of −30 and 30, the shape of U6(x, t) is symmetric about x = 0, indicating a balanced distribution of wave intensity on both sides of the origin. Additionally, the oscillation amplitude of U6(x, t) is larger around x = 0, suggesting a concentrated energy distribution at this point. However, at t = 90, the oscillation amplitude becomes smaller, indicating a change in the soliton’s intensity distribution over time.
The parameters governing the system dynamics are outlined as follows: p(t) remains constant at , g(t) is characterized by the secant function sec(t), a(t) is represented by the cosecant function csc(t), and q(t) is determined by the hyperbolic tangent function tanh(t). These parameters collectively influence the behavior of U6(x, t), shaping its needle-shaped soliton profile, amplitude, phase, and overall dynamics.
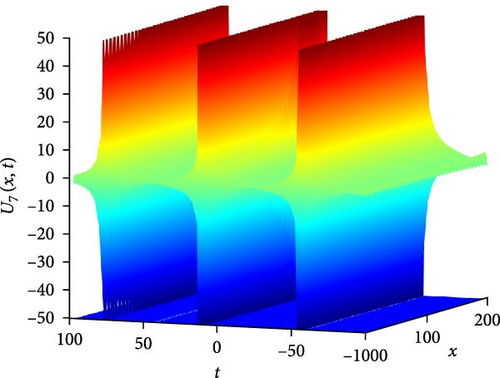
Figure 8(a) presents a 3D plot illustrating the complex interaction of solitary periodic waves represented by U7(x, t). Solitary periodic waves are characterized by their periodic behavior and solitary nature, indicating that they maintain their shape and propagate with a periodic pattern. The 3D plot provides a visual representation of how these waves interact and evolve over time, showcasing their intricate dynamics and the interplay between different wave components. Figure 8(b) showcases a 2D contour plot depicting the profile of the complex soliton U7(x, t). This visualization offers insights into the spatial distribution of the soliton’s intensity and phase, providing valuable information about its periodic structure and variation along the spatial domain. Figure 8(c) illustrates a curve graph displaying the absolute value of U7(x, t) on the interval −100 ≤ x ≤ 100, showcasing the oscillatory behavior of the soliton over time. From Figure 8(c), it can be observed that at t = 30, U7(x, t) demonstrates maximum oscillation, indicating a peak in the soliton’s intensity. Conversely, at t = 60, it shows minimum oscillation, representing a trough in the soliton’s intensity. At t = 90, it lies between these two extremes, suggesting a transitional phase in the soliton’s evolution.
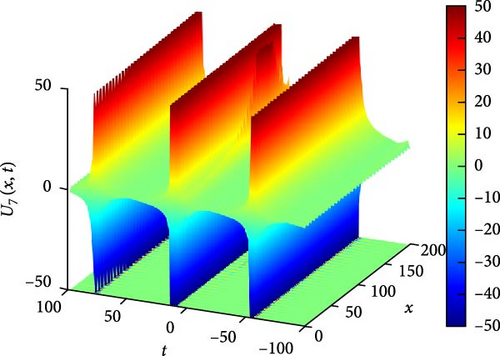
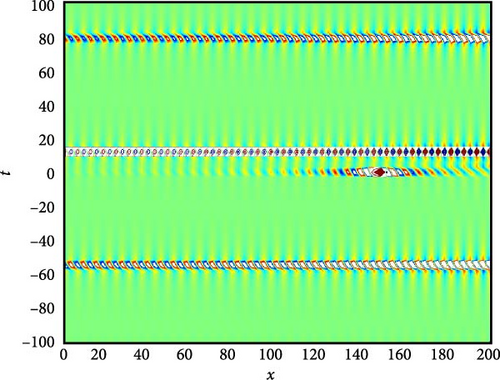
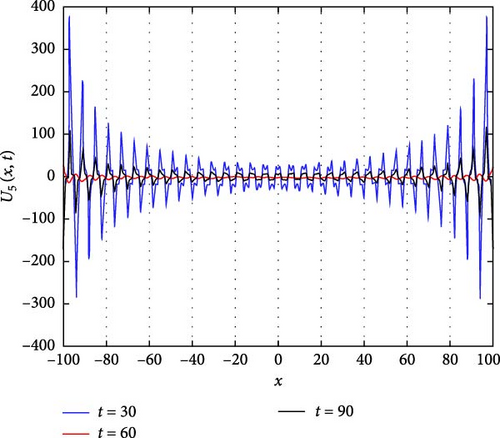
This alternating pattern of oscillations between large and small values reflects the complex dynamics of the solitary periodic waves, influenced by the interplay of various factors such as dispersion, nonlinearity, and boundary conditions. These factors collectively contribute to the intricate behavior observed in U7(x, t), shaping its amplitude, phase, and overall evolution over time.
All physical interpretations are based on the above 3D and 2D images. We have always maintained that our conclusions can help researchers look for other new and precise solutions, which may be beneficial to researchers to explore the unknown phenomenon more precisely. Also, we trust that the above IMETFM can also be used to study several other systematic nonlinear differential equations with variable coefficients in future.
6. Pushing the Boundaries: Fusing Mathematical and Physical Visualization With Real-World Phenomena, Unleashing New Realms of Understanding
In the dynamic and ever-evolving realm of technology, innovation serves as a mere stepping stone. The essence of success rests in seamlessly integrating these revolutionary solutions into real-world applications, unlocking their full potential. This article delves into the critical endeavor of bridging the disparity between theoretical advancements and practical implementation, shedding light on vital strategies and key factors that pave the way to success. Our objective is to establish meaningful connections between the mathematical and physical visualizations we have developed and their tangible applications in the real world, enabling transformative effects on society.
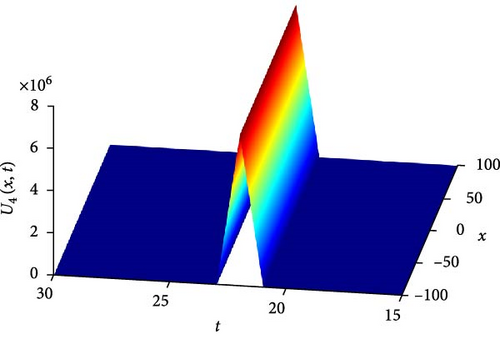
The Burgers’ equation with variable coefficients is a mathematical model that describes the propagation of nonlinear waves. It has wide applications in the fields of nonlinear optics, nonlinear acoustics, and fluid mechanics. In Section 7 of the computer simulation, we randomly selected three interesting 3D plots, namely, Figures 5a, 7a, and 8a. From these plots, we depict the solitons in the analytical solutions U4(x, t), U6(x, t), and U7(x, t). To establish a connection between these mathematically modeled figures and real-world phenomena, we present graphics illustrating “fiber-optic transmission under 5G technology,” “sound wave propagation in high-dimensional space,” and “waves on the ocean surface.” These graphics directly demonstrate the connection between U4(x, t), U6(x, t), and U7(x, t) and their applications in the real world.
In Figure 9, we explored the behavior of the analytical solution U4(x, t) and depicted it using a 3D mathematical model in MATLAB 2021b simulation, as shown in Figure 9a. Figure 9b illustrates the transmission of light in the fiber-optic cable in a special form of optical pulse, maintaining a relatively stable shape and energy during the propagation process, thereby revealing the characteristics of an optical soliton. Through the application of this visual representation, we forge a crucial connection between theoretical advancements and their practical applications, effectively bridging the gap that exists between these two realms. To provide a solid theoretical foundation for further research on the role of optical fiber transmission in 5G networks, fulfilling the data transmission requirements of future mobile communications.
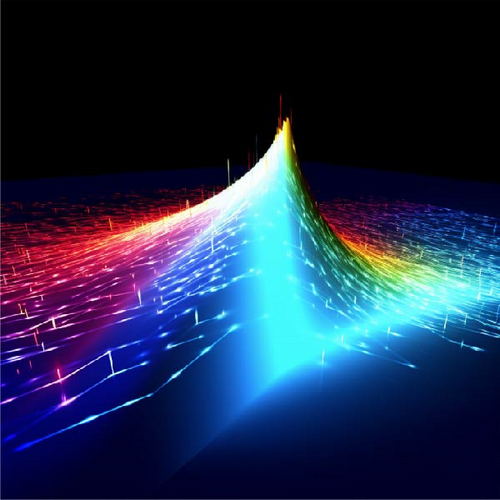
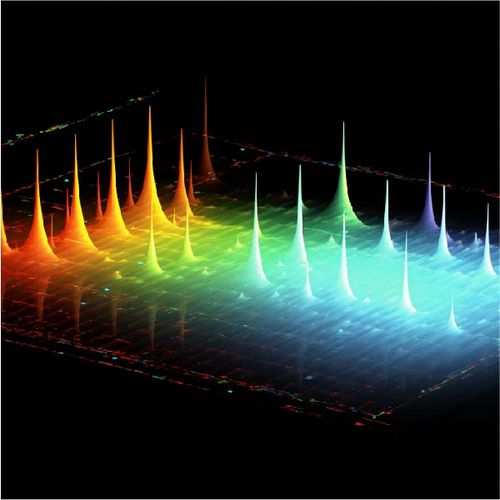
In our endeavor to enhance the practical significance of our mathematical and physical understanding, we meticulously created a captivating visual representation demonstrating the propagation of sound waves in higher-dimensional space. This visual masterfully illustrates the intricate relationship between our mathematical model and its real-world implications. Given this scenario, Figure 10b clearly delineates the existence of sound wave solitons in higher-dimensional space, establishing a direct link to the 3D mathematical model U6(x, t) depicted in Figure 10a, seamlessly bridging the gap between the prominently displayed 3D rendering in Figure 10a. Through these pursuits, we strive to achieve two primary objectives: first, to deepen our theoretical understanding, and second, to exemplify the profound impact of delving into mathematical solutions, unearthing captivating insights into the dynamic phenomena that unfold within the vast and interconnected tapestry of the natural world. This fusion of theoretical and real-world experiential knowledge is highly valuable as it aids in better comprehending phenomena and motivates us to explore and leverage these concepts in diverse scientific and engineering realms.
Through the study of the PBEVC, we can gain deeper insights into the wave behavior in the ocean and can predict and explain various observed phenomena, including tides, eddies, and wave interference. Figure 11a shows the 3D mathematical model of the soliton solution U7(x, t) under computer simulation. To further relate the simulated graphics to the real world, we analyzed Figure 11b, which depicts a realistic scene of ocean surface wave fluctuations. Indeed, the ocean exhibits visual manifestations of the propagation of periodic solitary waves, and this image accurately captures the cyclic process of solitons in the ocean environment. By comparing these visual representations with real-world observations of ocean waves, we can gain deeper insights into the dynamics and behaviors of solitons, as well as their relevance in understanding and modeling similar phenomena in nature. Furthermore, the study of the PBEVC has laid a significant mathematical foundation for various fields, including ocean engineering, ocean resource development, and ocean climate simulation. The comprehension and application of these equations provide us with invaluable insights to optimize the design of oceanic structures, forecast alterations in the marine environment, and enhance the sustainable utilization of ocean resources. In summary, the study of the PBEVC presents a potent tool for augmenting our understanding of oceanic phenomena and propelling the advancement of ocean science and its associated disciplines.

7. Comparative Analysis and Discussion
Studying the interplay of stable equilibria can provide a deeper understanding of how noise perturbs the system within the energy landscape framework. By the IMETFM, we find a wealth of novel forms of exact nontraveling wave solutions for PBEVC. Many scholars, respectively, had studied the solution of PBEVC in previous papers [15, 59, 63, 64]. In 2021, Sulaiman, Yusuf, and Alquran [63] have obtained some new exact solutions for PBEVC using the knowledge of dynamics. Mohanty et al. [15] studied the exact solution of PBEVC by -extend mean in 2022. In 2023, Qi and Zhu [59] investigated the PBEVC by -extend mean and Jacobian elliptic function ideas. Gulsen et al. [64] obtained some new solutions and nonclassic symmetries of the PBEVC using the heir-equations method. Within our cognitive range, we seems firstly used the IMETFM to research the exact solutions of the PBEVC.
At the same time, in real application, noise is present because of various reasons, for example, error from experimental environment, manual error, and model error. We also consider the stochastic PBEVC under the influence of noise, which is the stochastic Burgers equations. We further discuss the energy landscape behavior of stochastic PBEVC, such as the phenomenon between stable equilibria and take use of our research which helps to analyze quasipotential of such stochastic system. This is also an another important innovation. Comparative with the previous literatures [15, 59, 63, 64], we obtain the composite form of the exponential function with the trigonometric, hyperbolic function. Therefore, the results obtained in this paper are more complex and more extensive and more diverse. To our best lore scope, a lot of new solutions are discovered which are not reported in previous paper such as U1(x, t), U2(x, t), U3(x, t), U4(x, t), U5(x, t), U6(x, t), and U7(x, t).
8. Comprehensive Summary and Conclusion
- 1.
In this paper, using IMETFM to study Equation (6), we have found various forms of PBEVC solutions. To our best knowledge, we seem to be the first to use the IMETFM method to study PBEVC. We obtain the composite form of the exponential function with the trigonometric, hyperbolic function. A lot of new solutions have not been investigated in foregoing papers [1, 15, 59] such as U1(x, t), ⋯, U7(x, t). The results we obtained showed various features, such as complex solitons, oscillating and decaying solitons, singular periodic waves, Λ-shaped solitons, interacting solitons of two solitary waves, and needle-like isolated soliton solitons, among others.
- 2.
We also discuss the longtime behavior of stochastic PBEVC in small noise limit, and our various forms of IMETFM solution can help calculate the quasipotential between stable equilibria which helps understand noise-perturbed systemin the energy landscape view. It is obvious that with the diversity of g(t), a(t), q(t), the results of this paper contain richer and more complex solutions, which will not be listed one by one here. From the point of view of the calculation process, IMETFM is relatively complex, but more complex shape solutions can be got. We firmly believe that the IMETFM in this work may be more efficiently applied to find solutions to other nonlinear evolution equations.
- 3.
To establish a link between the illustrated graphs and real-world phenomena, we integrated visuals showcasing optical fiber transmission in 5G technology, the propagation of sound waves in multidimensional space, and the dynamic undulations of ocean surface waves. By incorporating real-world examples, we are able to bridge the divide between theoretical soliton behavior and practical physical phenomena, thus enriching our understanding of the significance and relevance of our discoveries.
We hope that our work will contribute to a better understanding of the physical and framework behavior in ocean models, nonlinear acoustics, and fiber-optic communications. We believe that our work has the potential to enhance our understanding and control of nonlinear effects, thereby advancing scientific research and technological progress in these fields.
Conflicts of Interest
The authors declare no conflicts of interest.
Funding
This paper is supported by the Biomedical Science and Technology Support Special Project (19441914900).
Appendix A
Open Research
Data Availability Statement
Data sharing is not applicable to this article as no data sets were generated or analyzed during the current study.


