Examining Spatiotemporal Trends of Temperature and Precipitation and Households Perceptions of Climate Change in the Eastern Free State Region of South Africa
Abstract
This study examines trends of maximum and minimum temperatures, as well as precipitation, in the Eastern Free State Region (EFSR) of South Africa. Climate Explorer was used to obtain annual maximum and minimum temperatures, and average monthly precipitation data for the period 1960–2019. The Mann Kendall (MK), innovative trend analysis (ITA) Test, and Sen’s estimate were employed to determine the nature of the trends and their significance, while a questionnaire survey was conducted to determine the perceptions of local communities about climate trends in the region. The Standardized Precipitation Index (SPI) was computed for the October to December (OND) and January to March (JFM) sub seasons and for the ONDJFM in R-Studio 1.1.1717 software using monthly precipitation data for the 1961–2019 period. The results indicate a significant rise in the long-term annual mean maximum and mean minimum temperatures, which have increased by 0.034 and 0.011°C/annum, respectively. Consistent with the perceptions of surveyed households, the results of the analysis revealed an increase in maximum temperatures, a decrease in precipitation, and consecutive dry years during this period. Most respondents cited an increase in Tmax, a decrease in Tmin, changes in precipitation patterns during the OND and JFM seasons, and increasing drought episodes. The SPI data indicated severe droughts during the JFM subseason in 1973 (−1.21), 1983 (−1.755), 1992 (−1.55), and 2016 (−1.10), and severe droughts in the OND seasons in 1994, 1990, and 2019 (all with SPI −1.645). The study concludes that if appropriate adaptation strategies are not adopted, these changes may contribute to food insecurity and water scarcity in the region, with negative implications for the livelihoods of local communities in the region. The findings underscore the need for context-specific adaptation measures to address the varied impacts of climate change across different altitudinal zones in the EFSR.
1. Introduction
Climate change alters the frequency, duration, spatial extension, intensity, and occurrence of extreme weather events, resulting in previously unprecedented extreme climatic incidents [1], which have a substantial impact on both water supply and food security [2]. Climate change impacts differ across spatial scales within mountain ecosystems [3]. Mountainous landscapes are assumed to be early indicators of climate change and fluctuation. The Drakensberg Mountains, which comprise much of the eastern part of the Free State Province are an example of a high mountain range in South Africa [4, 5]. The mountainous eastern region is particularly sensitive to climate change. As a result, combating household food insecurity and impoverishment requires a comprehensive understanding of climate indicators such as temperature, precipitation, and extreme occurrences such as droughts and floods. Understanding these climate indicators has been investigated by many researchers using different trend analysis methodologies.
Several methods, such as the Mann Kendall test (MK), Modified MK test (MMK), T-test, and linear regression test, have been widely used to examine trends globally [6, 7], in Africa [8–10] and specifically in South Africa [11–14]. However, the Innovative Trend Analysis (ITA) method, introduced by Sen [15], has been increasingly used to analyse global hydrological, meteorological, and environmental trends. Studies by Wu and Qian [16], Ashraf et al. [17], and Andualem et al. [18] highlight the advantages of ITA, including its ability to detect trends not identified by the MK test and linear regression. Several studies have used the ITA test to assess trends in climate time series data [18–24] for the reason that the ITA test does not rely on serial autocorrelation, normality, or length of data series assumptions and has higher sensitivity for trend detection [25, 26]. Despite the widespread use of ITA trend analysis worldwide, it has been underutilised in South Africa. Owolabi et al. [27] investigated the spatial and temporal variability in streamflow dynamics in the Buffalo catchment, Eastern Cape, South Africa, from 1981 to 2020 using ITA trend analysis. However, most studies in South Africa have traditionally employed the MK test, T-test, and linear regression test for analysing hydro-climatological data. Therefore, this study aims to apply ITA and MK tests to analyse trends in maximum and minimum temperatures and annual precipitation, specifically in the mountainous regions of the Eastern Free State Province, where research on ITA trend analysis may be limited.
Studying climate change in mountains necessitates a high density of meteorological data due to the considerable microclimatic variance [28]. However, because mountains are inaccessible, there is a dearth of studies on how they are affected by climate change [29]. It is critical to document local people’s views on climate change and incorporate them into planning and policy development [3]. As a result, an increasing number of studies have considered using mountain communities’ perceptions in surveys and interviews to explore local climatic trends. Examples include studies in Asia [30–33] and Africa [34, 35]. Schneiderbauer et al. [36] suggest that few studies that have examined how risk perceptions vary among communities in the same mountain range, between communities in different mountainous regions, or among communities at different elevations. There is dearth of literature on Southern African mountains, particularly the Drakensberg Mountains of the Eastern Free State Region (EFSR) of South Africa. Limited studies have been done to examine the perceptions of local communities on climatic trends across different elevation zones. This study, therefore, seeks to fill this gap.
According to Pandey et al. [37] local communities possess detailed knowledge of their environment developed from personal observation, culture, and experience, including shared experiences among community members. Nnko et al. [38] state that individuals’ perceptions are shaped by repetitive climatic events, which in turn impact the adaptation strategies they choose to implement. On the contrary, Cherinet and Mekonnen [39] state that perceived environmental changes may not represent actual events, due to a lack of understanding of climatic events or patterns.
Studies that incorporate household perceptions and climate data have been found to be an important step towards adopting local-specific and appropriate adaptation options [40, 41]. Therefore, in this study, incorporating household perceptions in climate change studies will assist our understanding of how household perceptions are consistent with scientific information. Such an approach will enhance effective use of indigenous knowledge in developing sustainable climate change adaptation measures. However, there are very few studies that have incorporated household perceptions into climate change studies in the mountainous region of the EFSR.
Agriculture is the main source of livelihoods for the majority of the EFSR communities. According to Poudyal et al. [42], communities whose livelihoods are based on agricultural activities have a better understanding of climate change impacts because the climate has a direct impact on their productivity and yields. It is, therefore, critical to understand how local communities in the EFSR perceive climate change and its impacts on their livelihoods, as well as whether their perceptions are compatible with climatic data. The paper is critical in that it provides climate data that could be crucial in assisting local households in deciding the appropriate agricultural and socioeconomic management strategies to deal with extreme environmental conditions resulting from climate change.
Climate change significantly impacts water supply, food security, and livelihoods, particularly in sensitive mountain ecosystems like the Drakensberg Mountains in the EFSR of South Africa. While traditional trend analysis methods like the MK test are widely used, the ITA method offers advantages in detecting trends without certain assumptions. Furthermore, local communities possess valuable knowledge of their environment, which can enhance the understanding of climatic trends and inform sustainable adaptation strategies. This study aims to bridge the gap between scientific climate data and local community perceptions in the EFSR. The central question of the paper is how do climatic trends and local community perceptions align, and how can this alignment be utilised to develop sustainable climate change adaptation strategies in the EFSR of South Africa?. Thus, the aim of this paper is to: (1) explore the spatial variability and temporal trends of maximum and minimum temperatures and precipitation in the EFSR for the period between 1960 and 2019, and (2) assess the perceptions of local communities in the region to determine their compatibility with the scientific evidence derived from the climate data and the extent to which these perceptions can be used to develop sustainable climate change adaptation strategies.
2. Materials and Methods
2.1. Description of the Study Area
The study area is situated in the Thabo Mofutsanyane District (TMD), which is located in the EFSR (Figure 1). The EFSR mainly comprises the TMD and it is bounded by Drakensberg and Maluti Mountains, Lesotho, KwaZulu Natal and Eastern Cape provinces.
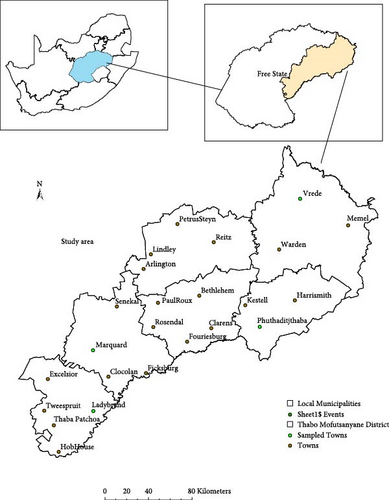
The district is within the Afromontane region, and located between 27°03′ and 29°08′ S and between 119°37′ and 121°26′ E. The TMD makes up almost a third of the Free State Province’s geographical area, with an area of 33 269 km2. The district comprises six local municipalities: Setsoto, Dihlabeng, Nketoana, Maluti-a-Phofung (M-a-P), Phumelela, and Mantsopa. The terrain in the EFSR is rugged and mountainous, with elevation ranging from 1500 to 3000 m above sea level [43]. The TMD is a representative rural district, and it has 24 small towns that serve the surrounding rural communities.
Moeletsi and Walker [44] state that the region receives precipitation that ranges between 500 and 600 mm, more rainfall than the rest of the Free State Province [45], making it more suitable for rainfed crop production compared to the rest of the province. In the EFSR, the mean maximum temperatures range between 20 and 22°C, while minimum temperatures range between 5 and −1°C [46]. The risk of frost varies significantly in the region due to the contrasting topography and geographical aspect [47]. Buschke et al. [48] categorised the biophysical characteristics of the TMD as temperate grassland, with various ecosystems influenced by varying altitudes and rainfall patterns that increase from west to east.
The farming systems in the TMD include commercial farming and small-scale farms, subsistence agriculture, pastoralism, and trading in medicinal herbs (Table 1). The district’s major nature conservation centres include the QwaQwa National Park, Sterkfontein Dam, Platberg, and the Maluti Mountain Range. The region is considered one of the biggest maize producers in South Africa [49]. The Setsoto municipality, a major maize production centre in the province, regularly faces droughts, affecting the country’s food and financial security [50].
| Local municipality | Area (km2) | Key economic sector |
|---|---|---|
| Maluti-a-Phofung | 4338 | Social services government (28%), agriculture (18%), tourism |
| Dihlabeng | 7550 | Services (29.7%), trade (18.6%), finance (18%), manufacturing (14.4%), transport (9.3%), agriculture (7.1%), and construction (1.9%). |
| Setsoto | 5431 | Finance, insurance, real estate and business (21.21%), manufacturing (17.62%), wholesale and retail trade (13.07%), agriculture, hunting, forestry and fishing (11.83%), government services (11.45%), community, social and personal services (11.31%), transport, storage and communication (6.79%), electricity, gas and water (3.5%), and construction (2.17%) |
| Mantsopa | 4292 | Commercial farming, private sector, public sector, and tourism |
| Nketoana | 5611 | Agriculture, retail businesses |
| Phumelela | 8196 | Agriculture, tourism |
Livestock contributes 40% to the gross value of agricultural production. Tongwane et al. [51] state that the EFSR is well adapted to beef and dairy cattle farming. Based on the high number of respondents in the study area, Nkonki-mandleni et al. [52] affirm that most of the sheep and cattle smallholder farmers are located in TMD Municipality. Table 1 shows the economic sectors in the study area.
The TMD was selected for this study because it lies within the EFSR, a highly sensitive mountainous area vulnerable to climate change impacts. Additionally, its reliance on agricultural activities makes it an ideal location to explore the interplay between climatic trends and community perceptions. The region’s socioeconomic significance, combined with its unique topography and climatic characteristics, further underscores its relevance for this study.
2.2. Sampling Design
As noted above, the district comprises six local municipalities. Multi-stage sampling was used to select four of the local municipalities, namely M-a-P and Setsoto, M-a-P, Phumelela and Mantsopa. The first stage involved stratified sampling, whereby six local municipalities were divided into two altitudinal zones based on elevation, including the high elevation zone whose altitude ranges from 1727 to 3277 m above sea level (masl), where the M-a-P, Phumelela and Dihlabeng municipalities are located and low elevation zone (1364–1726 masl), where the Setsoto, Mantsopa and Nketoana municipalities are located (Figure 2).
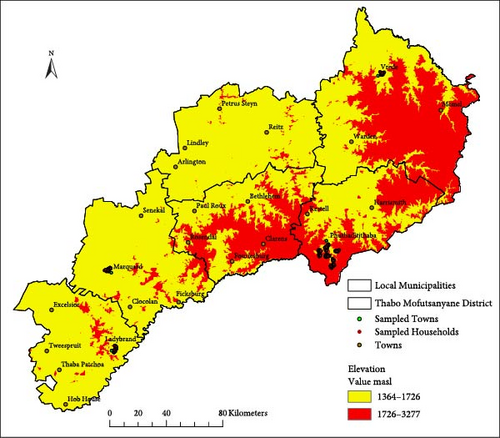
According to the Community Survey (2016), M-a-P has a population size of 353,433, followed by Dihlabeng 140,044, Setsoto 117,361, Nketoana 64,894, Mantsopa 53,525 and Phumelela 50,054 (https://wazimap.co.za/profiles/district-DC19-thabo-mofutsanyane/). The second stage involved selecting the study sites according to population size. The sampled households were chosen based on high and low population in order to capture a representative sample of the actual situation on the ground. One main difference between the two elevation zones was that more respondents in high elevation reported climate change impacts on crop production, while more respondents in low elevation reported climate change impacts on livestock production. Increased livestock disease incidents and livestock mortality were manifested more in the low-elevation zone than in the high elevation zone. However, more respondents in the high-elevation zone reported incidences of crop pests and diseases, and crop loss, than in lower-elevation zone. Another significant difference between the two elevation zones was that none of the respondents in the lower elevation zones reported crop damage due to frost. Two municipalities were selected in each zone, one with the highest population and the other with the lowest. The respective municipalities that were selected were M-a-P and Phumelela for the higher elevation zone and the Setsoto and Mantsopa municipalities for the lower elevation zone. The third stage of sampling involved grouping the households according to settlement type (rural and urban sections). The households that were sampled in the rural and urban sections of the sampled settlements were randomly chosen for inclusion in the study. Figure 3 presents the criteria for selecting sample households.

2.3. Data Sets and Methods
2.3.1. Primary Data Collection
| Elevation zone | Local municipalities in the zone | Population size | Number of households | Sample size |
|---|---|---|---|---|
| High elevation | Phumelela | 50,054 | 14,586 | 33 |
| M-a-P | 353,453 | 110,725 | 247 | |
| Low elevation | Setsoto | 117,361 | 37,246 | 82 |
| Mantsopa | 53,525 | 16,951 | 38 | |
| Total | — | 574,393 | 179,508 | 400 |
2.3.2. Climate Indices
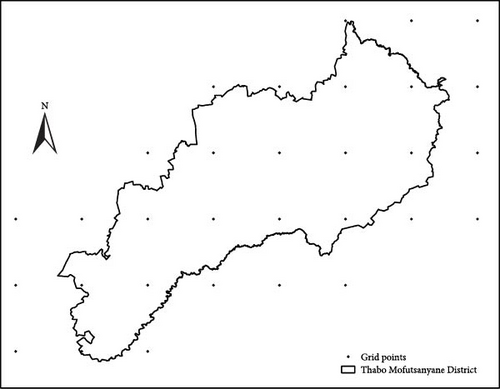
Time series data of maximum and minimum monthly temperatures for the study region was obtained from Climate Explorer for the period between 1960 and 2019. The data were obtained from the Climate Research Unit Time-Series (CRU-TS4.1) at a 0.5 × 0.5 resolution. All the downloaded data was complete, and no data was missing in the study region. A total of 34 grid points within the boundaries of the EFSR and those in the immediate surroundings were considered for analysis (Figure 4). Annual and seasonal January–March- (JFM) and October–December- (OND) and subseason October–March- (ONDJFM) average maximum (Tmax) and minimum (Tmin) temperatures, and average total precipitation were used in this study.
Although there are many predictors of climatic variability, this study focuses on temperature and precipitation due to their crucial role as primary indicators of climate change and their direct impact on local environment, water resources, and agricultural output. The EFSR heavily relies on agriculture, making temperature and precipitation critical factors for crop yields and food security. Local community perceptions also predominantly revolve around these variables, aligning with scientific investigations. Temperature and precipitation data are frequently used in existing research, facilitating comparison and validation of findings. Additionally, high-quality and long-term datasets for these variables ensure robust trend analysis. Thus, focusing on temperature and precipitation offers important insights into climatic patterns and their effects on local communities, aiding in the development of effective adaptation strategies in the EFSR.
For this study, the Standardized Precipitation Index (SPI) by Mckee et al. [54] was used to determine the frequency of drought occurrence based on average precipitation received during the JFM sub-season and ONDJFM season. The SPI is suitable for drought monitoring and assessment of monthly and above scales relative to local climatic conditions. Only the precipitation data is required for SPI calculation. For each grid point, SPIs were calculated from precipitation data using RStudio 1.4.1717 statistical software. Short-term scale SPIs provide a better estimate of seasonal precipitation, which greatly impacts soil moisture, crop yield and vegetation growth [4, 55, 56].
The SPI values were used to determine both drought intensity and duration of the droughts. Drought intensity is determined by the SPI value using the classification in Table 3.
| SPI value occurrence | (%) Occurrence | Nominal SPI class |
|---|---|---|
| >1.645 | ≤5 | Extremely wet |
| 1.644 to 1.282 | 6–10 | Severely wet |
| 0.842 to 1.281 | 11–20 | Moderately wet |
| 0.524 to 0.841 | 21–33 | Slightly wet |
| −0.523 to 0.523 | 34–50 | Normal |
| −0.841 to 0.524 | 21–33 | Slightly drought |
| −1.281 to −0.842 | 11–20 | Moderate drought |
| −1.644 to −1.282 | 6–10 | Severe drought |
| <−1.645 | ≤5 | Extreme drought |
2.4. Data Analysis
2.4.1. Analysis of Primary Data
Statistical analysis was done using Microsoft Excel 2016, RStudio (Version 4.3.1) and SPSS (Version 17.0). The data for the study were captured, processed, and statistically analysed for descriptive statistics (frequency and percentage) after coding the responses of participants to various closed-ended questions. The study applied the homogeneity test to mean maximum and minimum temperatures and precipitation indices using the Chi-square test. In detecting homogeneity, a hypothesis was set as follows: null hypothesis (H0): the data is homogenous, and the alternative hypothesis (H1): the data is not homogenous.
2.4.2. Trend Analysis of Climate Data
The study used different statistical approaches to assess the spatiotemporal changes in Tmax, Tmin, precipitation and drought extremes over the Eastern Free State. Statistical analyses were conducted at a significance level of 0.05. The non-parametric MK test was used to determine the existence of a trend in mean maximum and minimum temperatures and precipitation indices, whereas the Sen’s Slope (SS) estimator was employed to calculate the magnitude of the trend in the selected indices. In detecting the trend, a hypothesis was set as follows null hypothesis (H0) signified no trend, and the alternative hypothesis (H1) indicated the presence of a trend. According to Sharma et al. [3] several studies have used the MK test to assess trends in climate time series data. For the reason that the MK test does not require the normality of data, it is based on the median rather than the mean [59], and lastly, when using the non-parametric analysis, no prior transformation of data is required. Despite its advantages and popularity, Mohamed and Mukwada [5] state that the MK test has not yet been widely used in assessing trends in temperature. Yet temperature is a key variable that can influence other meteorological variables [5]. The XLSTAT statistical add-in for Microsoft Excel 2021 was used to perform the test. More details on the procedures and equations for the MK test can be found in [60, 61].
- 1.
If the data points on the scatter plot accumulate along the 1:1 (45°) straight line, it indicates no trend.
- 2.
The trend is increasing if the data points accumulate above the 1:1 line.
- 3.
The trend is decreasing if the data points accumulate below the 1:1 line.
The SPI drought indices were used to analyse drought frequencies. To detect abrupt changes or shifts in the temporal trend of selected indices, the study used the Sequential Regime Shift Detection (SRSD) method [64]. Spatiotemporal analysis of the SPI values was undertaken to determine trends the precipitation varied through time and geographic space. All maps were using Inverse Distance Weighting (IDW) in ArcMap V 10.7.1 for spatial interpolation techniques. As part of trend analysis, the SRSD method was used to identify any significant shifts in the climate indices under study. The selected statistical techniques have been widely used by various researchers in their climatological and hydrological studies over different climatic regions of the world [56, 65, 66].
3. Results
3.1. Household Perceptions on Climate Change in the EFSR
From the survey data, the local respondents acknowledged the changes in the rainfall and temperature patterns and events of natural disasters. The frequency and percentages of respondents’ responses to climate change perceptions across the sampled municipalities are shown in Table 4. As shown in Table 4, the results indicate that more than 50% of the respondents in both elevation zones reported a decrease in Tmin and an increase in Tmax. In the high-elevation zone (Phuthadjithaba and Vrede), about half of the respondents reported an increase in precipitation. However, in the low-elevation zone (Ladybrand and Marquard), about 53% of the households in Marquard reported an increase in precipitation compared to the 68.4% in Ladybrand who perceived the opposite.
| Perceived climate change indicator | Low elevation zone | High elevation zone | |||
|---|---|---|---|---|---|
| Ladybrand (38) | Marquard (81) | Vrede (34) | Phuthaditjhaba (247) | ||
| Maximum temperatures | Increase | 34 (89.4%) | 70 (86.4%) | 25 (74%) | 171 (69%) |
| Decrease | 2 (5.3%) | 6 (7.4%) | 2 (6%) | 45 (18%) | |
| No change | 2 (5.3%) | 5 (6.2%) | 7 (20%) | 31 (13%) | |
| Minimum temperatures | Increase | 11 (30%) | 17 (21%) | 7 (20%) | 42 (17%) |
| Decrease | 24 (63%) | 58 (71.6%) | 19 (56%) | 137 (55%) | |
| No change | 3 (7%) | 6 (7.4%) | 8 (24%) | 68 (27%) | |
| Precipitation | Increase | 7 (18.4%) | 43 (53%) | 11 (32% | 101 (41%) |
| Decrease | 26 (68.4%) | 31 (38%) | 17 (50%) | 127 (51%) | |
| No change | 5 (13.2%) | 7 (9%) | 6 (18%) | 19 (8%) | |
- Note: N = 400.
3.2. Spatiotemporal Variability of Climate in the EFSR
The MK test, ITA test, a non-parametric test and SS estimator method were applied on average annual maximum–minimum temperature and precipitation for the 1960–2019 period. The change point detection and RSI for maximum and minimum temperatures, precipitation and SPIs were defined by the SRSD method. Descriptive statistics of the annual average maximum and minimum temperatures and precipitation in the EFSR are summarised in Tables 5–7 respectively. Table 8 shows the result of the chi-square (X2) test for homogeneity analysis of annual average maximum and minimum temperatures and precipitation in the EFSR. The Chi-square test showed the presence of homogeneity in the precipitation dataset, as indicated by a p-value below 0.05 (0.0004). The homogeneity test showed that Tmin and Tmax data are not homogenous (p = 1), with a significance level greater than 0.05.
| Statistic description | Tmax data |
|---|---|
| Observations | 60 |
| MK Statistic (S) | 920.0 |
| Kendall’s Tau | 0.520 |
| ITA Slope(S) | 0.03205 |
| ITA trend indicator (D) | 0.4400 |
| P value | 0.0001 |
| SSD | 0.0005 |
| 95% CI | ±0.00101 |
| Sen’s slope | 0.034 |
| Test interpretation | Accept H1 |
| Statistic description | Tmin data |
|---|---|
| Observations | 60 |
| MK Statistic (S) | 568.00 |
| Kendall’s Tau | 0.322 |
| ITA Slope(S) | 0.0100 |
| ITA Trend indicator (D) | 0.4293 |
| P value | 0.000 |
| SSD | 0.0005 |
| 95% CI | ±0.00117 |
| Sen’s slope | 0.011 |
| Test interpretation | Accept H1 |
| Statistic description | Precipitation |
|---|---|
| Observations | 60 |
| MK Statistic (S) | −214.00 |
| Kendall’s Tau | −0.121 |
| ITA Slope (S) | −2.5988 |
| ITA Trend indicator (D) | −1.32009 |
| P value | 0.174 |
| SSD | 0.09308 |
| 95% CI | ±0.18244 |
| Sen’s slope | −1.064 |
| Test interpretation | Reject H1 |
| Ch-square (p-value) | |
|---|---|
| Maximum temperature | 1 |
| Minimum temperature | 1 |
| Precipitation | 0.0004 |
3.2.1. Spatiotemporal Variability of Maximum Temperature in the EFSR
3.2.1.1. Average Maximum Temperature
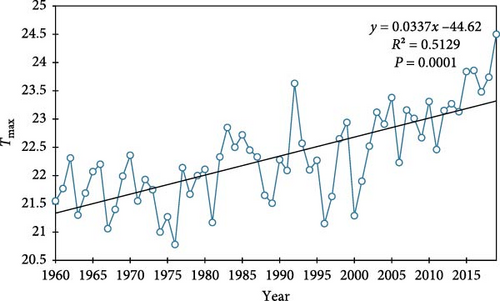
Figures 5–8 present the results of the average Maximum Temperature in the EFSR. The results show that there has been a significant change in the average maximum temperature (Tmax) over the past 59 years. The mean annual Tmax of the area during the study period was 22.3°C, with a standard deviation of 0.821°C. The minimum Tmax recorded was 20.8°C and the maximum ever recorded Tmax was 24.5°C
3.2.1.2. MK and Innovative Trend Analysis
The MK and ITA results for average annual maximum temperature are shown below. The p-value shown in Table 6 is lower than the significance level (0.05), one rejects the null hypothesis H0, and accept the H1. This suggests that the annual trend of maximum temperatures have increased over the years.
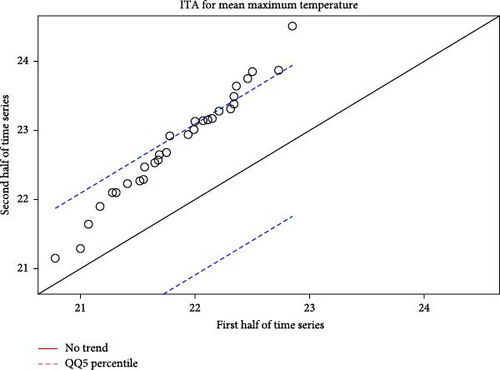
The trend is identified as positive, negative, or no trend, based on the location of the scatter points above, below, or on the 1:1 line. The results of the ITA for annual mean Tmax are presented in Table 5 and Figure 6. The ITA trend slope revealed a positive (S = 0.3205) increasing trend in Tmax, where most data points are positioned in the increasing trend area. The ITA showed a significant increase in the mean annual maximum temperature at 95% level. SS of annual mean maximum temperature was 0.034 °C/annum. The SS results exhibited that the maximum temperature had an increased trend (0.034). The ITA slope (S = 0.032) and SS (S = 0.034) showed more or less similar results.
3.2.1.3. Change Point Detection
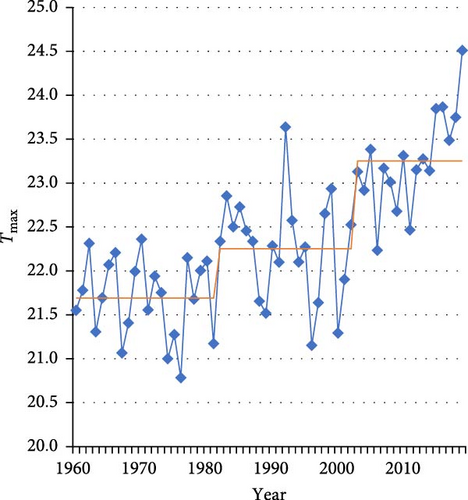
The findings from the SRSD method on the average maximum temperatures (Figure 7) revealed that Tmax variables had an abrupt change.
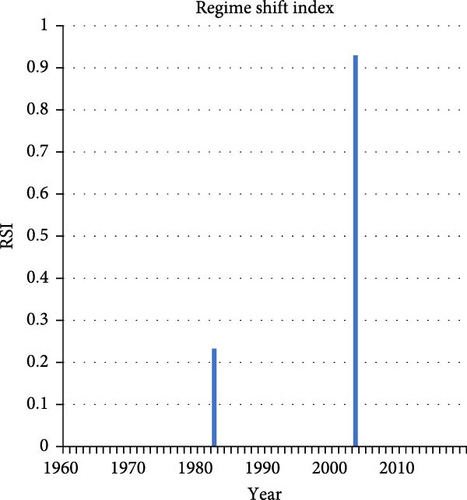
The results from the RSDS indicate that rapid warming in the region as evidence reveal two incidents of abrupt temperature shifts. An abrupt increase in Tmax was detected in 2003 with RSI of 0.9296 and another shift in 1982, with RSI of 0.2326. The regime shift analysis appears to show that the local communities in the region are experiencing hot environment.
3.2.1.4. Spatial Analysis of Maximum Temperatures in the EFSR
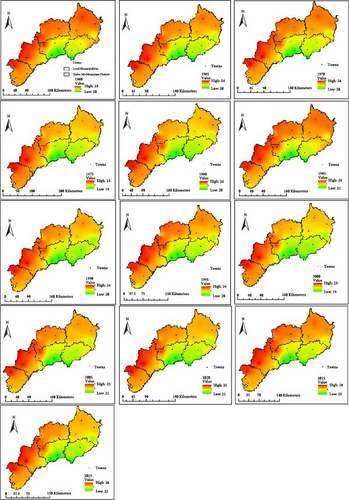
Figure 8 shows the analysis of the spatial and temporal variability of Tmax values in the region from 1960 to 2019. The results (Figure 8) indicate that the maximum temperatures in the EFSR have increased, with the average maximum temperature value increasing from 23°C in 1960–26°C in 2019.
The highest maximum temperature values were recorded in 2015 and 2019 when the Tmax value ranged between 22 and 26°C. Lowest Tmax values were recorded during the 1975 and 2000, ranging between 19 and 23°C. The results from spatial analysis show that the change in maximum temperatures is similar across the sampled towns, with a difference of 3°C. For example, in the lower elevation zone, Marquard and Ladybrand experienced increased Tmax ranging between 23and 26°C. Locations in the higher elevation zone, Vrede and Phuthadjithaba, experienced an increase in Tmax (19–22°C). The perceptions of the respondents are in line with the observed trends. According to the perceptions reported by the respondents (Table 4), the respondents from Ladybrand (89.4%) and Marquard (86.4%) perceived increased summer temperatures. The same applies for the participants from Vrede (74%) and Phuthadjithaba (69%) who reported an increase in Tmax.
3.2.2. Spatiotemporal Variability of Minimum Temperature in the EFSR
3.2.2.1. Average Minimum Temperature
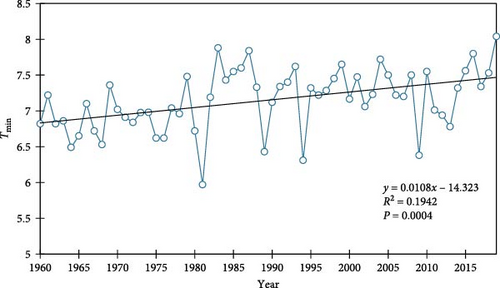
Figure 9 below shows the average annual minimum temperature from 1960 to 2019. During the period of the study, the mean minimum temperature in the region was 7.2°C, with a standard deviation of 0.43°C. The minimum and maximum Tmin values recorded were 6 and 8°C.
3.2.2.2. MK and Innovative Trends Analysis
The trends in annual mean minimum temperatures using the ITA and MK methods are provided in Table 6 and Figure 10. The same applies for minimum temperatures, which are statistically significant (p > 0.05) as shown in Table 6. The results show that the p-value is lower than the significance level (0.05). One accepts the alternative hypothesis H1 and rejects the null hypothesis H0.
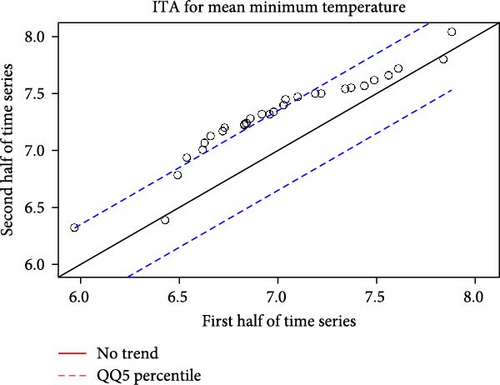
The minimum temperatures have increased from 1960 to 2019. SS of annual mean minimum temperature was 0.011°/annum. According to the ITA test for Tmin (Figure 10), the scatter points in most grids lie above the 1:1 line, indicating an increasing trend in mean minimum temperature. The ITA slope value in mean Tmin is 0.0100 and positive, as shown in Table 6.
3.2.2.3. Change Point Detection
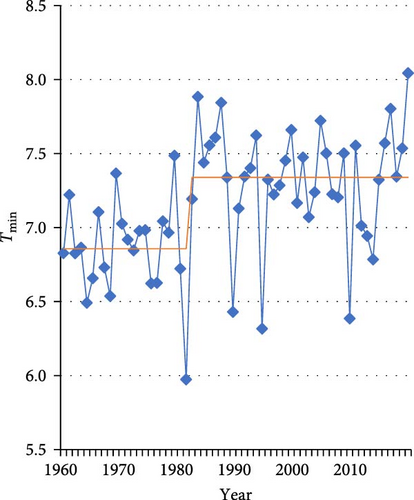
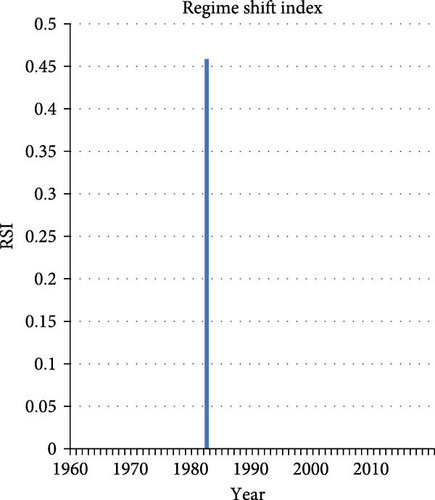
With respect to the regime shift in the mean for minimum temperatures shown in Figure 11, one shift occurred in 1982 with RSI value of 0.4586. The results imply that the winter season in the region has become warmer. The regime shift analysis appears to show an increase in shifts in Tmax and Tmin that occurred in corresponding year.
3.2.2.4. Spatial Analysis of Minimum Temperatures in the EFSR
Figure 12 shows the spatial analysis of Tmin period 1960–2019. The results (Figure 12) indicate that the minimum temperatures in the EFSR have increased, with the average minimum temperature value increasing from 8°C in 1960to 10°C in 2019. The highest minimum temperature values were recorded in 2019 when the Tmin value ranged between 7 and 10°C. A total of 4 years (1960, 1965, 1975 and 1980) recorded the lowest Tmin values, ranging between 5 and 8°C.
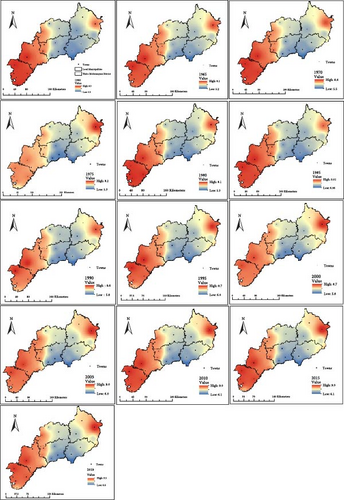
Cold winters are seen in the high elevation zone (5–7°C) and in the lower elevated zone (8–10°C). Also, under high elevations, Vrede experiences warmer winter temperatures compared to Qwaqwa that experiences low winter temperatures. According to the survey, respondents from Marquard (71.6%), Ladybrand (63%), Vrede (56%) and Phuthaditjhaba (55%) perceived a decrease in minimum temperatures. The respondents reported that the winter is becoming colder.
Perceptions concerning the winter temperatures were diverse as respondents from Ladybrand, Marquard, Vrede and Phuthaditjhaba (30%, 21%, 20% and 17%) thought that it was increasing, while (7%, 7.4%, 24% and 27%) of them believed that there was no change. However, their opinions do not correspond to the climate records (Figures 9–12). This could be because the local communities, particularly those who have lived in the area for a long time, have noticed that the winter season has become warmer. A female respondent aged 61 years and above from Qwaqwa, for example, stated that “There used to be snow on top of these mountains, but that has changed as the winter is warm and there is rarely snow.” Another Qwaqwa respondent mentioned, “The winter is now warm. We used to know the winter season as overcast, but this has changed, as recently the sky has become clear during winter.”
3.2.3. Trends of Precipitation in the EFSR
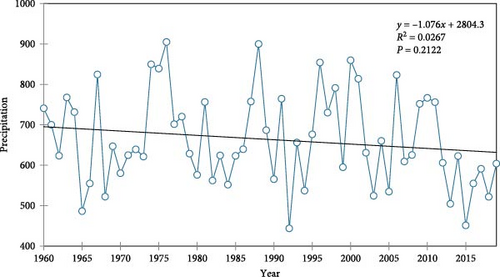
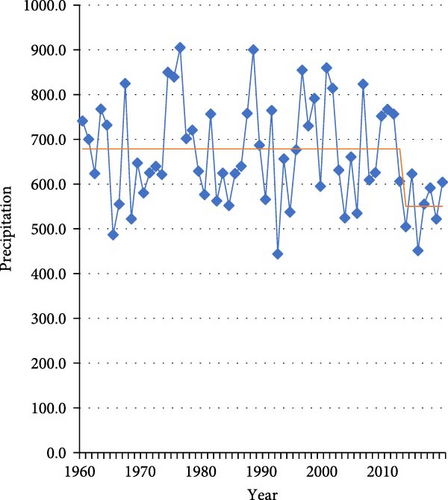
Figure 13 shows the annual average precipitation for the period 1960–2019. The mean annual rainfall of the area during the study period was 663.6 mm, with a standard deviation of 114.9 mm. The minimum rainfall recorded was 443.9 mm, and the maximum ever recorded rainfall was 905.1 mm.
3.2.3.1. MK and Innovative Trends Analysis
Average precipitation time series were analysed for trends using the MK and ITA tests on an annual scale. Table 7 results indicate the p-value is higher than the significance level (0.05), which means one rejects the alternative hypothesis H1 and accepts the null hypothesis H0.
The results show that there has been a decrease in precipitation, but not significant at a 5% significance level since the computed value (p-value (0.174) > 0.05). SS of annual mean precipitation was −1.064 mm/annum, respectively. Table 7 shows the trend indicator, the slope of the trend indicator, the upper confidence level, and the lower confidence level (CI 95%) ITA for annual rainfall.
Results showed that the slope of the ITA test value was negative (−2.598). Figure 14 below shows that the scatter points of annual precipitation fall below the 1:1 line in the Cartesian coordinate system, suggesting a decreasing trend in annual rainfall with a −1.32009-trend indicator value (Table 7).
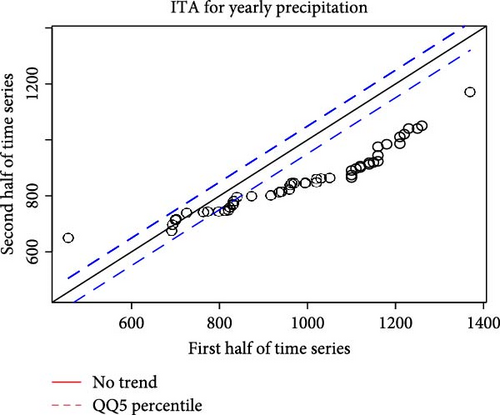
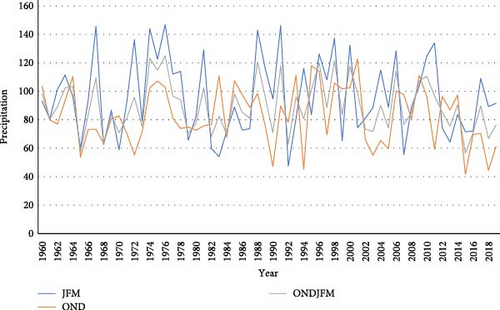
Figure 15 illustrates the distribution of seasonal average precipitation JFM, OND and ONDJFM over the EFSR.
3.2.3.2. Change Point Detection
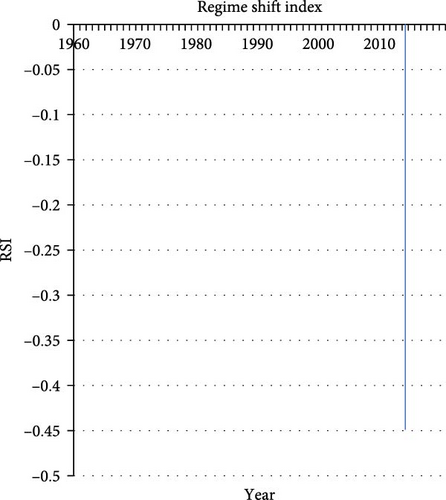
With respect to the regime shift in the mean for average precipitation shown in Figure 16, one shift occurred in 2013 with RSI of −0.4486. The results imply that the region has experienced reduced rainfall, hence compromising water source for the communities and its economic activities.
3.2.3.3. Spatial Analysis of Total Annual Precipitation in the EFSR
Figure 17 presents the temporal and spatial analysis of annual precipitation from 1960 to 2019. The results (Figure 17) show that the average total precipitation values differ markedly across the region. The highest annual precipitation value was recorded in 2000, when the value ranged between 738 and 1120 mm. The lowest annual average precipitation value was recorded in 1965, when the value ranged between 319 and 687 mm. A significant drop in annual precipitation was experienced in 2005 when the highest precipitation values ranged between 738 and 1120 mm and in 2005 when they ranged from 408 to 644 mm. High rainfall is more prominent in the south or eastern part of this region, especially under the high elevation zone (Phuthadjithaba and Vrede).
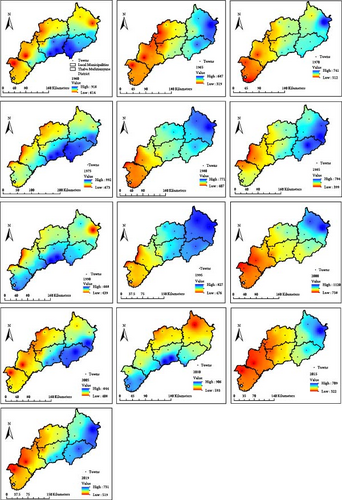
Among the sampled households in Phuthaditjhaba, 51% and 50% in Vrede perceived reduced rainfall over the past years. The respondents from Qwaqwa village said they have experienced low rainfall and erratic rains that have resulted in the drying out of water bodies, leading to reduced water availability for the local communities. From Vrede, one of the respondents reported that the Emanzini Dam dried up due to the drought and low rainfall, leaving to the local communities facing water shortages. However, some respondents in this high elevation zone reported that the rain has increased by 32% in Vrede and 41% in Phuthaditjhaba.
The spatial analysis showed that the sampled towns in the low elevation zone experienced low rainfall compared to the high elevation zone. According to the analysis, the sampled towns at low elevation (Ladybrand and Marquard) had the lowest rainfall in 1965 (319 mm) and 2015 (322 mm). This is consistent with the perceptions held by the respondents from Ladybrand (68%) and Marquard (38%), who reported a decrease in rainfall, respectively.
The respondents from this part of the region also reported incidents of water shortages, affecting both agriculture-based and socioeconomic activities since 2015. The water crisis is a serious issue reported in the selected towns, and the local communities are facing issues in accessing safe and ample amounts of water for drinking and domestic household consumption. On the contrary, under the low elevation zone, in Marquard more respondents (53%) reported that the rain has increased compared to opposite opinion of reduced rainfall. While in Ladybrand more surveyed households reported reduction in rainfall, which confirms in the trend analysis.
However, most of the respondents who perceived a rise in the amount of rainfall received were referencing the recent increase in rainfall during the JFM season. Figure 13 indicates that though there was a sharp drop in precipitation from 2015 to 2018, the analysis shows an increase in seasonal precipitation from 2018 to 2019. This might indicate that since 2019 up to the time the survey was done (2021 July), the local communities have been experiencing higher rainfall during the JFM/OND season compared to the previous years. For example, some respondents from Ladybrand and Marquard said the following: “We had too much rain this year (2021).” “We had too much rain last year,” he said. “Past years there was no water, but last year and this year we had more rain.” We had early rain this year and last year we had more rain than usual. Other respondents from Phuthadjithaba and Vrede also noted similar reports concerning receiving more rain in recent years, saying, “In the last 5 years the rain has been less, but we received good rain last year.” This might indicate that it is easier for some local communities to perceive recent changes in climate or extreme events related to climate variability than the events that occurred some years ago.
3.2.4. Drought Indices
The SPI was computed for OND, JFM and ONDJFM season/sub-seasons for the EFSR.
The seasonal averaged SPIs for the EFSR were plotted for the three seasons: OND, JFM and ONDJFM for the 1961–2019 period. The findings in Figure 18 a,b and Figure 19 show the SPI variations over time for all the seasons analysed. The severe droughts occurred in the year 1973 (−1.21), 1983 (−1.755), 1992 (−1.55) and 2016 (−1.10) during the JFM subseason. Intense droughts that occurred in the 1990 (SPI = −1.91) during the JFM subseason. The OND seasons’ most intense droughts were recorded in 1994, 1990 and 2019, all with SPI <−1.645. The other three OND seasons that experienced moderate droughts were recorded in 2011, 2015 and 2018.
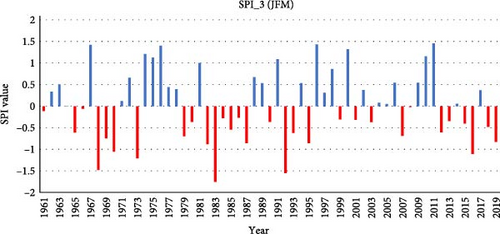
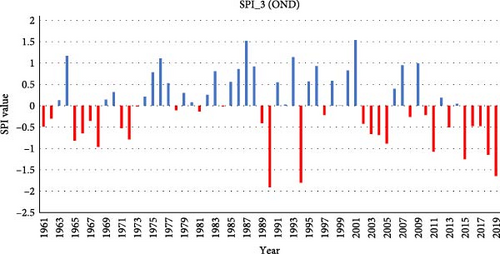
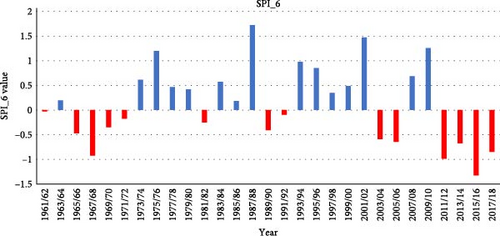
The respondents stated that the rainy season starts late during the OND season and ends late during the JFM season, indicating more rain received in JFM compared to OND. Most respondents perceived drought would lead to changes in water quantity. Dramatic shifts are expected in the precipitation patterns because of incidents of consecutive dry years along with reduced rainfall and increasing temperatures. Consequently, this will intensify the hydrological cycle through increased evapotranspiration, reducing water yield from water bodies, limiting water supply in the region. The JFM season identifies the following wet seasons with SPIs ≥ 1.282; 1967, 1976, 1996, 2011 and 2000, respectively. On the other end, the severely wet years that recorded SPIs ≥ 1.282 at the OND season were 1987 and 2001, while moderately wet years were recorded in 1964, 1976 and 1993. The reason for more years of drought events during OND season compared to JFM might be due to one of the observed changes in precipitation patterns that were reported by the respondents during the survey.
The SPI_6 (ONDJFM) identified four seasons whose droughts were in wet seasons/years category, including 1975/76, 1987/88, 2001/02 and 2009/10, all of which were between moderately wet to extremely wet. There was severe drought (SPI ≤ −1.282) identified by the SPI_6 ONDJFM during 2015/16 with SPI value −1.325. The slightly drought to moderate droughts were identified, including 1967/68, 2011/12 and 2017/18.
3.3. Perceived Impacts of Climate Change and Variability
The impacts of climate change and variability were recognised by the respondents in the region (Figure 20). The respondents (90.5%) from the sampled towns indicated that climate change and variability impact their crop and livestock-based livelihoods, reduce the availability of water for crops, livestock and domestic purposes, thus affecting their socioeconomic systems. This shows that the households in the EFSR are vulnerable to the impacts of climate change that directly and indirectly affect their livelihoods. Thirty-eight (9.5%) of the respondents reported no effects of climate change and natural disasters on their livelihoods.
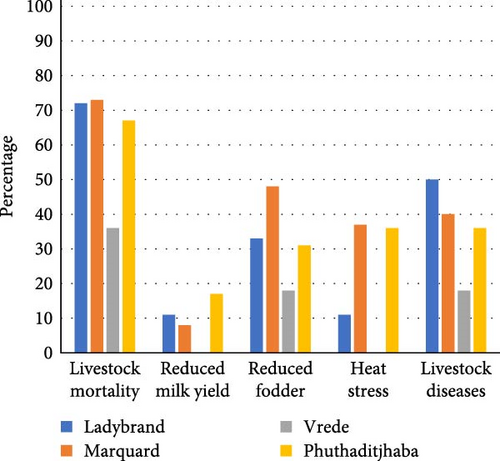

Slightly more than 50% of the respondents expressed concern about reduced water availability as a result of low rainfall, increased summer temperatures and drought incidents. The respondents reported that water shortages have resulted in increased labour, as many household members travel long distances to fetch water for domestic purposes, as well as for their livestock, and for backyard gardening. Due to water scarcity, households that depend on on-farm activities, experience low crop yields and shortages of water for domestic purposes and livestock, leading to low on-farm income and increased food prices. Figure 20 shows the impacts of climate change on crop and livestock-based livelihoods in the region.
Livestock dependent households mentioned climate-induced impacts on livestock farming, namely, livestock diseases, reduced milk yield, reduced fodder, heat stress and livestock death. In the lower elevation zone, in Marquard in particular, most respondents reported incidents of reduced livestock fodder and heat stress, while in Ladybrand, most respondents reported livestock diseases and reduced milk yield. In the higher elevation zone, most respondents from Phuthadjithaba reported increased livestock diseases, reduced milk yield, reduced fodder, heat stress, and livestock deaths compared to Vrede.
The results (Figure 20) revealed that households that depend on backyard gardening as their main source of subsistence faced problems such as crop loss, reduced crop yield, crop pests and diseases, delayed crop harvest and crops affected by frost due to reduced rainfall, erratic rainfall, delayed onset of rainfall, and climate hazards. Some respondents reported that they have reduced the number of crops they grow or abandoned crop farming altogether. The significant difference between the two elevation zones was that none of the respondents in the lower elevation zones reported crop damage due to frost. In comparison to the other towns, most respondents in Phuthaditjhaba reported incidences of crop pests and diseases, as well as crop loss.
The respondents perceived the main socioeconomic impacts of climate change to be loss of income, health problems, labour, loss of employment, and additional costs. The respondents reported additional costs related to climate change, including buying more supplementary feed to cover for delayed regeneration of pastures due to delayed or low rainfall, buying water for drinking because of low water shortages, and buying more firewood or gas to provide warmth during cold weather. Only 20 respondents stated that reduced crop yields, and loss of on-farm employment had accelerated the loss of on-farm income. Only 26 respondents stated that they faced climate-related health problems.
3.4. Climate Change Adaptation Strategies Adopted by Households
The adaptation strategies adopted by the households include water and soil management strategies, crop and livestock management strategies, and socioeconomic strategies. The respondents (60%) responded to water shortages by seeking alternative water management strategies such as harvesting rainwater, buying water, and storing water in containers. Purchasing of supplementary feeds (46%), and the introduction of drought resistant livestock species (34%) were some of the responses adopted by households to climate change. The respondents reported that they use different adaptation strategies to improve crop production, through use of different seed varieties that are drought or frost resistant (33%), and soil management strategies (45%) such as mulching and application of organic and inorganic fertilisers. Households used different organic fertilisers such as livestock manure, vegetable leaves, maize stalks, grass and tree leaves to improve soil fertility.
Income diversification was one of the primary activities that the respondents were engaged in to pursue additional income sources. Some respondents mentioned self-employed based activities linked to trading, construction, shop ownership, moneylending and land leasing, as their main adaptation strategies. The households diversified their on-farm revenue by selling livestock, livestock and crop products, fodder, forest resources, and leasing out portions of farmland. Remittances (18%), government wages (49%), pensions (26%), and grants (24%) were among the other sources of income mentioned by the respondents. This indicates that the households in the EFSR were engaged in more than one source of income in order to cope with climate change.
Fifty-four percent of the respondents reported that they receive help from neighbours and/or relatives within the same or outside town to cope with the effects of climate change. Provision of temporary jobs, assistance in partaking cultural activities, sharing of labour and income across households, borrowing money from family or neighbours, getting help in the form of food, water, livestock feeds, livestock manure and rendering labour to affected families are some of the social relation activities reported by the respondents as ways of adapting to climate change. The respondents acknowledged that having access to social relationships through familial networks and communities improved access to resources and lessened the impact of climate change and extreme weather events.
4. Discussion
The study revealed that there has been growing evidence of altered weather systems since 1960. This study revealed that maximum and minimum temperatures both increased substantially between 1960 and 2019, while precipitation decreased during the same period. The results from the MK test and the ITA test showed that maximum and minimum temperatures increased (p < 0.05). The SRSD method detected an abrupt shift in minimum temperatures in 1982, suggesting that winters have become warmer over the years. Spatial analysis indicated that minimum temperatures rose from an average of 8°C in 1960 to 10°C in 2019, with the highest values recorded in 2019. The findings concur with some of the studies by Almeida et al. [67] and Asfaw et al. [60], where the trend analysis result of minimum temperature showed a statistically significant increase.
The study also highlighted the spatial and temporal variability of Tmax values from 1960 to 2019. Maximum temperatures increased from 23°C in 1960 to 26°C in 2019, with the highest Tmax values recorded in 2015 and 2019 and the lowest in 1975 and 2000. The spatial analysis showed that the change in maximum temperatures was similar across the sampled towns, with variations of about 3°C. These results are similar to those of studies conducted in mountain environments in South Africa [5, 35, 50], where maximum temperatures have increased. The current findings of the ITA for maximum temperature are consistent with the increasing trend in maximum temperatures observed in the Buffalo Catchment, Eastern Cape, South Africa [27]. The SRSD revealed an abrupt shift in both minimum–maximum temperatures and precipitation. An abrupt increase in Tmax was detected in 2003 (RSI of 0.9296) and another shift in 1982 (RSI of 0.2326). These temperature changes negatively impact farming operations and water resources in the region.
Trends of precipitation-based indices showed that there is no significant decrease in annual rainfall. The MK and ITA tests showed a decreasing trend in annual precipitation, although this decrease was not statistically significant at the 5% significance level (p-value = 0.174). SS estimated an annual mean precipitation decrease of −1.064 mm per annum, and the ITA test slope also indicated a negative trend (−2.598). Similar trends were reported in a decreasing trend of annual rainfall in Alemketema and Mehalmeda, Jemma Sub-Basin and Wabe Shebele River Basin, Ethiopia, where a non-significant decreasing trend in annual precipitation was detected [26, 61]. On the contrary, the findings do not concur with the study conducted in Debrebirhan and Fichie, Jemma Sub-Basin, Ethiopia, which indicated a statistically significant increase in annual rainfall trend [61]. Studies by Gurara et al. [26] and Bouklikha et al. [68] in the Wabe Shebele River Basin, Ethiopia and Tafna watershed, Northwest Algeria, reported a decreasing trend in annual rainfall using the ITA method. However, Matenge et al. [69] reported an increasing trend of rainfall in Masunga, Matsiloje, Sebina and Siviya stations, Botswana, using ITA test, which was contradictory to the findings of this study. The regime shift detection (RSI) method identified a significant shift in 2013, suggesting reduced rainfall and potential impacts on water resources and economic activities. The findings of the spatial analysis showed that the change in rainfall patterns varied across the elevation zones, with the highest annual precipitation recorded in 2000 (738 to 1120 mm) and the lowest in 1965 (319 to 687 mm). For example, more years of high rainfall were received in the higher elevation zone (Vrede and Phuthadjithaba) than in the lower elevation zone (Marquard and Ladybrand). The years of high rainfall also varied within the same elevation zones. For instance, under the high elevation zone, the spatial analysis shows that Phuthadjithaba receives more years of high rainfall than Vrede. Such a high divergence of rainfall distribution, according to Tesfamariam et al. [70], might be attributed to the variability of topography across regions, which creates different microclimates.
The SPIs of the significant drought events in the region were experienced. The droughts during the JFM seasons were primarily moderate to severe, with only 1 year of extreme drought events. Severe droughts were identified during the JFM subseason in 1973, 1983, 1992 and 2016, while intense droughts occurred in 1990. The OND season also experienced intense droughts in 1994, 1990, and 2019, with moderate droughts recorded in 2011, 2015 and 2018. The SPI_6 (ONDJFM) highlighted wet seasons in 1975/76, 1987/88, 2001/02 and 2009/10, with a severe drought in 2015/16. This was consistent with other studies that stated moderate to severe/extreme drought conditions [4, 50, 71]. For example, the findings highlighted by Abubakar et al. [50] indicated that the Setsoto Local Municipality, Free State, had experienced moderate-to-extreme drought conditions with 4–6 drought events occurring in a 35 year period. The results above show consecutive years of dry years from 2015 to 2019, indicating that the local communities have been facing droughts for some time. It is expected that in the future, the severity of droughts will increase in the province, as a result of climate change. Increasing temperatures and a high intensity of drought, resulting from excessive evapotranspiration will reduce the availability of water resources for crop farming [72], putting the livelihoods and economies of these local communities in the region at risk. According to regional climate model forecasts, droughts are projected to occur more frequently and with greater severity in this region because of global warming [71]. For example, during a prolonged drought in the Free State province, several agriculture-based households suffered from lack of food, malnutrition, and lower income [71]. Such further studies could be valuable for planning and formulating drought adaptation or mitigation strategies.
The majority of households were well-aware of climate variability and change. The study found that households had perceived and experienced changes in climate (Table 4), and their perceptions were similar to the climatic trends. They revealed their local experience of a changing climate based on variability in the starting and ending of rainfall, decreased rainfall, increased drought events, and increased summer temperatures. This suggests that farmers were in a good position to understand the changes in the climate of their environment [73]. However, the household’s impressions are likely to be biased towards the second half of the study period, and having a climate record supports the research. Most of the households interviewed said that the climate has changed in the last 5–15 years, resulting in climate change implications on their livelihood activities.
In this study, we found that households perceived changes in minimum and maximum temperatures. The local communities perceived that the summer temperatures had increased and the minimum temperatures had decreased. The perceptions of farmers regarding summer temperature changes as described by the respondents in our study area are consistent with recent studies in other parts of Africa [74, 75]. Although temperatures are increasing in both elevation zones, the perceptions of temperature changes are not exactly the same. More households in the lower elevation zone perceived increased maximum temperatures than in the higher elevation zone. The spatial analysis also shows that the households in the elevation zone experienced an increased Tmax between 23 and 26°C, while on the high elevation, the households experienced increased Tmax between 19 and 23°C. From the findings of the study, it is clear that households from lower elevation zones are affected the most by hotter environmental conditions and reduced rainfall and associated problems. A similar trend was also reported in Phuthaditjhaba, where the local households reported that minimum temperatures have reduced [76]. Moeletsi et al. [47] stated that there is a potential for early frost starting and delayed frost ending in the eastern and south-eastern areas of the region. This may have contributed to local communities in high elevation zones spending more money to provide warmth than those in low elevation zones. Furthermore, some Qwaqwa respondents reported that there is no moisture on the grass due to the warming of the winter season, hence the fodder for their livestock is dry and less palatable.
Climate data (Figure 13) showed that precipitation was decreasing and there were longer dry periods, which was reflected in respondents’ views of decreased rainfall. A substantial proportion of respondents from Phuthaditjhaba (51%), Ladybrand (68%) and Vrede (50%) reported reduced rainfall over the years, consistent with scientific observations. However, some respondents in these high elevation zones also reported increased rainfall (32% in Vrede and 41% in Phuthaditjhaba), possibly reflecting recent increases in seasonal precipitation from recent years. Similar perceptions were also shared by households that were recently surveyed in similar studies in Mount Kilimanjaro and Udzungwa, Tanzania and Kashmir Valley, India [74, 77]. The information collected from the households revealed that they face water deficits due to reduced rainfall and drought. However, while the spatial analysis may show that Phuthadjithaba receives more rainfall, respondents’ perceptions suggest otherwise. The differences in household perceptions and the spatial analysis might indicate that households are more likely to monitor climatic variables linked closely to their livelihood activities. The observed increase in minimum temperatures and the discrepancy between scientific data and community perceptions underscore the importance of enhancing climate education.
The variability in perceptions highlights the complexity of understanding local climate impacts. Some respondents noted recent increases in rainfall during the JFM season, which aligns with perceptions about increasing seasonal precipitation between 2018 and 2019. For example, respondents from Ladybrand and Marquard reported more rain in 2021 and 2020 compared to previous years, indicating the significance of recent climatic events in shaping local perceptions. The consistent reports of water shortages and drying water bodies, such as the Emanzini Dam in Vrede, emphasise the adverse impacts of reduced rainfall on local communities and their agricultural and socioeconomic activities. Policymakers must consider these insights when designing context-specific adaptation measures to address the varied impacts of climate change and ensure sustainable livelihoods for local communities. Effective water management strategies are crucial to mitigate the effects of fluctuating precipitation patterns and to improve water security in the region.
The changes highlighted in the results of this study have important implications for both the state of the environment and livelihoods in the EFSR. The impact of reduced precipitation and Tmin, increased Tmax and droughts was evident in many ways. Consequently, the respondents highlighted a shift in livelihood activities. The impacts of climate change and variability were recognised by the respondents in the EFSR, with 90.5% indicating significant effects on their crop and livestock-based livelihoods, water availability, and socioeconomic systems. This highlights the vulnerability of households in the EFSR to climate change, which directly and indirectly affects their livelihoods. Slightly more than 50% of the respondents expressed concern about reduced water availability due to low rainfall, increased summer temperatures, and drought incidents. Most respondents reported that they have stopped some of their livelihood activities that are related to climate due to climate change. Among the household members interviewed in the EFSR as a whole, agriculture-based livelihoods have reported the implications of fluctuations in rainfall as reduced crop yields, reduced quality of pastures, shortage of water, and lower winter fodder production. Late onset of rainfall and late cessation of frost might also contribute to alteration of crop calendar, delayed harvest and reduced crop yields and livestock fodder for the local communities. Tongwane et al. [51] assert that medium-late season maize varieties sown in November in most of the eastern and south-eastern parts of this region are at significant risk of crop failure because of frost occurrences in April and May. A study conducted in the Free State Province revealed that in the year 2015 agricultural lands, and cultivated grasslands were affected by droughts [71]. Any limits imposed on crop and livestock production indicate that food insecurity and rural poverty will worsen among the local communities that rely on agriculture for their sustenance. Indirect impacts include the increased costs of industrial and agricultural products as water scarcity increases, making these products, including food, more expensive, which may affect the livelihoods of communities in the region. Exposure to higher temperatures, reduced precipitation, and high drought risk have not only had negative consequences in the study area but also in many other parts of the country [11, 78, 79]. However, the actual impacts of these climate-related events remain unknown [80], but the changes highlighted in this study have important implications for both the environment and livelihoods in the EFSR.
Different households perceive climate change and its implications differently according to the altitudinal zones in which they live. As a result, households in the higher elevation zone should prioritise the implementation of adaptation techniques that protect crops against frost, pests, and diseases, such as the planting of frost-resistant crops and pesticide application. The research underlines the value of local contexts and demonstrates the need to avoid broad generalisations about climate change implications, particularly in mountainous places [28]. This implies that local communities in different elevation zones require more targeted adaptation measures to mitigate the effects of temperature and precipitation changes.
Evidence from the study indicates that there are attempts by households to introduce adaptation strategies in order to adapt to climate change and variability. The main adaptation measures implemented by the local communities in the EFSR include water management strategies, crop diversification, sourcing of supplementary livestock feeds, use of drought-tolerant livestock, formal support from the local government, and informal support from relatives and neighbours. Studies done by Talanow et al. [81] and Nembilwi et al. [82] list some climate change adaptation strategies implemented by communities in South Africa. This could imply that most people in South Africa are facing similar climate-related risks. As a result, rapid climatic changes have a negative impact on resilience and the development of coping and adaptation mechanisms, particularly in rural areas where autonomous adaptations are the norm. Furthermore, such strategies are considered ineffective due to abrupt adjustments that catch communities off guard and leave them exposed to the consequences of these shifts. Limited adoption of measures such as growing frost-resistant crops and soil management strategies may be due to lack of resources or knowledge to implement advanced measures at a household level. This is supported by the findings from [83], who found that a lack of information and resources are constraints to the implementation of climate change adaptation methods.
The present study found that some local communities were implementing combined adaptation measures. Such decisions by the communities could indicate that more than a singular strategy is needed to adjust to climate change impacts. Engaging in different livelihood strategies buffers households from the uncertainties of climatic risks. According to Brown et al. [84], rural households with a greater diversity of assets and livelihood options are likely to be more resilient because of a higher capacity to substitute alternative livelihood strategies in times of climatic stress, especially when alternative livelihood options differ in exposure to external pressures. Several studies have been reported regarding local households who took loans, pursued additional income sources (sold labour, revenue from the small shop), and sold livestock to repair damaged houses and recover from agricultural losses [78, 85].
5. Conclusion
This study investigated the variability and trends in the EFSR’s annual average minimum–maximum temperatures, precipitation, and SPI 3 (JFM and OND) and SPI 6 over a 59-year period. Both the MK test and the ITA test showed statistically significant increases in annual minimum temperatures and minimum temperatures in dry seasons. The SPI data indicated severe droughts during specific periods, consistent with respondents’ perceptions of increased summer temperatures, decreased winter temperatures, altered precipitation patterns, and more frequent droughts. These changes highlight the vulnerability of local communities in the TMD. The observed climatic trends necessitate the implementation of effective adaptation strategies, such as water and soil management, crop and livestock management, and socioeconomic measures.
Most respondents cited an increase in summer temperatures, a decrease in winter temperatures, changes in precipitation patterns, a decrease in precipitation during the OND and JFM seasons and increasing drought episodes. The respondents’ views of changes in maximum temperature, precipitation, and droughts are consistent with climatic data. As a result, the local communities in TMD are vulnerable to changes in temperature and precipitation, as well as drought conditions. The MK test and the ITA test show annual minimum temperature and minimum temperature in dry seasons are increasing, respectively. The data show a statistically significant trend (p < 0.05) for maximum–minimum temperatures. The SRSD method (change point detection method) results revealed an abrupt change in maximum–minimum temperatures and precipitation. SPI data show that severe droughts occurred during the JFM subseason in 1973 (−1.21), 1983 (−1.755), 1992 (−1.55) and 2016 (−1.10). Droughts were severe in 1990 (SPI = −1.91) during the JFM subseason. The most severe droughts in the OND seasons were recorded in 1994, 1990 and 2019, all with SPI −1.645. The respondents reported that their lives and livelihoods have also shifted due to changes in climate, leading to implications for the agricultural and socioeconomic systems. Water and soil management strategies, crop and livestock management strategies, and socioeconomic strategies are among the adaptation strategies used by the households. In view of the findings, altitudinal differences in climatic conditions present different types of hazards, hence the need for the policymakers and stakeholders to design context-specific adaptation measures. Policymakers must design context-specific adaptation measures to address the varied impacts of climate change across different altitudinal zones, ensuring sustainable livelihoods for local communities.
Ethics Statement
Prior to the start of the study, an ethical approval from the University of the Free State’s General/Human Research Ethics Committee (GHREC) (Ethical Clearance Number: UFS-HSD2020/1277/0709).
Consent
An informed written consent to participate in the research was obtained.
Conflicts of Interest
The authors declare no conflicts of interest.
Funding
The National Research Foundation (NRF) provided financial support towards this research.
Open Research
Data Availability Statement
The datasets generated and analysed during the current study are presented in the main manuscript.


