Experimental Study on the Rheological Properties and Pipeline Resistance of Filling Slurry Containing Modifiers in Phosphate Mines
Abstract
Aiming at the technical challenges in the phosphorous mine in Hubei, China, such as, filling the long-distance and complex working conditions of coarse-grained tailings, the flow and long-distance pumping resistance characteristics of coarse-grained tailings filling slurry were studied by loop test and numerical simulation method. The main innovations achieved in this study are as follows: (1) the CSKY01 filling modifier, Independently developed by Changsha Institute of Mining Research Co., Ltd., can significantly improve the flowability of the coarse-grained tailings’ total solid waste filling slurry, (2) the multi-loop full-scale loop test shows that the slurry flow resistance increased by about 4% to 13% after stopping the pump for 0.5 to 24 h and restarting, (3) the resistance loss along the pipeline was found to be directly proportional to the slurry transportation speed and inversely proportional to the pipeline’s cross-sectional area. A reasonable pipe diameter and flow rate for the transportation of filling slurry were determined through pipeline resistance loss and cost–benefit analysis, (4) a total solid waste filling system was constructed to handle long-distance and complex working conditions. The system achieved a filling speed of 80–100 m3/h, with a filling concentration of 82%–84%, and the slurry in paste form allows the filling system to run smoothly. A field industrial test confirmed that the strength of the stope filling-body R28 reached 4.2 MPa, which can meet the requirements of mining safety. This study successfully demonstrated the comprehensive utilization of all solid waste resources in phosphate mines, providing a promising idea for the green mining of phosphate mines.
1. Introduction
The backfill mining method can effectively deal with mined-out voids, control surface settlement, and significantly reduce the safety risks caused by the tailings ponds [1–5]. The conveying characteristics of the filling slurry are crucial for ensuring the safety, stability, and economic efficiency of mine filling systems. The long-distance pumping and transportation of coarse-grained tailings filling slurry present significant challenges [6–11], making this research highly valuable. Currently, phosphate mines at home and abroad mainly choose filling materials that are versatile, cost-effective and have stable physical and chemical properties. Among them, ordinary Portland cement is the most commonly used. In construction, low-cost materials, such as slag, fly ash, and slag, are often used to replace high-cost cement [12–20]. However, phosphate tailings and fly ash are rarely used as filling materials for pipeline transportation. In phosphate mines, phosphate tailings offer more abundant and less toxic advantages than phosphogypsum. In recent years, researchers have begun exploring the use of cemented phosphorus tailings for filling mined-out areas [21–23]. The gradation and slurry workability of coarse phosphorus tailings combined with fly ash as raw materials for cemented filling were studied. It was found that the chemical properties of coarse phosphorus tailings are stable, but their physical properties are poor. Mechanical crushing is necessary before the tailings can be used for cemented filling [24]. With the progress of filling technology and the development of filling modifiers, such as water-reducing agents, retarders, and thickeners, the filling of solid waste, including coarse phosphate tailings, has become a new trend.
The challenges faced by the phosphorous mine in Hubei, China, where the rebuilding of tailings ponds is prohibited, include difficulties in discharging tailings, as well as high treatment and maintenance costs. In view of the problems in the treatment of mine tailings and the transportation of filling slurry, experiments have been conducted on the physical and chemical properties of crushed phosphate rock tailings, filling materials, and cementing agents. Furthermore, the flow and resistance characteristics of thick tailings filling slurry containing modifiers have been analyzed. The research highlights the critical role of the modifier-containing agent in improving the fluidity, cohesion, and water retention of the filling slurry. It verifies the necessity and importance of the developed modifier for long-distance low-pressure pumping of filling slurry. The experimental findings provide crucial technical support and practical engineering cases for the comprehensive utilization of solid waste resources, such as phosphate mine tailings. The findings have significant guiding implications and promising potential for widespread application in the construction of phosphate mines.
2. Materials and Testing Plan
The mining site covers an approximate area of 20 km2 and employs the room and pillar mining method. Due to the high and steep terrain, there is no viable location for constructing tailings ponds within the mining area. Consequently, the discharge and processing of tailings present significant challenges, accompanied by high maintenance costs. Tailings, fly ash, and other solid wastes from the mine are repurposed as filling aggregates. Long-distance pumping for extensive areas, followed by subsequent cemented filling technology, is employed to manage the mined-out areas. The filling pipeline extends roughly 8.0 km. It is imperative that the resultant filling body exhibits a strength of R28 ≥ 4 MPa while also adhering to a cost requirement of less than 100 yuan/m3 for filling the mine chambers.
2.1. Filling Aggregates
The filling aggregates that can be used in this study include the coarse-grained tailings produced by gravity separation, fine-grained tailings after crushed, and flotation tailings of phosphate ore. The filling slurry must behave as a structured flow for efficient transport, requiring the content of −25 μm solid particles not to be less than 20%.
2.1.1. Coarse and Fine-Grained Tailings
The density of the filling aggregates was measured using the pycnometer method, while the bulk density was determined through the bulk density cylinder method [25–31]. The results of basic physical parameters of the coarse and fine-grained tailings are shown in Table 1.
| Aggregate type | Density/(g/cm3) | Bulk density /(g/cm3) | Porosity/% |
|---|---|---|---|
| Coarse-grained tailings | 2.63 | 1.46 | 44.49 |
| −10 mm fine-grained tailings | 2.65 | 1.51 | 43.02 |
| −5 mm fine-grained tailings | 2.68 | 1.58 | 41.04 |
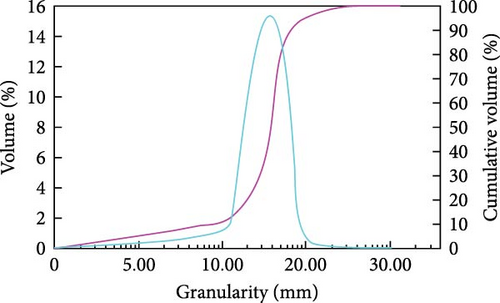
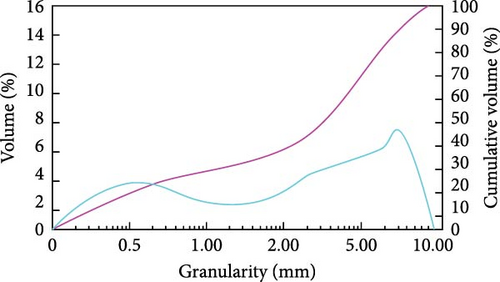
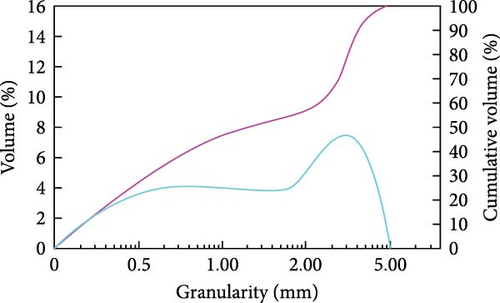
The particle size distribution of coarse tailings is shown in Figure 1a, and the analysis shows that the particle size of coarse-grained tailings ranging from 10 to 20 mm accounts for 84.83%. However, the coarse-grained tailings must be crushed and screened to meet the needs of filling aggregates. The particle size distribution of −10 and −5 mm fine-grained tailings after crushed are shown in Figure 1b, c, respectively. According to the results of the tailings crushing test, the content of −25 μm particles is 19.14% when the coarse-grained tailings are crushed to −5 mm. The chemical composition of coarse and fine-grained tailings was analyzed by spectrum, as shown in Table 2, and the results showed that coarse and fine-grained tailings did not contain harmful substances. Therefore, the selection of −5 mm fine-grained tailings for filling aggregate can meet the requirements for the preparation of filling slurry.
| Chemical composition | F2O | Na2O | MgO | Al2O3 | SiO2 | P2O5 | SO2 | ClO2 |
|---|---|---|---|---|---|---|---|---|
| Content/% | 1.800 | 0.195 | 2.786 | 1.920 | 6.582 | 8.592 | 0.875 | 0.029 |
| Chemical composition | K2O | CaO | Ti2O3 | Cr2O3 | Mn2O5 | Fe2O3 | NiO | CuO |
| Content/% | 1.380 | 28.630 | 0.273 | 0.017 | 0.025 | 1.595 | 0.040 | 0.017 |
| Chemical composition | ZnO | Rb2O | SrO | ZrO2 | NbO | PbO | — | — |
| Content/% | 0.008 | 0.001 | 0.049 | 0.009 | 0.001 | 0.016 | — | — |
2.1.2. Flotation Tailings
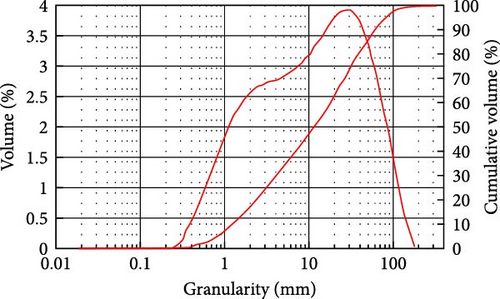
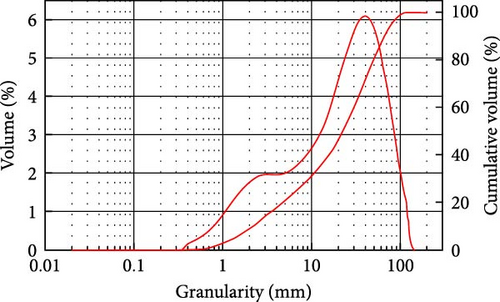
The test results show that the density of flotation tailings is 2.57 g/cm3, the bulk density is 1.29 g/cm3, and the porosity is 49.81%. The particle size distribution of the flotation tailings is critical for the entire filling process and significantly influences slurry preparation, transportation, and filling quality. Utilizing a laser particle size analyzer, we analyzed the flotation tailings’ particle size distribution, with the results depicted in Figure 2. Based on measurements obtained from the laser particle size analyzer, key particle size parameters of the flotation tailings were calculated using formulas (1 and 2). These parameters include d10 = 1.248 μm, median particle size d50 = 11.351 μm, and d90 = 60.446μm. The specific surface area is 1.67 m2/g, the average particle size is 22.475 μm, and the uniformity coefficient Cu is 13.802.
The chemical composition of flotation tailings is shown in Table 3. The results show that the content of harmful substances in flotation tailings is very low and can be ignored, which indicates that it is suitable for filling aggregate in line with environmental protection standards. However, the high content of magnesium oxide and sulfur in the flotation tailings may adversely affect the strength of the backfill.
| Chemical composition | NaF | Na2O | MgO | Al2O3 | SiO2 | P2O5 | SO2 | ClO2 |
|---|---|---|---|---|---|---|---|---|
| Content/% | 2.558 | 0.271 | 4.643 | 3.627 | 14.104 | 19.679 | 1.750 | 0.055 |
| Chemical composition | K2O | CaO | Ti2O3 | Cr2O3 | Mn2O5 | Fe2O3 | NiO | CuO |
| Content/% | 1.663 | 40.082 | 0.410 | 0.025 | 0.043 | 2.279 | 0.051 | 0.021 |
| Chemical composition | ZnO | Rb2O | SrO | ZrO2 | NbO | PbO | — | — |
| Content/% | 0.010 | 0.001 | 0.058 | 0.012 | 0.001 | 0.017 | — | — |
2.2. Cementing Agent and Fly Ash
2.2.1. Cementing Agent
According to the mix ratio test results, the strength of P.O 42.5 cement is 20%–40% higher than that of P.O 32.5 cement test block at the same content. Therefore, P.O 42.5 cement can be used as the cementing material.
2.2.2. Fly Ash
In this study, fly ash was added as a supplementary fine-grained composition to increase the content of −25 μm solid particles in the filling materials. The laser particle size analyzer was used to analyze the particle size distribution of fly ash, with the test results illustrated in Figure 3. The main particle size parameters of the tailing sludge are calculated as follows: d10 = 2.206 μm, median particle size d50 = 6.334 μm, d90 = 69.596 μm, the specific surface area is 0.947 m2/g, average particle size is 30.084 μm, and uniformity coefficient is 13.87. The chemical composition of fly ash was analyzed using spectral analysis. The analysis results are presented in Table 4.
| Chemical composition | Na2O | MgO | Al2O3 | SiO2 | P2O5 | SO2 | ClO2 | K2O | CaO |
|---|---|---|---|---|---|---|---|---|---|
| Content/% | 0.845 | 1.343 | 26.330 | 51.214 | 0.318 | 2.640 | 0.125 | 3.254 | 2.786 |
| Chemical composition | Ti2O3 | V2O5 | Cr2O3 | Mn2O5 | Fe2O3 | NiO | CuO | ZnO | Ga2O3 |
| Content/% | 1.007 | 0.066 | 0.045 | 0.059 | 8.793 | 0.018 | 0.034 | 0.219 | 0.005 |
| Chemical composition | SeO2 | BrO2 | Rb2O | SrO | ZrO2 | BaO | PbO | — | — |
| Content/% | 0.007 | 0.013 | 0.001 | 0.058 | 0.012 | 0.172 | 0.017 | — | — |
2.3. Modifier
The coarse-grained tailings filling slurry pumping technology requires high fluidity, cohesion, and water retention in the slurry. To meet these demands, the CSKY01 filling modifier, which integrates various additives, such as a water-reducing agent, air-entraining agent, and retarder, was independently developed. Specifically, it utilizes a slump-reducing agent to enhance flow and reduce water consumption, a K12-type air-entraining agent to improve suspension performance, and sodium gluconate as a retarder. When the CSKY01 modifier is added, the slurry becomes more homogeneous, remains stable over time, achieves a high concentration, and maintains good fluidity. The coarse particles exhibit high suspension performance, fine powder particles are uniformly dispersed, and a negligible amount of microbubbles is incorporated. The optimal gradation ratio of filling slurry and non-flaky particles can significantly reduce the conveying resistance loss. Test results demonstrate that the addition of the modifier provides a 10% reduction in water consumption, a 10% reduction in pipeline resistance, and a 20% reduction in cementing agent usage while maintaining the same fluidity.
2.4. Test Plan
2.4.1. Test Plan For Flow Characteristics of Filling Slurry
In this test, the evaluation of cohesion and water retention in the slurry is based on the results of the slump test and intuitive experience. The performance of the filling body is influenced by factors, such as the ash-to-sand ratio, fly ash content, type of modifier, and slurry concentration variation [32–35]. To streamline the testing process, variations in the ash-to-sand ratio and fly ash content were simplified to variations in cement content. In the experimental material ratio, each cubic meter of filling slurry consisted of 1500 kg of tailings, 100 kg of cement, and 200 kg of fly ash. The cement content varied as follows: 50, 100, 150, and 200 kg. The modifier was classified based on whether CSKY01 was added or not. The slurry concentrations of 76%, 78%, 80%, 82%, 84%, and 86% were designed to reflect differences in slurry concentration. The mass concentration of filling slurry was tested across 48 groups. Table 5 provides the test plan for the slump of coarse-grained tailings filling slurry at each concentration level.
| Number | Coarse-grained tailings/(kg) | Cement /(kg) | Flotation tailings/(kg) | Fly ash/(kg) | Modifier/(kg) |
|---|---|---|---|---|---|
| T1 | 1500.00 | 50.00 | 100.00 | 200.00 | 0.00 |
| T2 | 3.00 | ||||
| T3 | 100.00 | 0.00 | |||
| T4 | 3.00 | ||||
| T5 | 150.00 | 0.00 | |||
| T6 | 3.00 | ||||
| T7 | 200.00 | 0.00 | |||
| T8 | 3.00 |
2.4.2. Test Plan for Conveying Resistance Characteristics of Filling Slurry
The phosphate mine in Hubei, China, adopts pumping filling technology, which requires high-quality filling slurry properties. For an extended period, no layering or segregation of filling slurry is allowed in the pipeline. A multi-loop, full-size, large-scale loop pipe test system was used to test pipeline resistance loss and rheological parameters under different pipe diameters and working conditions to ensure this. The test plan and objectives are as follows: (a) with a pipe diameter of 150 mm and a flow rate of approximately 1.58 m/s, the unit pipeline pressure loss and pumping pressure of the pressurizing pump were tested under various filling slurry ratios, (b) the pumping pressure loss and maximum permissible pump stop duration were tested after different pump stop times. After continuous pumping for 2 h, the unit pipeline pressure loss was measured for non-cementitious slurry. Subsequently, the starting pressure and unit pipeline pressure loss were measured after stopping the pump for 0.5 , 2, 6, and 24 h. For cementitious slurry, the starting pressure and unit pipeline pressure loss were measured after stopping the pump for 2 h., (c) the change in slump was tested under pumping conditions and different pump stop times. Table 6 presents the proportioning scheme of the filling slurry used for the loop pipe test. The modifier used in the experiment was CSKY01.
| Test plan | Cement/(kg) | Fly ash /(kg) | Fine-grained tailings/(kg) | Flotation tailings/(kg) | Modifier /(kg) | Slump/(cm) |
|---|---|---|---|---|---|---|
| I | 150.00 | 200.00 | 1500.00 | 100.00 | 3.00 | 26.00 |
| Ⅱ | 0.00 | 200.00 | 1500.00 | 100.00 | 0.00 | 22.00 |
| Ⅲ | 0.00 | 200.00 | 1500.00 | 100.00 | 3.00 | 26.00 |
2.4.3. Test Equipment and Process
(a) The slump cylinder used in the slump test has the following dimensions: a bottom diameter of 200 mm, a top diameter of 100 mm, and a height of 300 mm. The test was conducted using the concrete slump test method.
(b) Test equipment and process for filling slurry conveying resistance characteristics. The multi-loop full-scale loop pipe test system mainly includes four subsystems: slurry preparation, simulated conveying, measurement, a water supply and drainage. The system layout is illustrated in Figure 4. The function of the slurry preparation system is to prepare the slurry according to the experimental design requirements. The system includes a φ2600 mm × 2000 mm mixing tank, a feeding platform, a feeding hopper elevator, a feeding cart, and several electronic scales with different ranges. Simulated conveying system: The conveying flow and pressure are controlled by a concrete pump, simulating the production conditions of the downhole filling pipeline to measure comprehensive pipeline conveying parameters. The system equipment includes an HBT100C-2118DⅢ concrete pump, a total length of 200 m of ordinary seamless steel with diameters of φ100, φ150, φ200, φ240, and φ300 mm, including right-angle bends with different radii. The maximum outlet pressure is 18 MPa, and the flow rate is 100 m3/h. The measurement system monitors slurry preparation, conveying capacity, and pipeline pressure and detects the status and related parameters of the slurry at each working point at each time point. The water supply and drainage system consists of water supply pipes and valves, drainage pipes and valves, and waste slurry tanks. It provides clean water for the loop pipe test, which is essential for preparing slurry, conducting tests, and cleaning up waste slurry water after test completion.

This test prepares slurries with different mixing ratios. Cemented and non-cemented slurries are transported separately according to process conveying requirements. According to the requirements of pipeline capacity and slurry density, the batching volume is 3–4 tons each time, with approximately 2.5–3.5 tons circulating in the pipeline and 0.5 tons in the pump hopper. The test procedures are as follows: (a) perform a clean water test to ensure system functionality; (b) clean the pipeline with a sponge ball and water before loading, and check for any debris in the mixing tank and hopper of the concrete pump; (c) add 400–500 kg of cement to create cement slurry with a water-cement ratio of 0.8 to lubricate the pipeline; (d) pour a specified amount of water into the mixing tank, then add the weighed dry material into the mixing tank and allow it to soak for 10 min. Stir the mixture for 20–30 min, ensuring it reaches the specified concentration before discharging; (e) adjust the flow rate by altering the piston stroke cycle, which usually ranges from 3 to 16 s. Calibrate the pump piston stroke cycle before the test; (f) after preparing the slurry, open the discharge valve. When the slurry reaches 2/3 of the pump hopper, start the pump. Allow the slurry to flow in the pipeline for 10–20 min until the concentration stabilizes before beginning data collection; (g) under different pipe diameters, alter five flow conditions for each test, and read the data 3–5 times for each condition; (h) collect and process the data through computer software; and (i) after completing the tests, thoroughly clean the test system.
3. Test Results and Analysis
3.1. Experimental Results and Analysis of Flow Characteristics of Coarse-Grained Tailings Filling Slurry
The curve of slump test results of coarse-grained tailings filling slurry is shown in Figure 5. The experimental results show that when the concentration of coarse aggregate solid waste filling slurry is constant, the slump of the slurry increases with cement content. Additionally, the inclusion of modifiers further enhances the slump, demonstrating that both cement and modifiers improve the workability of the slurry.
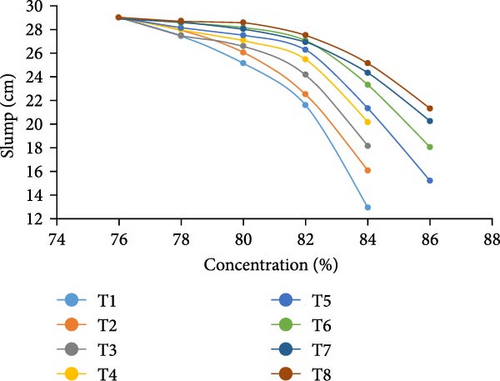
Based on slurry-filling experience, a slump of 25–28 cm suggests that the slurry possesses good fluidity. Analysis confirms that when the slurry concentration is between 78% and 82%, the fluidity is desirable. Observations further determine that at an 82% concentration, the slurry exhibits good water retention and cohesion. Furthermore, the separation time of slurry with an 82% concentration was tested, and the test results are illustrated in Figure 6.
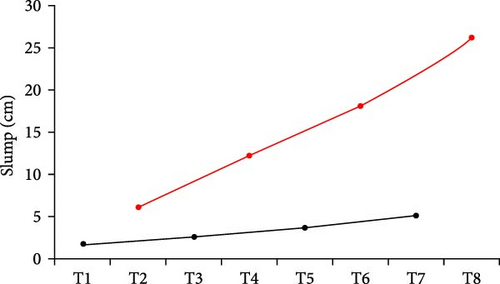
The conveying distance of coarse-grained tailings filling slurry is approximately 8 km, necessitating over 5 h of transportation. It can be observed that T2, T4, T6, and T8 can meet the requirement for a stratification time of greater than 5 h. Additionally, modifier CSKY01 must be added to the filling slurry to meet this requirement.
3.2. Test Results and Analysis of Coarse-Grained Tailings Filling Slurry Resistance Characteristics of Single-Diameter Loop Pipe
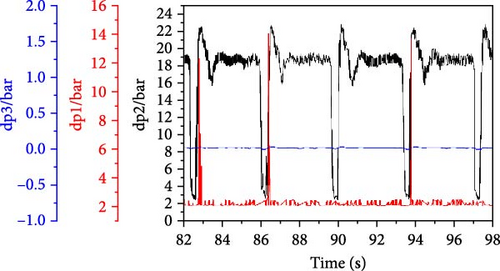
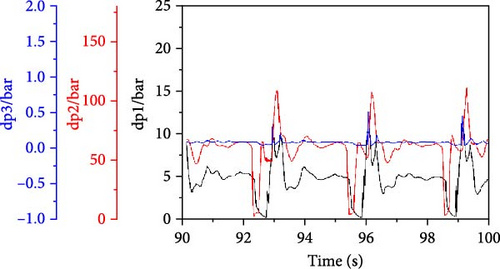
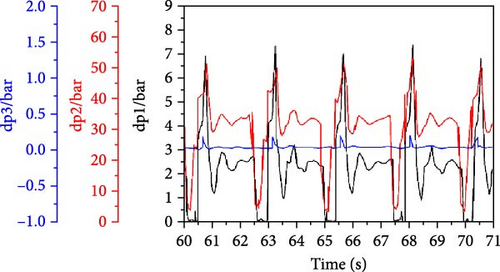
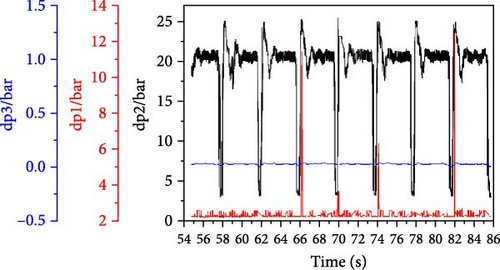
The single-diameter loop pipe test has an inner diameter of 100 mm and a slurry flow rate of 1.58 m/s. Its primary focus is assessing the pressure loss of straight pipes, inlet and outlet pressure loss, and elbow pressure losses. The measuring device is a multisystem 5060 hydraulic multimeter, with dp1 representing straight pipe pressure loss, dp2 denoting inlet and outlet pressure losses, and dp3 signifying elbow pressure loss. A differential pressure method is adopted for measurement.
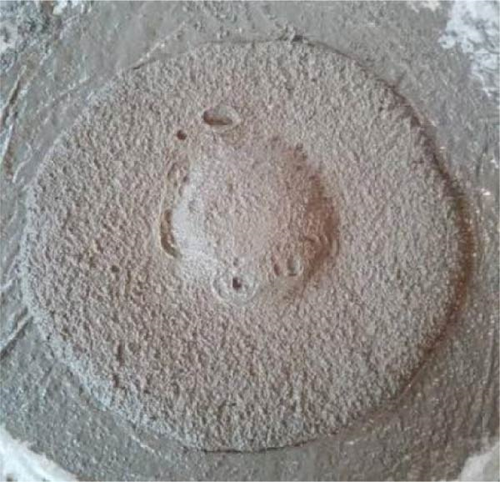
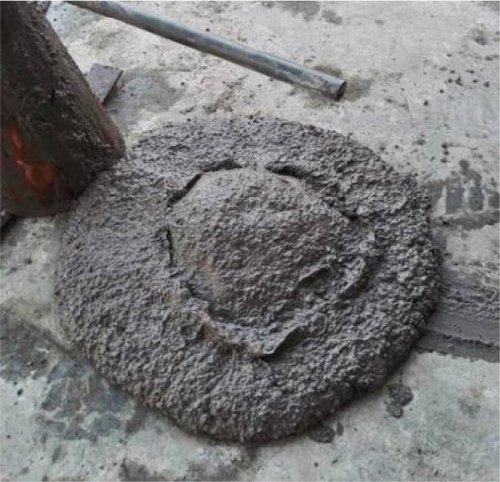
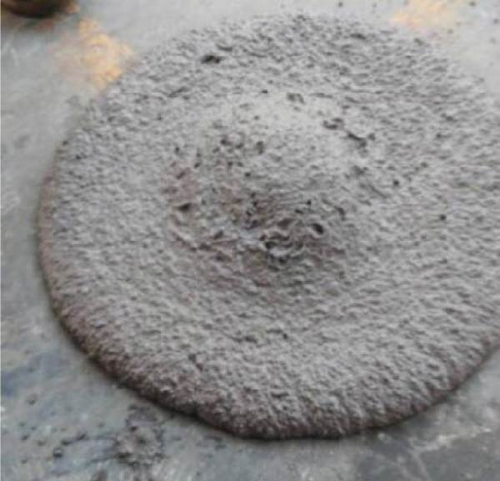
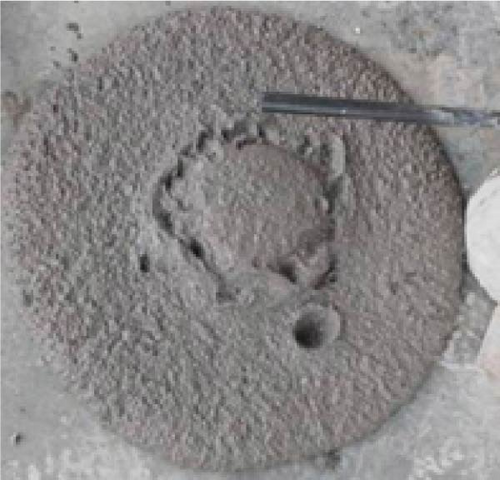
Test plan I involve a cemented filling slurry test containing modifiers, while test plan II consists of a non-cemented filling slurry test without modifiers. Test plan III examines a non-cemented filling slurry with modifiers. Tables 7–9 and Figure 7 present filling slurry ratios, flow characteristics, resistance parameters, and filling body strength data.
| Plan | Cement/(kg) | Fly ash/ (kg) |
Aggregate/ (kg) |
Flotation tailings/ (kg) |
Pumping agent /(kg) | Slump/(cm) | |
|---|---|---|---|---|---|---|---|
| I | Design ratio | 150.00 | 200.00 | 1500.00 | 100.00 | 3.00 | 26.00 |
| Test ratio | 450.00 | 600.00 | 4500.00 | 300.00 | 9.00 | 27.00 | |
| Ⅱ | Design ratio | — | 200.00 | 1500.00 | 100.00 | — | 22.00 |
| Test ratio | — | 447.00 | 3183.00 | 250.00 | 2.20 | 23.30 | |
| Ⅲ | Design ratio | — | 200.00 | 1500.00 | 100.00 | 3.00 | 26.00 |
| Test ratio | — | 447.00 | 3183.00 | 250.00 | 6.50 | 26.00 | |
| Plan | Test time |
Slump/ (cm) |
Expansion/ (cm) |
Bleeding rate/ (%) |
Bulk density/ (t/m3) |
7-day intensity/ (MPa) |
28-day intensity/ (MPa) |
|---|---|---|---|---|---|---|---|
| Ⅰ | 11:13 | 27.00 | 68.00 | 0.23 | 2.311 | 1.21 | 3.23 |
| 14:30 | 25.70 | 64.00 | 0.14 | 2.319 | — | — | |
| Ⅱ | 10:14 | 23.30 | 38.00 | 0.56 | 2.235 | — | — |
| Ⅲ | Stop pumping for 39 h | 26.00 | 68.00 | 0.63 | 2.022 | — | — |
| 24.50 | 61.50 | — | — | — | — |
| Plan | Test time | Elbow pressure loss dp3/(bar) | Straight pipe pressure loss dp1/(bar) | Inlet and outlet pressure loss dp2/(bar) | Flow/ (m3/h) |
Flow rate/ (m/s) |
Pumping pressure/(MPa) |
|---|---|---|---|---|---|---|---|
| Ⅰ | 12:30 | 0.024 | 2.113 | 17.465 | 44.6 | 1.578 | 10.0 |
| 14:30 | 0.025 | 2.194 | 19.118 | 44.1 | 1.561 | 10.0~10.5 | |
| Ⅱ | 10:44 | 0.078 | 4.880 | 58.820 | 44.9 | 1.588 | 16.0~18.0 |
| Ⅲ | Jan. 17th 17:25 | 0.023 | 2.365 | 30.524 | 44.9 | 1.588 | 12.0–14.0 |
| 17:55 | 0.025 | 2.373 | 30.892 | 44.5 | 1.575 | 12.0–14.0 | |
| 19:25 | 0.025 | 2.460 | 32.337 | 44.5 | 1.575 | 14.0–14.5 | |
| Jan. 18th 11:14 | — | — | — | 44.5 | 1.575 | 14.0–16.0 | |
| 17:25 | 0.028 | 2.680 | 36.610 | 44.5 | 1.575 | 14.0–16.0 |
- 1.
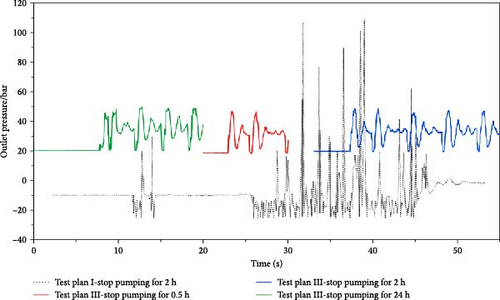
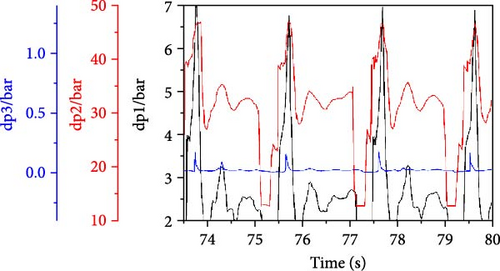
The results of test plan I, depicted in Figures 8–10, reveal the following: (a) following a 2-h pump stop, the slump decreases from 27 cm to 25.7 cm, indicating a slump loss of 1.3 cm, (b) at a displacement of 75% and a pumping frequency of 19 times/min, the peak restarting pressure of the pump reaches 10.89 MPa, which is excessively high. Therefore, it is recommended that the pump be restarted using a low displacement and flow rate approach, (c) at a flow rate of 1.578 m/s, the straight pipe experienced a pressure loss of 3059.42 Pa/m. After a 2-h pump stop, with a flow rate reduced to 1.561 m/s, the pressure loss increased to 3179.71 Pa/m.
- 2.
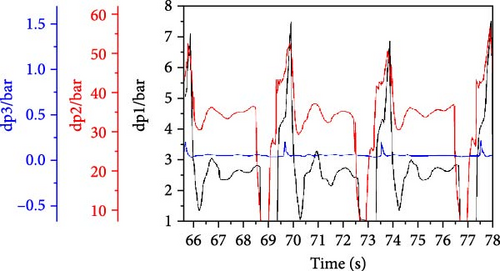
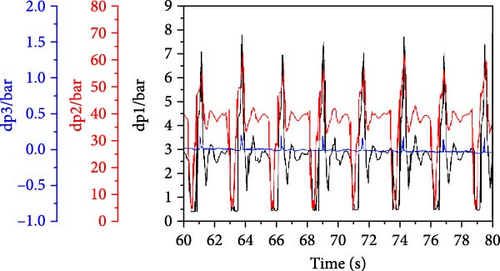
For test plan II, the pumping pressure is too high for long-distance slurry transportation. Therefore, water should be added to dilute the slurry to achieve a slump of 26 cm. Figures 9 and 10 depict time (min) on the abscissa and pressure (bar) on the ordinate, with dp representing the average pressure during the measurement period and p representing the instantaneous pressure.
- 3.
Test plan III demonstrates that after a 39-h pump stop, the slump of the filling slurry decreased from 27 to 24.5 cm, resulting in a slump loss of 2.5 cm. Minimal changes in pumping pressure were noted during pump stops lasting from 24 to 39 h. At a flow velocity of 1.575 m/s, the pressure loss of the straight pipe measured 3420.3 Pa/m. Following pump stops for 0.5, 2, and 24 h, the straight pipe pressure loss was 3439.1 Pa/m, 3565.2 Pa/m, and 3884.1 Pa/m, respectively. Normal pump operation could be resumed after a 39-h pump stop.
The above tests prove that (1) the primary factor influencing pipeline pressure loss is the mass concentration of the slurry. The second most significant factor is the pump stop time. The increase in pressure loss during a pump stop is mainly due to the cementation effects of fly ash and cement, (2) the peak pressure during pump restart is correlated with pumping frequency. In Test Plan I, at a 19 times/min pumping frequency, the peak restart pressure reaches an excessive 10.89 MPa. By starting the pump at a low displacement and flow rate, the peak restart pressure was significantly reduced. For long-distance slurry transportation, initiating pumping at a low frequency and gradually increasing it to normal operating levels is advisable to manage the pumping pressure effectively, (3) the slurry did not settle and segregate throughout the three-loop pipe tests. After a 24-h pump stop, the slurry’s bleeding rate was less than 1%, indicating it meets the slurry-filling material requirements. The addition of the filling modifier enhanced the slurry properties, thereby providing a solid technical foundation for effective pumping operations.
3.3. Test Results and Analysis of Coarse-Grained Tailings Filling Slurry Resistance Characteristics of Multi-Diameter Loop Pipes
The multi-diameter loop pipe tests were conducted with inner diameters of 100, 150, 200, 240, and 300 mm, corresponding to flow rates of 3.550, 1.578, 0.888, 0.616, and 0.394 m/s, respectively. The primary focus of these tests was to measure the pressure loss of 82% coarse aggregate cementitious filling slurry in straight pipes and to assess the pressure loss at bend radii of 5 D, 10 D, 15 D, and 30 D. The flow resistance of the slurry was calculated based on the length of both the straight pipe sections and the bends. The measured resistance loss per unit length of pipeline transportation for 82% cementitious slurry is detailed in Table 10.
| Running state | Elbow radius D/m | Flow resistance i /(kPa/m) | ||||
|---|---|---|---|---|---|---|
| D = 0.1m | D = 0.15m | D = 0.2m | D = 0.24m | D = 0.3m | ||
| v = 3.550 m/s | v = 1.578 m /s | v = 0.888 m/s | v = 0.616 m/s | v = 0.394 m/s | ||
| Steady-state operation 2.0 h | Straight pipe | 3.26 | 2.42 | 1.63 | 1.36 | 1.09 |
| 5 D | 73.57 | 50.63 | 35.03 | 30.28 | 23.14 | |
| 10 D | 22.14 | 17.40 | 11.62 | 9.93 | 7.74 | |
| 15 D | 13.43 | 8.59 | 5.94 | 4.98 | 3.97 | |
| 30 D | 3.91 | 2.93 | 1.96 | 1.64 | 1.30 | |
| Restart after stopping the pump for 2.0 h | Straight pipe | 3.42 | 2.57 | 1.71 | 1.43 | 1.14 |
| 5 D | 77.24 | 53.16 | 36.78 | 31.79 | 24.30 | |
| 10 D | 23.24 | 18.27 | 12.20 | 10.43 | 8.12 | |
| 15 D | 14.10 | 9.02 | 6.24 | 5.23 | 4.17 | |
| 30 D | 4.10 | 3.07 | 2.06 | 1.72 | 1.36 | |
Comparative analysis of single and multi-diameter coarse aggregate filling slurry loop pipe tests shows that the resistance loss along the pipeline is directly proportional to the speed of slurry transportation and inversely proportional to the cross-sectional area of the pipeline. The resistance loss increases as the elbow radius decreases. After stopping the pump for 0.5–2 h and then restarting, the flow resistance of the slurry increases by about 4%–6%. After stopping the pump for 24 h and restarting, the flow resistance of the slurry increases by about 13%. When the pipeline diameter is 0.15, 0.20, and 0.24 m, the steady-state operation of straight pipes and bends and the changes in conveying resistance after pump stoppages and restarts exhibit relatively gentle behavior.
4. Numerical Simulation Analysis of Filling Slurry Loop Pumping
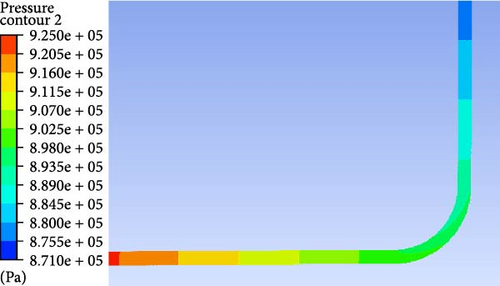
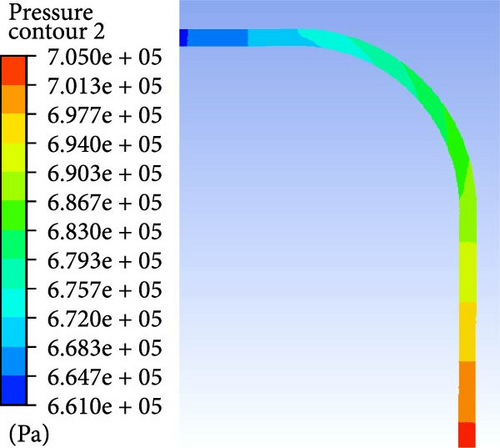
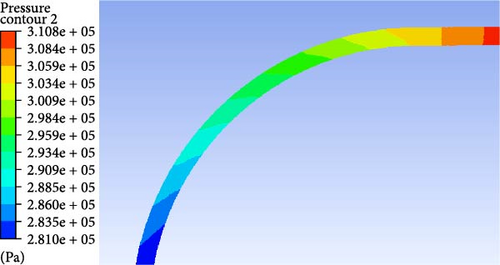
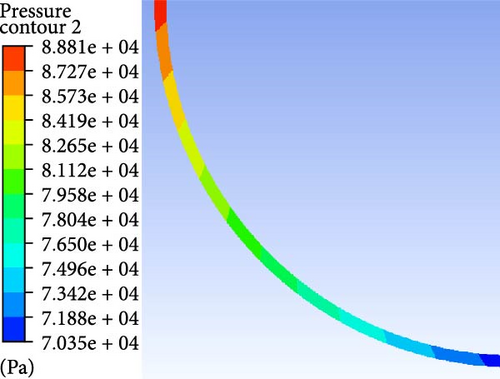
Based on a multi-diameter loop pipe experimental setup, a three-dimensional numerical model was constructed with straight pipe inner diameters (D) of 0.15 m, 0.20 m, and 0.24 m, and elbow radii of 5 D, 10 D, 15 D, and 30 D, respectively. The surface and volume grids of the pipeline were generated using Gambit software. The model was then imported into ANSYS FLUENT software, where the fluid pressure loss was calculated using the Euler method based on the measured rheological parameters. The conveying resistance loss characteristics in high-concentration slurry-filled circulating pipelines were investigated through numerical simulation analysis of circulating pumping. The flow rate is 0.888 m/s, and the diameter of the straight pipe is 0.20 m. Pressure loss cloud images for different elbow radii are shown in Figure 11. The flow resistance was calculated according to the straight pipe length of 50 m and elbow radius arc length (1/4 arc), as shown in Table 11.
| Running State | Elbow radius D (m) | Flow resistance i /(kPa/m) | ||
|---|---|---|---|---|
| D = 0.15 m | D = 0.2 m | D = 0.24 m | ||
| v = 1.578 m/s | v = 0.888 m/s | v = 0.616 m/s | ||
| Steady-state operation 2.0 h | Straight pipe | 2.42 | 1.64 | 1.22 |
| 5 D | 52.63 | 34.38 | 30.66 | |
| 10 D | 17.82 | 10.50 | 10.02 | |
| 15 D | 9.05 | 6.32 | 5.53 | |
| 30 D | 2.93 | 1.96 | 1.74 | |
The analysis of Figure 11 and Table 11 shows that the resistance loss along the pipeline is directly proportional to the velocity of slurry transportation and inversely proportional to the cross-sectional area of the pipeline, assuming consistent slurry conveying capacity. The resistance loss along straight pipes is much less than that along elbows, and smaller elbow radii result in greater resistance loss along the pipeline. Given that most energy loss occurs in the elbow sections, it is advisable to prioritize the use of large-diameter straight pipes or elbows to minimize resistance losses. Additionally, thickening the outer wall of the elbow diameter is recommended to mitigate the risk of pipeline explosion incidents.
5. Discussion on the Resistance of Filling Slurry Pipeline Transportation
5.1. Empirical Calculation and Measurement of Pipeline Transportation Resistance
Where: jm is the resistance along the pipe flow, Pa/m; Dis the inner diameter of the conveying pipe, meters; v is the average flow rate of paste slurry in the conveying pipe, m/s; τ0 is the initial shear stress, Pa; η is the plastic viscosity coefficient, Pa·s.
The RST-SST soft solid rheometer was used to measure the plastic viscosity coefficient and yield stress parameters of the slurry in straight pipe transportation. Considering the mine filling capacity of 100 m3/h, we calculated the resistance loss per unit length of pipeline transportation for 82% concentration of cementitious slurry under different pipe diameters. The results of these calculations are shown in Table 12.
| Running state | Tubular type | Rheological parameters | Flow resistance i /(kPa/m) | |||||
|---|---|---|---|---|---|---|---|---|
Plastic viscosity coefficient η/(Pa·s) |
Yield stress τ0/Pa |
D = 0.1m | D = 0.15m | D = 0.2m | D = 0.24m | D = 0.3m | ||
v = 3.550 m/s |
v = 1.578 m/s |
v = 0.888 m/s |
v = 0.616 m/s |
v = 0.394 m/s |
||||
| Steady-state operation 2.0 h | Straight pipe | 0.030 | 60.50 | 3.57 | 2.22 | 1.63 | 1.35 | 1.08 |
- Note: The average value of the ratio of the resistance difference to the arc length of the elbow.
Based on the experimental data provided in Table 9, a fitting curve of the resistance loss per unit length of pipeline transportation during steady-state operation with a concentration of 82% cementitious slurry is presented in Figure 12, accompanied by formulas (4) and (5).
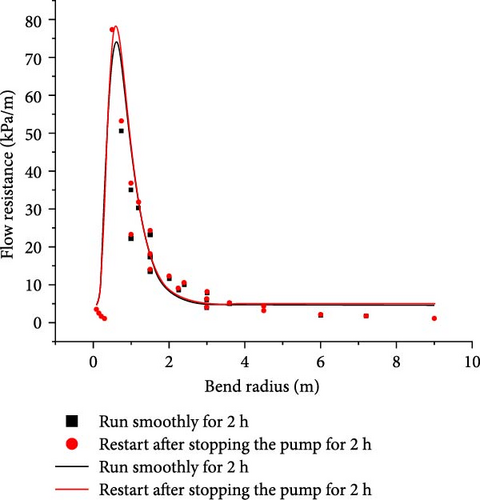
Where, jm is the resistance along the pipe flow after a 2.0-h pump stop, in Pa/m; D is the inner diameter of the conveying pipe, meters.
The analysis indicates that for the resistance of paste-filling slurry pipelines across different pipe diameters and flow rates, the calculated values derived from the Bingham model align closely with the measured values obtained from the loop pipe test. Specifically, the average relative deviation of the straight pipe is 0.04 under identical operating conditions, affirming the reliability of the measured values. Given, the challenges of testing the rheological parameters of slurry in elbows, obtaining Bingham’s experiential calculation values for this section is unfeasible.
Based on experimental measurements and numerical simulation analysis, the average relative deviation between the two methods is 0.04 under identical operating conditions. It is observed that the resistance loss along the pipeline is directly proportional to the speed of slurry transportation and inversely proportional to the cross-sectional area of the pipeline. Smaller elbow radii result in larger resistance losses. However, as the pipe diameter increases to 0.24 m, the resistance loss tends to stabilize. Additionally, under identical slurry parameters, the resistance of the pipeline is found to be 4.58%–6.20% higher than that of the steady-state pipeline after a 2.0-h pump shutdown.
5.2. Analysis of Reasonable Parameters of Pipeline Transportation
Based on the measured data from the loop test, the resistance loss per unit length of pipeline transportation of slurry with different pipe diameters was measured after 2 h of steady-state operation, as shown in Figure 13.
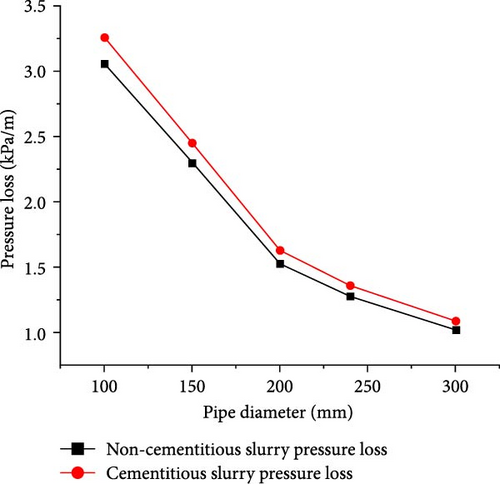
As can be seen from Figure 13, as the pipe diameter increases, the resistance loss per unit length of pipeline transportation decreases significantly, reaching a minimum within a certain range. When the inner diameter of the pipeline increased from 150 to 200 mm, the pipeline cost rose by approximately 78%, while the pipeline resistance decreased by 33%. The ratio of the reduction in pipeline resistance to the cost was calculated to be 0.42. Similarly, when the pipe inner diameter increased from 240 to 300 mm, the pipe cost increased by about 56%, while the pipe resistance decreased by only 20%. Here, the ratio of pipe resistance reduction to the cost was 0.36.
Based on the findings of the loop pipe test and considering pipeline cost and resistance reduction benefits, it is observed that the non-cementitious slurry transportation distance is approximately 4.5 km. Furthermore, when the inner diameter increases from 100 to 240 mm, the resistance loss per unit length of the pipeline is reduced by nearly 2/3, with a flow rate of approximately 0.6 m/s. The transportation distance of cementitious slurry is about 3.5 km. Similarly, an increase in inner diameter from 100 to 200 mm results in a 2/3 reduction in resistance loss per unit length of pipeline, with a flow rate of approximately 0.9 m/s.
Considering deceleration factors, such as bends and slope fluctuations, the longest conveying time from the slurry to the stope is around 5 h. This analysis suggests that the inner diameter of the economic pipeline for non-cementitious slurry transportation of certain phosphate rock is 240 mm, while for the transportation of cementitious slurry, the inner diameter of the economic pipeline is 200 mm.
6. Coarse-Grained Tailings Filling Slurry Transportation and Stope Filling Application
According to the filling material and test plan, coarse-grained tailings are used as aggregate, with a particle size crushed to -5 mm using an impact crusher. The filling material comprises 1500 kg of coarse-grained tailings, 100 kg of P·O 42.5 cement, 100 kg of fine-grained tailings, 200 kg of fly ash, and 3 kg of CSKY01 modifier. The mass concentration of the filling slurry is 82%. The slurry is transported through pipelines using a downward pumping method. The pumping pipelines for non-cementitious slurry and cementitious slurry have lengths of 4.5 km and 1.5–3.5 km, respectively, depending on the slope. When the pumping pressure falls below 10 MPa, long-distance slurry transportation may result in high resistance.
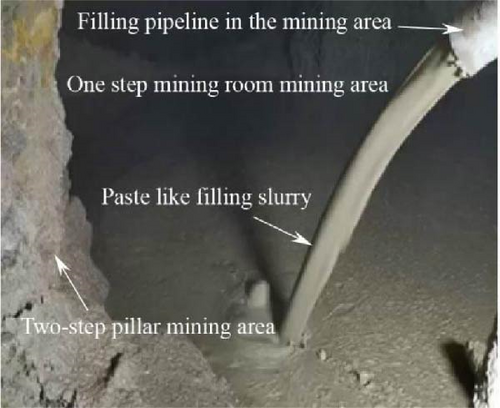
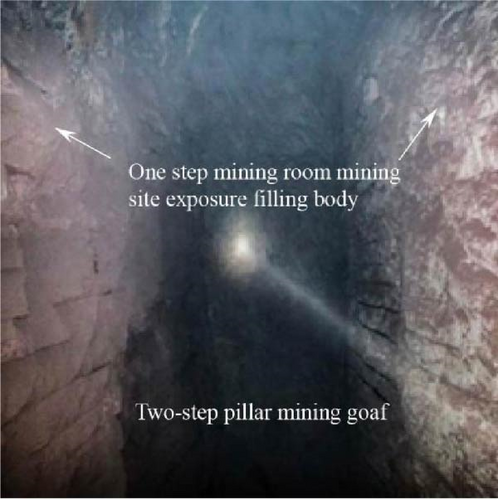
Based on the test results, we have developed technologies for the precise preparation of coarse-grained tailings containing modifiers and for pumping under long-distance and complex working conditions. These technologies primarily include drag reduction in large diameter and large radius elbow pipelines, the transportation of both cementitious and non-cementitious slurries, and downward pumping technology when the pipeline is filled. In this project, we constructed an all-solid waste slurry filling system designed for long-distance and complex working conditions. This system was put into operation in August 2017. It operates at a filling speed of 100 m3/h with a slurry concentration of 82%. The slurry is in paste form, and the filling system runs smoothly. Tests have shown that the stope filling body (R28) achieved a strength of 4.2 MPa, with a filling cost of RMB88.14/m3. The filling system has proven to be reliable, stable, and cost-effective, providing significant economic benefits. Additionally, it addresses the challenges of solid waste disposal and resource utilization within the mine. Figures 14 and 15 illustrate the slurry-filling process in the stope and the exposed stope filling body.
7. Conclusion
- 1.
The long-distance steady-state conveying technology of slurry was studied to address the technical challenges associated with the large particle size of coarse grained tailings, high conveying resistance, and the inability to achieve long-distance steady state filling over large areas. The filling modifier CSKY01 was found to enhance the fluidity, cohesion, and water retention properties of the slurry, thereby enabling stable long-distance transportation.
- 2.
The multi-loop full-scale tests demonstrate that the most critical factor for pipeline pressure loss is the mass concentration of the slurry, followed by the pump stop time. The increase in pressure loss was primarily due to the cementation of fly ash and cement, and the peak pressure of the pump restart was influenced by the pump frequency. For long-distance transportation, starting at a low frequency, combined with pumping pressure, is recommended, and then gradually increasing the starting frequency to a normal state. The experimental results and numerical simulation analysis indicate that the resistance loss is directly proportional to the velocity of slurry transportation and inversely proportional to the cross-sectional area of the pipeline. Additionally, the smaller the elbow radius, the greater the resistance loss. When the pipe diameter increases to 0.24 m, the resistance loss tends to stabilize.
- 3.
An all-solid waste paste filling system for long-distance and complex working conditions was constructed at the phosphorous mine in Hubei, China. The system operates at a filling speed of 80–100 m3/h, with a slurry concentration of 82%–84%. The slurry, in paste form, allows the filling system to run smoothly. The strength of the stope filling body (R28) reached 4.2 MPa. This system successfully facilitated the pumping and filling of coarse-grained tailings under long-distance and complex working conditions while maintaining economic efficiency.
- 4.
The filling area of the entire mining operation covered approximately 20 km2. The impact of ambient temperature on the slurry transportation pipeline resistance was not considered in this multi-circuit full-scale loop test system. Future studies could incorporate temperature adjustment devices, such as industrial air conditioners, to simulate the external ambient temperature conditions of mine filling. This would allow for an investigation into the effect of temperature on both cementitious and non-cementitious filling slurries.
Disclosure
The sponsors have not been involved in any aspect of the research.
Conflicts of Interest
The authors declare no conflicts of interest.
Funding
This study was jointly funded by the Innovative Approach Project of the Ministry of Science and Technology (Grant 2019IM050300), the Natural Science Foundation of Hunan Province (Grant 2021JJ30265), and the Hubei Provincial Natural Science Foundation of China (Grant 2022CFB860), and the Open Fund Project of Hunan Provincial Key Laboratory of Coal Mine Safety Mining Technology (Grant E21833).
Acknowledgments
The study is supported by the Innovative Approach Project of the Ministry of Science and Technology (Grant 2019IM050300), the Natural Science Foundation of Hunan Province (Grant 2021JJ30265), and the Hubei Provincial Natural Science Foundation of China (Grant 2022CFB860), and the Open Fund Project of Hunan Provincial Key Laboratory of Coal Mine Safety Mining Technology (Grant E21833).
Open Research
Data Availability Statement
Data available on request from the authors. The data that support the findings of this study are available from the corresponding author upon reasonable request.


