Network Resilience and Rehabilitation Strategies for an Airport Movement Area Considering Traffic Flow and Road Class
Abstract
In this study, we propose an improved betweenness centrality (FDBC) algorithm to identify vulnerabilities in airport field operations, assist controllers in formulating emergency response strategies, and enhance the safety resilience of the maneuvering area network during external disturbances. The algorithm is developed by constructing a transportation network model for the airport movement area and extracting key nodes based on considerations of traffic flow and road class. Utilizing aircraft field operation rules, we define an assessment index for the average shortest path length of inbound and outbound activities. Comparative analyses of comprehensive resilience indexes under various recovery strategies are conducted to assess the network’s recovery ability (RA) and adaptability in the face of external disturbances. The goal is to identify the optimal recovery strategy that achieves a dynamic balance between development and safety. To validate our approach, we conducted an empirical study at an airport in southwest China, simulating the resilience of the airport movement area transportation network under varying road class coefficients, traffic flow weights, and road class weights. The results indicate that the airport movement area transportation network in the southwest region lacks small-world and scale-free network characteristics. The identification of important road intersections through the FDBC strategy proves to be more effective in discerning potential safety hazard orientations. Under the FDBC-based recovery strategy, as traffic flow weights increase, the comprehensive resilience index of the network initially shows a smooth trend, followed by a decrease, then another period of smoothness before decreasing again. Increasing the road class coefficient can enhance the network’s recovery efficiency and resilience level, enabling the network to maintain a high level of recovery for an extended period. This is beneficial for enhancing the safety and stability of flight operations. However, in cases where traffic flow weights are high, the FDBC-based recovery strategy, which solely considers traffic, exhibits a relatively slower network RA in response to degree-valued perturbations. Overall, the traffic network in the airport movement area demonstrates the highest resilience under the FDBC-based recovery strategy. It can rapidly transition the network from a failure state to a normal stable state, thereby improving emergency response efficiency and ensuring the safe operation of the traffic network in the airport movement area.
1. Introduction
Resilience refers to the ability of a system to resist and absorb external perturbations and the ability to recover quickly to an acceptable level after the perturbation through appropriate repair measures [1]. The development of high-quality transportation systems is a significant trend in China’s transportation sector. The enhancement of transportation system resilience has also gained prominence, especially with the introduction of the National Indicator Framework for Comprehensive Three-dimensional Transportation Networks. The road network resilience within the airport movement area is crucial. It directly influences the operational efficiency and reliability of the taxiing system, playing a pivotal role in the construction of a new-generation civil aviation transportation system. In 2023, when an EVA Air airliner was undergoing a tow at Songshan Airport, it scraped with another aircraft, forcing aircraft through this path section to be detoured [2]. In the same year, a more extensive aircraft collision at Newark Liberty International Airport in the United States had a significant and prolonged impact [3]. Faced with such sudden events, the temporary closure of taxiway intersections may result in traffic congestion and other complications. An in-depth study of the propagation mechanisms and the influence range of traffic network failures and restoration in the airport movement area can help identify potential risks and safety hazards. Formulating corresponding measures based on these insights can provide valuable references for optimizing the design of the airport taxiing system and emergency response. Moreover, such studies can contribute to the development of a more realistic and flexible safety mindset among controllers involved in the ground operation of aircraft. This mindset, beyond merely aiming to defend and evade risks, emphasizes the importance of restoration and adaptation in response to risks. Ultimately, this approach enhances the sustainability and stability of safety in field operations.
In recent years, there has been a growing focus on the self-repairing and external repair capabilities of complex networks, commonly known as network resilience. The concept of resilience, initially introduced by Holling [4] in 1973 within the context of ecosystem research, has evolved. It has found applications in various fields, particularly in decision-making solutions for prevention and repair. Resilience development has expanded from socioeconomic realms to the transportation sector. This expansion provides theoretical support for detecting abnormal conditions and ensuring the timely restoration of transportation networks [5, 6]. Various authors have employed different methods to measure resilience assessment indexes, such as the average efficiency of the network, the maximum connectivity graph, and the average shortest path. They simulate changes in network resilience under different restoration schemes, subsequently determining the optimal alternative for network recovery. Notably, in 2015, Janic [7] amalgamated the characteristics of civil aviation with operational modes, developing a resilience algorithm for air transportation networks. This algorithm was instrumental in predicting network changes in response to unexpected events. In 2020, Zhang et al. [8] focused on maximizing subway network resilience. They evaluated performance based on average network efficiency and assessed resilience through different restoration methods. In 2021, Huang et al. [9] endeavored to maximize network restoration goals by employing the average network efficiency as the resilience evaluation index. They utilized genetic algorithms to calculate the restoration model of subway networks and obtain the optimal repair strategy. Additionally, Zhao [10] developed a road network restoration model considering time and cost constraints. They utilized the same genetic algorithm to find the optimal restoration scheme. Addressing the resilience challenges of road network, Sohouenou and Neves [11] introduced various restoration strategies, including optimal, average, flow-based, and criticality-based approaches, and conducted a comparative evaluation of these strategies. Yang et al. [12] provided a comprehensive overview of the current research status, research hotspots, and future development trends in the field of transportation resilience in 2022. In the same year, Liu et al. [13] intervened at different resilience recovery stages. They identified optimal restoration schemes for urban bus network resilience through a cascading failure study, which involves restoring while absorbing failures. Ma et al. [14] incorporated passenger flow loss rate and service efficiency loss rate into the network performance response function. They utilized the Delphi-entropy weighting method to obtain weights for analyzing the resilience of rail transit networks. Ren [15], in considering the impact of road segment length and road class on network efficiency in road networks, established a road network model with time weights. This model was used to monitor the resilience level of the network in the face of both random and deliberate attacks. For the study of airport networks before and after the epidemic, Guo et al. [16] employed node strength weighting to identify inflection points of metric loss under different attack methods. Their findings led to suggestions for strengthening the resilience of airport networks. Caliendo, Russo, and Genovese [17] conducted a comparative analysis of various segments within the road network. They examined the delays and assessed the extent of functionality loss under different scenarios, such as partial or complete tunnel closures. Ultimately, by comparing the functional recovery curves during the rehabilitation process, they determined the recovery speed and resilience index for each scenario.
Aircraft are particularly prone to safety issues during airport field activities, especially during peak periods of heavy traffic. This heightened risk is exacerbated by the potential for congestion at intersections, a consequence of the airport’s limited capacity [18, 19, 20]. The operational risks stem from various factors, such as the layout of the airport field and the intricate traffic patterns. These elements contribute to challenges in identifying potentially conflicting intersections [21]. Currently, many scholars primarily analyze key points based on network topological features, overlooking the practical influences on nodes within the actual network. The conventional betweenness centrality (BC) algorithm assumes a simplistic node interconnection within the network. However, in real flight ground operations, different aprons often lack direct connections, necessitating a re-evaluation of node connections within the airport movement area transportation network. Within the airport movement area, diverse taxiways cater to various aircraft types, and controllers select paths based on the airport’s layout, directly impacting traffic flow at taxiway intersections. Hence, we propose a FDBC metric integrating actual aircraft traffic and taxiway classes to identify critical nodes under dynamic operations accurately. In assessing the resilience of complex networks, conventional metrics like network efficiency, the proportion of nodes in maximum connected subgraphs, and clustering coefficients are commonly used. However, there are some limitations of the existing methods in the study of inbound and outbound flights: the main focus of the efficiency of aircraft ground operation is the efficiency of inbound and outbound traffic, especially how to plan the shortest path to complete the ground taxiing task. Therefore, this paper introduces a resilience assessment index considering aircraft inbound and outbound, leveraging the shortest path length and aircraft movement regulations.
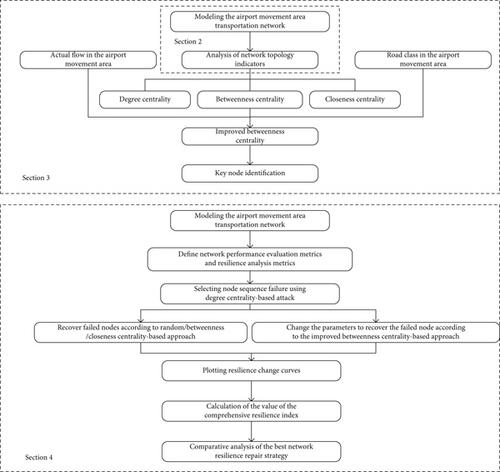
The subsequent part of this paper is divided into the following sections: Section 2 introduces the modeling methodology and related properties of the airport movement area transportation network; Section 3 focuses on the methodology for the node importance assessment; the next, Section 4, analyzes the resilience of the network and propose new research methodologies and metrics; Section 5 shows the results of the empirical analyses; and, finally, in Section 6, conclusions will be drawn and future research directions will be envisioned. In order to better understand the structure and methodology of the article, a flowchart was drawn, as shown in Figure 1.
2. Modeling and Characterization of Airport Movement Area Transportation Network
2.1. Airport Movement Area Transportation Network
2.2. Network Characterization Parameters
The topological characterization parameters of a complex network, to a large extent, reflect the nature of the network model. This, in turn, mirrors the operational characteristics of the real network [22]. Degree (ki) represents the number of connected edges of node i, for the airport movement area transportation network, and is the number of adjacent intersections per intersection. The average degree () indicates the degree of connectivity between the nodes of a network. Network diameter is the maximum number of shortest path edges between any two nodes in the network [23]. The average shortest distance () indicates the average of the number of shortest path edges between any two nodes in the network. The scale-free property of a network is observed when a small number of nodes possess large degree values. A network exhibits small-world properties when it features a small average degree and a large clustering coefficient. When considering real networks, it is common to use whether the average distance of the network satisfies to determine whether the network has small-world properties [22].
3. Network Node Importance Assessment
Research on airport field operation safety encompasses both static and dynamic aspects. The static aspect involves safety research on aircraft field operation tail spray, while the dynamic aspect focuses on quantifying field operation conflicts. The latter, in particular, is a focal point in the field of field safety, aiming to determine potential risk areas through the study of aircraft operations in the airport movement area.
In complex airport systems with multiple runways and taxiways, the frequency of aircraft conflicts increases with heightened traffic flow. Notably, intersections within the airport movement area have become focal points for field operation conflicts. Mining important nodes in complex networks serves as a valuable tool for airport management to conduct risk assessment and management. This process involves assessing the vulnerability of runway and taxiway systems by analyzing the criticality of nodes. By identifying potential risks and safety hazards, airport management can implement appropriate measures for maintenance and enhance the overall safety and efficiency of field operations. Previous research on traffic networks has been comprehensive, primarily focusing on traffic characteristics, static topological properties, and the degree of dynamic impact resulting from edge or node failure to establish the assessment system [24]. Traffic characteristics encompass parameters like the congestion index [25], traffic flow [26, 27], road class [27], saturation [28, 29], and more. Static topological attributes are associated with fundamental topological indicators of the network, including degree centrality (DC) [30–32], BC [33–35], and closeness centrality (CC) [36, 37]. The degree of dynamic impact mainly involves indicators such as the proportion of the average distance increase in the network under failure [38] and the number of failed nodes [39].
3.1. Node Importance Assessment Metrics
- •
DC: the simplest indicator of the centrality of nodes in a network. A higher value of DC signifies better connectivity, implying enhanced intersection capacity. This metric is denoted as DC:
- •
BC: an evaluation index of a node’s importance in the network, taking into account the involvement of the shortest paths. A higher value of BC indicates that the node is traversed by more shortest paths. During ground operation command, controllers are typically aimed at guiding aircraft through as few taxiway intersections as possible. Hence, in the airport movement area, a larger value of BC signifies a more pivotal point. This metric is denoted as BC:
- •
CC: an indicator that assesses the geometric position of nodes in the network. This metric is denoted as CC:
3.2. FDBC Based on Traffic Flow and Road Class
Due to the flaws and shortcomings of the classical BC algorithm, a new and improved BC index is defined for the following reasons.
Firstly, addressing the connectivity problem between specific nodes is crucial. Traditional BC is constituted by the ratio of the number of paths passing through a particular node in the shortest path between any two points in the network to the total number of shortest paths. However, in a real airport movement area transportation network, nodes in different parking aprons may not practically interconnect. This is unlike the widely recognized network assumption where each node is interconnected in a simple sense.
Secondly, the new index considers the influence of road class on the judgment of critical taxiway intersections [15]. In actual operations, each taxiway in the airport movement area is designated for different types of aircraft. Controllers typically guide wide-bodied heavy aircraft along fixed paths to avoid fuselage scraping accidents caused by long wingspans. In contrast, narrow-bodied light aircraft can traverse both ordinary road intersections and higher-grade taxiway intersections. The importance of higher-grade taxiway intersections is not adequately reflected in the centrality measure of the original BC. In accordance with the Civil Airport Flight Area Technical Standards and the Flight Area Indicator II recommended by the International Civil Aviation Organization (ICAO), which considers conditions such as wingspan and main landing gear outer wheel spacing, taxiways have been categorized as outlined in Table 1. This study simplifies the relationship between road class and node importance into a linear model, and the details of this linear relationship are presented in Table 2.
| Flight area indicators | Wingspan (m) |
|---|---|
| A | < 15 |
| B | 15–24 (not included) |
| C | 24–36 (not included) |
| D | 36–52 (not included) |
| E | 52–65 (not included) |
| F | 65–80 (not included) |
| Recommended road classes | B | C | D | E | F |
| Corresponding linear quantization values | 0 | 1 | 2 | 3 | 4 |
Thirdly, the influence of actual traffic distribution under a specific field layout on the judgment of critical taxiway intersections is considered [40, 41]. During operational command, controllers typically choose taxiway paths based on the layout of the airport movement area. Therefore, it is evident that the critical taxiway intersections are influenced by the operational mode of airport control. Counting the actual flow rate of aircraft path intersections helps identify critical nodes under actual dynamic operations.
4. Resiliency Analysis of Airport Movement Area Transportation Network
Network resilience analysis plays a crucial role in enhancing the ability of the airport movement area transportation network to withstand attacks and failures. By examining the network’s capacity to recover and adapt when facing external perturbations, potential issues in the system can be identified. Subsequently, corresponding measures can be implemented to safeguard the safe operation of the airport runway structure. The outcomes of the entire assessment provide valuable insights for airports to continuously enhance their emergency response plans. Additionally, the assessment helps in identifying optimal network resilience recovery strategies. This ensures efficient crisis response and minimizes disruptions to ground operations in unexpected situations, ultimately safeguarding the safety of personnel and optimizing travel efficiency.
4.1. Network Resilience Research Methodology
- 1.
The network perturbation mode adopted is intentional, mainly simulating congestion occurring at the intersections of key taxiway sections. Given that the DC network failure strategy boasts lower computational complexity, this paper selects the DC-based network failure strategy as the experimental model. It designates the taxiway intersection with a higher degree value as a priority for congestion simulation, simultaneously closing the connected glide path;
- 2.
Following the conclusion of network disturbance, there is an immediate need to restore the operation of key congested intersections until the airport movement area returns to normal operation. During the restoration process, selected strategies include BC-based restoration (BC-based recovery), FDBC-based restoration (FDBC-based recovery), CC-based restoration (CC-based recovery), and random restoration. This involves restoring taxiway intersections with high BC values, FDBC values, CC values, and randomly selected values, along with restoring the associated edges simultaneously;
- 3.
When the network faces disturbance, one node fails per unit of time until a total of 20 nodes fail. Immediately after the disturbance, the system adopts the aforementioned recovery strategy, recovering one node per unit of time until all nodes are restored;
- 4.
A control variable approach is employed to examine the impact of the road class coefficient and traffic flow weight on the performance of the transportation network.
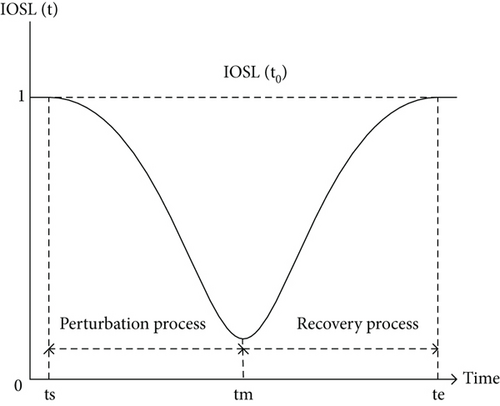
4.2. Network Resilience Assessment Metrics
- •
The average shortest path length of inbound and outbound
- •
Loss rate: a metric that measures how quickly the network loses performance when disturbed. It is represented as the average downward slope of the performance curve, denoted as RAPIDP. The expression for the loss rate is given by
- •
Performance loss per unit time: a metric indicating the degree of time-averaged loss in network performance, denoted as TAPL. The expression for the performance loss per unit time is
- •
Recovery rate: a metric that measures how quickly performance is restored after the network has adopted a recovery strategy. It is represented as the average upward slope of the performance curve, denoted as RAPIRP. The expression for the recovery rate is
- •
RA: a resilience index used to measure the difference between the recovered performance level and the initial performance level after the network recovery is completed, denoted as RA. The expression about the RA is
5. Empirical Analysis
An airport in southwest China is used as an example to empirically study critical taxiway intersections and their resilience. The runway configuration is shown in Figure 3.
5.1. Construction and Characterization of Network Models
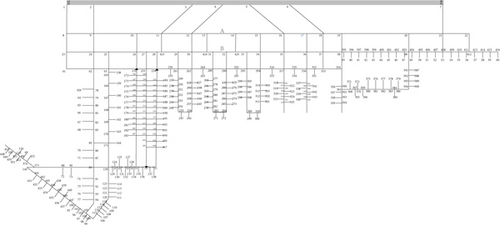
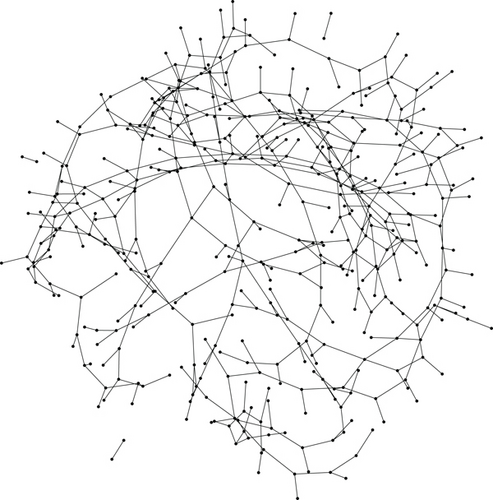
In the network model, the set V contains 453 elements, and the set E contains 514 elements, as shown in Figure 4.
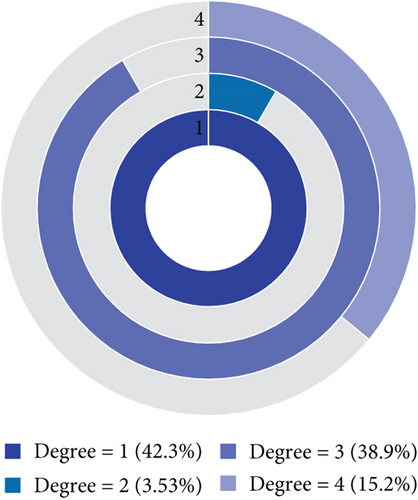
Upon analyzing the network, characteristic parameters were obtained and are presented in Table 3. The average degree of network G is 2.269, indicating that, on average, each taxiway intersection is connected to 2.269 adjacent intersections. The node degree distribution in the airport movement area is depicted in Figure 5, revealing that the maximum difference in node degree value is 3. Nodes with degrees 1 and 3 are widespread, with most of the nodes having a degree of 1 representing parking aprons in the airport movement area. This analysis suggests that the traffic network in the airport movement area lacks the characteristics of a scale-free network. The network diameter of the traffic network in the airport movement area is 45, indicating that the maximum number of intersections an aircraft must pass through between any two intersections is 45. The average shortest distance of network G is 17.851, signifying that, on average, an aircraft departing from any intersection needs to pass through 17.851 intersections to reach the destination intersection. It is calculated that , which differs by 58.2% from the average shortest distance, indicating that the airport movement area transportation network does not exhibit small-world characteristics.
| Parameter | Average degree | Network diameter | Average shortest distance |
|---|---|---|---|
| Airport movement area transportation network | 2.269 | 45 | 17.851 |
5.2. Network Node Importance Assessment
The ground taxiing paths of 453 inbound and outbound aircraft at an airport in southwest China on January 12, 2023, are counted, as shown in Table 4. The data were combined and analyzed to record the effective path sets of OD pairs in the entire network. This process captured the number of shortest paths and their actual flow rates passing through a specific node based on the complete set of effective OD paths in the road network. For instance, to determine the FDBC of intersection 34, relevant data are shown in Table 5. Each intersection node was categorized into road classes based on the aircraft wingspan limitation of each taxiway, as outlined in Table 6. Using the road class coefficient a = 0.5 and flow weight b = 0.5, the FDBC importance ranking was obtained based on traffic flow and road class, as displayed in Table 7. To highlight the positions of nodes in the airport movement area structure, some areas were enlarged, as depicted in Figure 6. The top ten nodes in terms of importance for each index, including DC, BC, CC, and FDBC, are listed in Table 8. From Table 8 corresponding to Figure 6, it is evident that nodes with top rankings in DC, BC, and CC are primarily intersections of the first parallel taxiway A. These intersections are where airport controllers conduct flight departure sequencing with lower conflict frequency. In contrast, nodes with top rankings in FDBC are mainly intersections of the second parallel taxiway B. These intersections serve as apron handover points in actual operations and experience higher conflict frequency. These nodes are crucial for apron handovers and are locations with more conflicts in actual operations. The method of important node mining based on FDBC provides a comprehensive understanding and control of airport field operation safety. It aids in optimizing the design of the airport runway structure, command and scheduling, and risk management. Ultimately, this contributes to enhancing the safety and efficiency of airport surface operations.
| Intersections for inbound aircraft | Intersections for outbound aircraft | |
|---|---|---|
| 1 | 5, 16, 35, 34, 33, 425, 32, 31, 424, 30, 29, 423, 28, 27, 26, 25, 24, 62, 78, 426 | |
| 2 | 5, 16, 35, 34, 33, 425, 32, 31, 424, 30, 29, 423, 28, 27, 26, 25, 24, 62, 78, 79, 64 | |
| 3 | 65, 80, 79, 78, 62, 24, 9, 8, 1 | |
| 4 | 66, 81, 80, 79, 78, 62, 24, 9, 8, 1 | |
| 5 | 5, 16, 35, 34, 33, 425, 32, 31, 424, 30, 29, 423, 28, 27, 26, 25, 24, 62, 78, 79, 80, 81, 82, 67 | |
| … | … | … |
| 453 | 5, 16, 17, 18, 19, 38, 395, 396, 397, 398, 399, 400, 401, 45 |
| Beginnings | Endpointt | Adjacency matrix valuemst | Number of shortest pathsnst | Actual inbound and outbound traffic for the day |
|---|---|---|---|---|
| 16 | 31 | 1 | 2 | 89 |
| 35 | 423 | 1 | 2 | 61 |
| 240 | 268 | 0 | 1 | 0 |
| 5 | 29 | 1 | 2 | 75 |
| … | … | … | … | … |
| Intersection node | Road class | Corresponding linear quantization value |
|---|---|---|
| 8 | F | 4 |
| 27 | F | 4 |
| 256 | D | 2 |
| 313 | F | 4 |
| 257 | D | 2 |
| Intersection node | FDBC | Intersection node | FDBC |
|---|---|---|---|
| 30 | 7.79383e − 05 | 424 | 7.29777e − 05 |
| 28 | 7.68746e − 05 | 34 | 7.21011e − 05 |
| 29 | 7.68573e − 05 | 32 | 7.19254e − 05 |
| 423 | 7.63822e − 05 | 27 | 7.19124e − 05 |
| 31 | 7.40937e − 05 | 26 | 6.48096e − 05 |

| Ranking | DC | BC | CC | FDBC |
|---|---|---|---|---|
| 1 | 9 | 14 | 12 | 30 |
| 2 | 11 | 13 | 11 | 28 |
| 3 | 12 | 15 | 13 | 29 |
| 4 | 16 | 12 | 10 | 423 |
| 5 | 18 | 11 | 232 | 31 |
| 6 | 21 | 16 | 14 | 424 |
| 7 | 24 | 63 | 26 | 34 |
| 8 | 26 | 10 | 234 | 32 |
| 9 | 30 | 139 | 423 | 27 |
| 10 | 34 | 165 | 30 | 26 |
5.3. Network Resilience Analysis
In this context, diverse recovery strategies are applied to enhance the resilience of the network against degree-valued attacks. A larger comprehensive resilience index signifies the superiority of the recovery strategy. These strategies are employed as comparative benchmarks, depicting distinct sequences for the recovery of compromised nodes. By assessing the recovery effectiveness through the comprehensive resilience metrics obtained under each strategy, we can discern their relative strengths and weaknesses. This process aids in identifying the most efficacious recovery strategy, thereby fortifying the network’s ability to withstand degree-valued attacks.
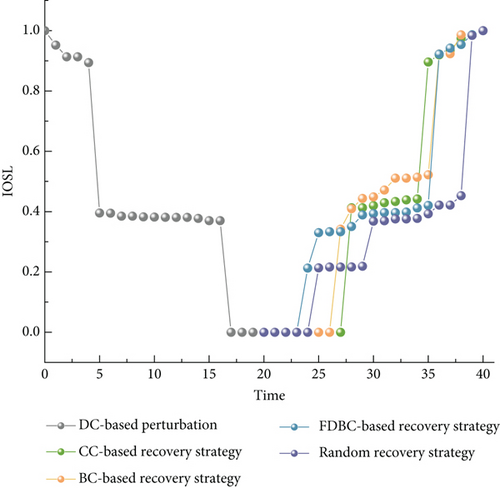
For the resilience analysis experiments, we used Python for data analysis and processing. It analyzes the variation curves of the average shortest path lengths of inbound and outbound in the airport movement area transportation network under different recovery strategies after facing a degree-based attack. The road class coefficient a is set to 0.5, and the traffic flow weight b is set to 0.5. Figure 7 illustrates these results, indicating that the random recovery strategy is less efficient in responding to crises in unexpected situations. The curve remains at the bottom for an extended period. The performance recovery based on the FDBC-based recovery strategy is most pronounced before the recovery at the 6th node. After this point, the BC-based recovery strategy starts to exhibit its effect. After t = 35, the changes in the performance curves become similar, suggesting that key nodes have been recovered, and the network operation capability is approximately restored to the initial state. The change curves serve as the basis for calculating the values of comprehensive resilience indexes based on BC-based, CC-based, and random recovery strategies, as outlined in Table 9. The BC-based recovery strategy is observed to be higher than the CC-based recovery strategy. This is attributed to the fact that intersections with higher BC serve as crucial bridge nodes within the entire airport movement area. Prioritizing the restoration of these nodes becomes advantageous as it significantly contributes to ensuring the overall connectivity of the network after damage. Furthermore, the concept of BC is intricately linked to the shortest paths rather than mere node connections. This characteristic enhances the resilience of nodes with higher BC to network failures and increases their likelihood of disseminating information to neighboring nodes. Consequently, this facilitates the re-establishment of relationships within the network more effectively.
| BC-based recovery | CC-based recovery | Random recovery | |
|---|---|---|---|
| GR | 1.797 | 1.775 | 1.662 |
5.3.1. Analysis of the Impact of Road Class Coefficient on Network Resilience
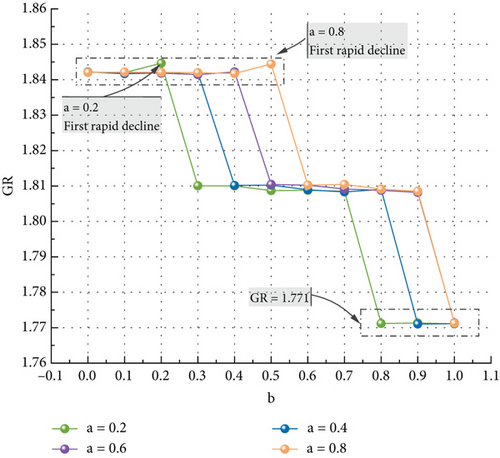
To assess the impact of changes in the road class coefficient on the performance recovery of the airport movement area transportation network under DC-based perturbation, the traffic flow weights b are set to be 0, 0.1, 0.2, 0.3, 0.4, 0.5, 0.6, 0.7, 0.8, 0.9, and 1, and the road class coefficients a are made to be 0.2, 0.4, 0.6, and 0.8. The results are depicted in Figure 8. The four types of FDBC exhibit similar trends, with comprehensive resilience index values initially showing a smooth increase, followed by a decline. When comparing these results with those of other recovery strategies in Table 9, it is evident that the random recovery strategy results in the smallest network resilience value (1.662). This indicates a prolonged time to return to safe operating conditions after external disturbances. The comprehensive resilience index values exhibit an early jitter drop at smaller traffic flow weight levels when the road class coefficient a is 0.2, and a later jitter drop at 0.8. Generally, with a fixed traffic flow weight b, a larger road class coefficient a corresponds to a higher comprehensive resilience index value. Increasing the road class coefficient delays the decline in network performance resilience, maintaining a high level of resilience for a more extended period and enhancing the safety and stability of flight operations. At higher flow weights, where the metric for assessing intersection importance predominantly considers traffic flow and overlooks road class, the values at different road class coefficients converge to 1.771. Both values are inferior to the BC-based recovery strategy and the CC-based recovery strategy. This indicates that the FDBC-based recovery strategy, which emphasizes traffic flow alone, has slower network resilience to DC-based perturbation. Overall, except for cases with large traffic flow weight, the FDBC-based recovery strategy demonstrates the highest resilience among recovery strategies. This facilitates the quick restoration of safe operation in the field and enhances network stability when taxiway intersections in the airport movement area experience external disturbances leading to a capacity decrease.
5.3.2. Analysis of the Impact of Traffic Flow Weight Coefficient on Network Resilience
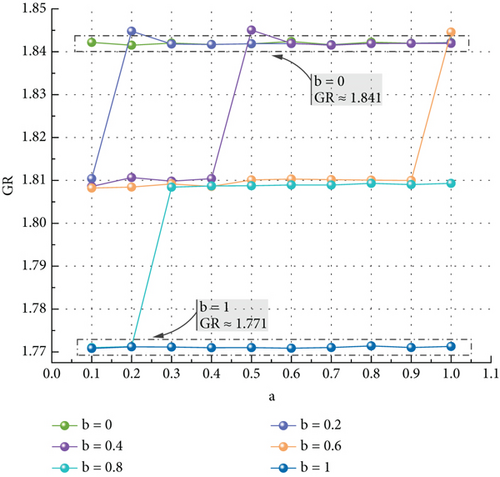
To study the influence of traffic flow weight on the network performance recovery level of the traffic network in the airport movement area under DC-based perturbation, the road class coefficients a are set to be 0, 0.1, 0.2, 0.3, 0.4, 0.5, 0.6, 0.7, 0.8, 0.9, and 1, and the traffic flow weights b are made to be 0, 0.2, 0.4, 0.6, 0.8, and 1. The road class weights are then set to 1, 0.8, 0.6, 0.4, 0.2, and 0, respectively. Calculate the comprehensive resilience index values under different road class coefficients. Figure 9 illustrates that altering the road class coefficients has minimal impact on enhancing field safety resilience when flow weights are 0 and 1 (road grade weights 1 and 0). Particularly, under the FDBC-based recovery strategy, which solely considers traffic flow, the network’s restoration consistently lags behind the BC-based and CC-based recovery strategies, maintaining a comprehensive resilience index value of 1.771. With a fixed road class coefficient, larger traffic weights correspond to lower comprehensive resilience index values. This indicates longer interruptions in the network’s normal performance and a weaker ability to maintain operational continuity. This suggests that prioritizing the recovery of nodes with higher road class is more beneficial in improving network recovery efficiency and reducing the impact on normal inbound and outbound aircraft operations after facing disturbances. Overall, except for cases with larger traffic flow weights, the FDBC-based recovery strategy demonstrates the highest resilience in the airport movement area transportation network. This enables the network to rapidly recover from a failure state to a stable and normal state, enhancing emergency response efficiency, increasing stability in emergencies, and ensuring safe operation. Comparing comprehensive resilience index values under other recovery strategies in Table 9, the airport movement area transportation network’s resilience under the random recovery strategy is consistently the lowest. This strategy requires more time to recover to the initial performance level after external disturbances.
5.4. Verification of Experimental Results
- 1.
Prioritize accommodating multiple aircraft traffic: Elevating the road class coefficient gives precedence to routes with higher capacity and adaptability. This prioritization facilitates smoother passage for both large and small aircraft, enhancing adaptability and flexibility within the airport movement area transportation network.
- 2.
Rapid congestion relief: When congestion occurs in the airport movement area transportation network, emphasizing the restoration of routes suitable for a wide range of aircraft proves more effective in alleviating congestion. This approach reduces taxi delays, enhances airport operational efficiency, and decreases aircraft ground waiting times.
- 3.
Minimize operational disruptions: By prioritizing the resumption of routes suitable for multiple aircraft, disruptions in airport operations can be minimized. This strategy ensures the seamless execution of aircraft schedules, minimizing economic and time losses for passengers, airports, and airlines.
In summary, the FDBC recovery method, considering road class and traffic flow, can effectively cater to diverse operational requirements, expedite congestion alleviation for aircraft ground operations, enhance network resilience, and minimize operational interruptions. This approach offers a more efficient and adaptable solution for the smooth operation of transportation networks in the airport movement area.
6. Conclusions and Outlook
- 1.
This airport movement area is not characterized by small-world networks or scale-free networks;
- 2.
When the traffic flow weight and road class weight are 0.5, the important nodes identified by DC, BC, and CC are concentrated in the first parallel taxiway. On the other hand, the nodes ranked higher in the FDBC are located in the intersection of the second parallel taxiway. This intersection has a higher probability of node conflict occurrence and better meets the actual operation situation, making it the key node of the airport movement area transportation network. Given that the FDBC algorithm in this paper incorporates data on both traffic flow and road class, it is equally suitable for other transportation networks. This capability facilitates more effective guidance for the rational allocation of resources and the optimal design of the network. In operational command, controllers can strengthen monitoring and key traffic deployment on these road intersections. This helps improve the risk resistance of the traffic network in the airport movement area;
- 3.
Identifying the optimal network resilience recovery strategy is not only a means to cope with external disturbances but also an important guarantee for the safety of airport operations. When facing external disturbances, the network resilience under the random recovery strategy is the smallest, and it takes a longer time to recover to the safe operation state. With the same traffic flow weight, the larger the road class coefficient is, the higher the value of the comprehensive resilience index is, the better the network security level is, and the better the stability of flight operation is. For the same road class coefficient, the larger the traffic flow weight, the lower the value of the comprehensive resilience index, and the worse the security stability of flight operation. In general, in the face of security threats such as degree-value attacks, the priority of restoring the intersection with the largest FDBC value is the best recovery measure after improvement and optimization. This can enhance the security resilience of ground flight operations to a certain extent, which is conducive to the establishment of more sound emergency response security measures.
The article studies the network resilience based on the static perturbation mode of the airport movement area transportation network and does not consider the effect of cascade failure due to flight traffic load redistribution when the intersection fails. Subsequently, the change process of network performance can be studied from the perspective of dynamic perturbation, to provide a more scientific program for airport ground operation command. In terms of node importance identification, the BC algorithm can be optimized further. This optimization could involve considering more realistic features and introducing a dynamic adjustment mechanism, so that the model can dynamically identify and adjust key nodes according to real-time traffic data, thus maintaining the effectiveness and adaptability of the model. Additionally, the average shortest path length of inbound and outbound indicators has the potential to be expanded to other transportation networks. Although the current methodology is designed for aircraft ground operations, the shortest path length and approach/departure rule-based assessment idea is also applicable to other types of transportation networks. By applying this metric to other transportation networks, the operational efficiency and resilience of different types of transportation networks can be more comprehensively assessed.
Conflicts of Interest
The authors declare no conflicts of interest.
Funding
This research was funded by the Sichuan Science and Technology Program (2022YFG0196), the Fundamental Research Funds for the Central Universities (ZHMH2022-002), and the innovation and entrepreneurship program for students of Civil Aviation Flight University of China (S202310624089).
Open Research
Data Availability Statement
The datasets used and/or analyzed during the current study are available from the author upon reasonable request.


