Enhancing Malaria Control Strategy: Optimal Control and Cost-Effectiveness Analysis on the Impact of Vector Bias on the Efficacy of Mosquito Repellent and Hospitalization
Abstract
This paper focuses on the impact of mosquito biting bias on the success of malaria intervention strategies. The initial model is developed considering the existence of symptomatic and asymptomatic humans, as well as vector bias. The model is then analyzed to demonstrate how the malaria-endemic equilibrium always exists and is globally asymptotically stable if the basic reproduction number is larger than one. On the other hand, malaria will always go extinct in the population if the basic reproduction number is less than one. For intervention analysis, the model is extended by considering mosquito repellent and hospitalization as control strategies. The control reproduction number is shown analytically. Using the Pontryagin maximum principle, we characterize our optimal control problem. Several scenarios are conducted to observe the dynamics of control variables under different circumstances. We found that the intervention of mosquito repellent and hospitalization together is the most cost-effective strategy to reduce the spread of malaria. Furthermore, we have shown that the more biased the vector attracted to infected individuals, the higher the cost needed to implement the control strategy.
1. Introduction
The world harbors a wide array of infectious diseases, spanning those transmitted through direct human contact to those necessitating an intermediary animal or transmission through the environment. Diseases requiring an intermediary animal for transmission are also referred to as vector-borne diseases. Examples of such diseases encompass dengue, malaria, and chikungunya, among others. Malaria stands out as one of the most prevalent vector-borne diseases annually, particularly in Africa and Asia [1]. It prevails in tropical and subtropical regions globally, including Africa, Asia, and Latin America. Sub-Saharan Africa bears the heaviest burden in terms of malaria cases and fatalities [2].
Malaria is a life-threatening illness caused by the Plasmodium parasite, transmitted to humans through the bites of infected female Anopheles mosquitoes [3]. Typical malaria symptoms include high fever, chills, headache, sweating, fatigue, body aches, and nausea. If left untreated, it can progress to severe complications and potentially prove fatal [4]. Diagnosis of malaria can be achieved through laboratory tests that detect the presence of the parasite in the blood [5]. Early diagnosis and prompt treatment are crucial in preventing severe illness and death.
Effective malaria prevention strategies include the use of insecticide-treated bed nets, indoor residual spraying to eliminate mosquitoes, and antimalarial drugs for preventive treatment in high-risk areas [6–11]. The most effective treatment for uncomplicated malaria is artemisinin-based combination therapies (ACTs) [12]. However, the emergence of drug-resistant strains of the malaria parasite poses a significant challenge to malaria control efforts [13].
Another popular intervention for mosquito-borne diseases is the use of mosquito repellent, designed to deter mosquitoes from biting humans or animals. It operates by creating a barrier or emitting odors that repel mosquitoes, thereby reducing the risk of mosquito-borne diseases and the discomfort of mosquito bites [14].
Global efforts to combat malaria have led to significant progress in reducing the disease burden. Increased funding, distribution of bed nets, improved access to diagnostic tests and treatment, and research on new prevention and treatment methods are crucial for further progress in malaria control and elimination.
Mathematical models have been employed by many researchers to comprehend how diseases may spread among populations, as demonstrated in references [15–18]. In the context of malaria transmission models, numerous approaches have been explored to assess how malaria spreads, considering factors such as vector bias [19, 20], repellent [21, 22], and treatment [23]. Some researchers also employ optimal control problems for malaria [24, 25] and cost-effectiveness methods to determine the best strategies for malaria prevention [26, 27]. Mojeeb and Li conducted a study on a mathematical malaria model, taking into account the effect of vector bias, and concluded that malaria could worsen if current control strategies are not improved [28]. Buonomo and Vargas-De-León introduced vector bias into their malaria transmission model and suggested that the greater attractiveness of infectious humans to mosquitoes plays a relevant role in malaria dynamics, especially when human immigration and death-induced mortality cannot be neglected [19]. Aldila and Seno [29] worked on a mathematical model of a general vector-borne disease with the presence of vector bias phenomena. The results obtained suggest that the control of disease becomes more challenging as the magnitude of vector bias increases. Overall, the discussed case ideas are intriguing, and the employed mathematical theories are deemed useful. However, it is noteworthy that the authors did not address optimal control models and cost-effectiveness, limiting the extent of conclusions that can be drawn for public health professionals. Unlike the work undertaken by Aldila and Angelina [30], their study involves the development of a malaria model incorporating vector bias along with optimal control simulations. However, it is essential to note that the proposed model has not yet discussed the asymptomatic cases in the malaria transmission process.
Based on the aforementioned information, it is evident that repellents and treatments play pivotal roles in mitigating the rapid transmission of malaria. Furthermore, there is a scarcity of mathematical models that consider the impact of vector bias on the efficacy of mosquito repellents and hospitalization in malaria control strategies. Consequently, we introduce a novel mathematical model to assess the influence of vector bias on the effectiveness of mosquito repellents and treatment in malaria eradication. We conduct optimal control problems utilizing repellents and treatments as controls and evaluate cost-effectiveness across various scenarios.
2. The Model Formulation
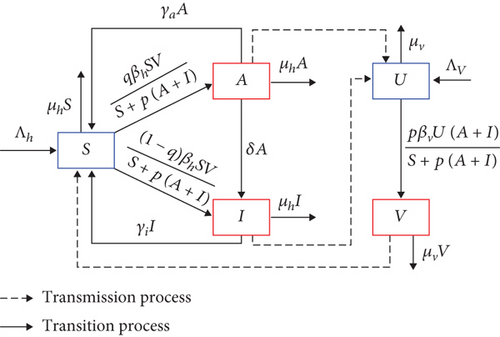
In this section, we formulate our malaria transmission model. We assume that the human population can be divided based on their health status as susceptible (S), asymptomatic infected (A), and symptomatic infected (I). Hence, the total population of humans is given by N = S + A + I. On the other hand, the mosquito population is divided only into two compartments, namely, susceptible (U) and infected (V) mosquitoes. Hence, the total mosquito population is given by M = U + V.
The model is developed based on the transmission diagram in Figure 1 and the following assumptions. All newborn humans and mosquitoes are assumed to be always susceptible with a rate of Λh and Λv, respectively. Malaria infection only occurs due to the bite of infected mosquitoes on susceptible humans with a success rate of βh, and the bite of susceptible mosquitoes on the infected humans A and I with a success rate of βv. In 2005, Lacroix et al. [31] discovered that mosquitoes showed a greater attraction to individuals infected with malaria. Their research indicated that mosquitoes exhibited a heightened preference for humans carrying the transmissible gametocyte stage of malaria parasites, as opposed to those who were uninfected or had the nontransmissible asexual stages. This phenomenon is called vector bias. Hence, using a modification approach as the authors in [29, 30], with a vector-bias parameter p > 1, we model the infection process in humans and mosquitoes using a ratio-dependent term: βhSV/S + p(A + I) for humans and βvUp(A + I)/S + p(A + I) for mosquitoes. We assume that not all new infections of human which is denoted by βhSV/S + p(A + I) develop symptoms. Hence, we introduced q and 1 − q as a proportion of new infected human who do not develop and develop symptoms, respectively. Therefore, we have qβhSV/S + p(A + I) goes to compartment A, while (1 − q)βhSV/S + p(A + I) goes to compartment I.
2.1. Nondimensional Model
Model in system (3) reduced our model from five to three dimensions. Hence, our model analysis will be focusing on system (3) instead of its original model in (1).
3. Model Analysis
Some mathematical analysis is given in this section, such as the existence of trivial and nontrivial equilibrium points, their stability, the basic reproduction number, and their global stability analysis.
3.1. Malaria-Free Equilibrium and the Basic Reproduction Number
It is clearly observed that is a result of the multiplication of the number of newly infected mosquitoes and newly infected humans. Note that the production of infected human depends on the ration between mosquito and human. A larger ratio (larger population of mosquito) will increase the production of infected human.
Furthermore, it is not difficult to show that system (3) satisfies the five conditions in Theorem 3 [36]. Hence, using the result in [36], we have the following theorem.
Theorem 1. The malaria-free equilibrium of system (3) (MFE) is always locally asymptotically stable if and unstable if .
3.2. Malaria-Endemic Equilibrium
From this, we can see if , then p0 < 0. Hence, we have exactly one positive root of polynom 5 which indicates the existence of a unique endemic equilibrium for . On the other hand, if , then p0 > 0. Hence, the multiplication of the root of system (10) will be positive, while the addition of the root will be negative since p1 is always positive. Therefore, no endemic equilibrium if . These results are stated in the following theorem.
Theorem 2. System (3) has a unique endemic equilibrium MEE if and no endemic equilibrium otherwise.
3.3. Bifurcation Analysis
Since all parameters are positive, then we have and . According to these results, the following theorem is obtained.
3.4. Global Stability of the Endemic Equilibrium
Hence, we have ∂f1/∂x1 + ∂f2/∂x2 + ∂f3/∂x3 < 0. It means we have the system strictly negative almost everywhere on Z. Thus, the system has no periodic orbits or graphics in the open first quadrant. Hence, by Poincare-Bendixson trichotomy Theorem 5.7 page 195 in [44], the endemic equilibrium MEE is global asymptotically stable.
3.5. Bifurcation Diagram and Autonomous Simulation
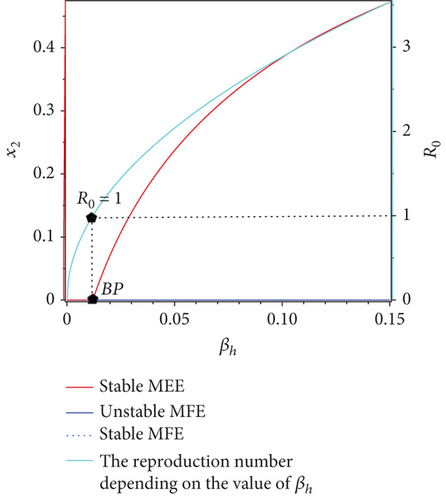
To illustrate the results of the bifurcation diagram, please refer to Figure 2. From Figure 2, it is evident that the endemic equilibrium x2 exhibits a monotonically decreasing trend as βh increases until it reaches the bifurcation point (BP) at or βh = 0.012. From the bifurcation diagram, we can see that there is a change in the stability of malaria-free equilibrium at BP, i.e., when , from stable to unstable. On the other hand, we have a new endemic equilibrium start to arise when the malaria-free equilibrium changes its stability. For five sample points of βh when βh < 0.012, the malaria-free equilibrium is stable, which is shown by the trajectories of the solution all tend to the malaria-free equilibrium (see Figure 2(b)). On the other hand, when we take five sample points when βh > 0.012, then all the solutions tend to their own stable malaria-endemic equilibrium. See Figure 2(c) for the illustration. Larger βh, then the size of x2 at the equilibrium will become larger.


4. Optimal Control Problem
4.1. Optimal Control Model and Its Characterization
4.2. Optimal Control Simulation
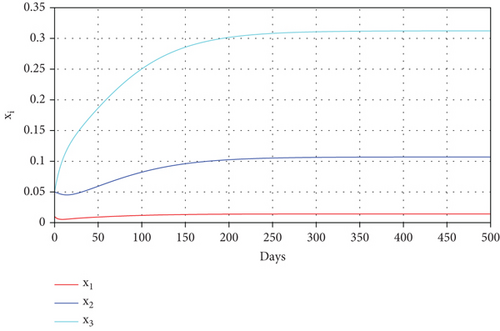
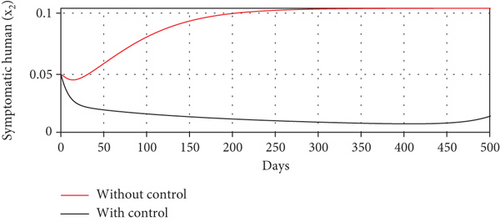
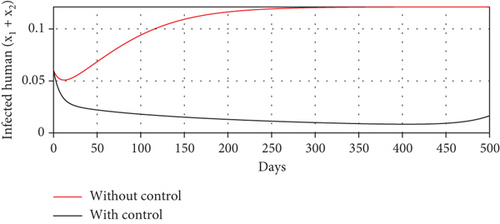
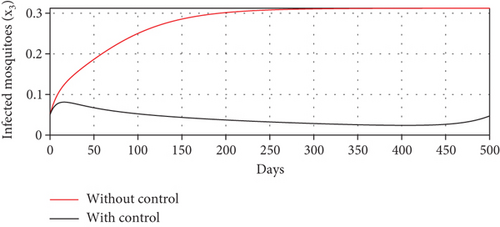
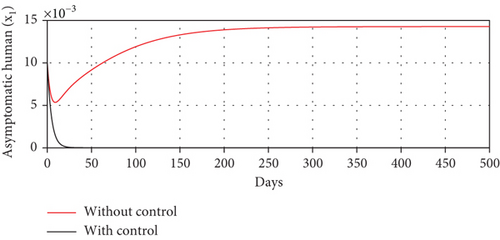
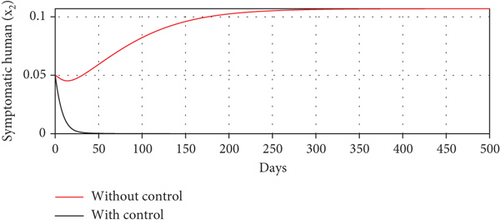
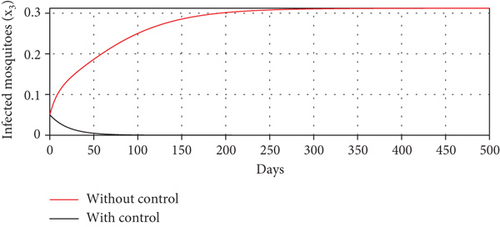
With these chosen parameter values, we have , indicating the stability of the endemic equilibrium point. Hence, without any intervention of controls, the population will tend to an endemic situation where the proportion of asymptomatic individuals reaches 1.4%, the proportion of symptomatic individuals reaches 10.6%, and the proportion of infected mosquitoes reaches 31.2%. The dynamics of system (20), which tend towards the endemic equilibrium point, are shown in Figure 3.
We solve the model in (20) with and without control numerically by applying the backward and forward sweep as described in [45]. Readers who are interested to see further examples on the implementation of this algorithm may refer to [33, 46–48]. In the beginning, we give an initial guess for u1(t) and u2(t) constant for all time t. With this initial guess, we solve system (20) forward in time. This solution is then used to solve the adjoint system in (24) backward in time. Hence, we can update the optimal value of u1(t) and u2(t) using the formula in (27a). We repeat these steps until we reach the convergence criteria or its maximum iteration K, i.e., ‖JIteration−(k + 1) − JIteration−(k)‖ < ε, where ε is the tolerated error. We use ω1 = 0.3, ω2 = 0.3, ω3 = 0.01, and ω4 = 0.1 to run all of our optimal control simulation, except it is stated differently.
4.2.1. Different Combination of Interventions
- (1)
Scenario 1: use of repellent and hospitalization
- (2)
Scenario 2: use of repellent only

- (3)
Scenario 3: use of hospitalization only

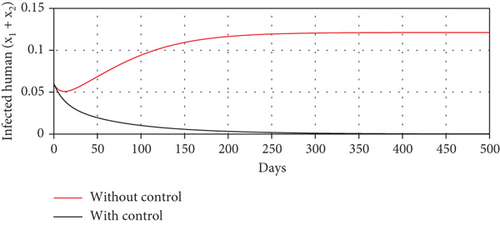
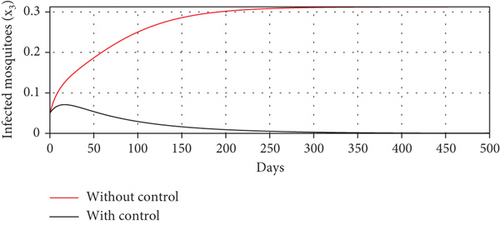

| Scenarios | Optimal control | TAI | TCI | ACER |
|---|---|---|---|---|
| 1 | u1, u2 | 0.0555 | 4.7 × 10⁻⁶ | 8.4 × 10⁻⁵ |
| 2 | u1 | 0.101 | 1.2 × 10⁻⁵ | 1.2 × 10⁻⁴ |
| 3 | u2 | 0.107 | 0.069 | 0.65 |
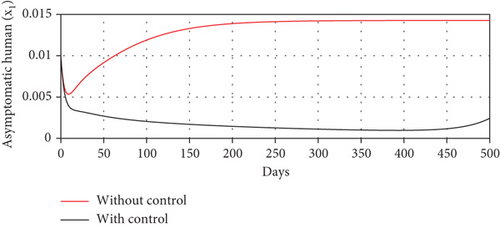
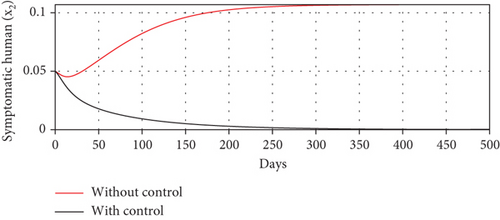
Scenario 3 shows the strategy of using only hospitalization (u2 implemented to reduce malaria spread). Similarly, we can observe the success of hospitalization intervention in reducing the number of infected individuals. From Figures 6(a)–6(d), we can see a more significant reduction in the number of infected individuals and mosquitoes compared to other scenarios. However, it requires maximal intensity at the beginning of the simulation period, with 100% of symptomatic individuals being hospitalized. This high intensity of hospitalization leads to a significant increase in the implementation cost.


- (1)
Average cost-effectiveness ratio (ACER)
- (2)
The incremental cost-effectiveness ratio (ICER) formula
Based on the numerical simulation, we rank all strategies in increasing order based on the total number of infections averted in Table 2.
| Scenarios | Optimal control | TAI | TCI | ICER |
|---|---|---|---|---|
| 1 | u1, u2 | 0.0555 | 4.7 × 10⁻⁶ | 8.5 × 10⁻⁵ |
| 2 | u1 | 0.101 | 1.2 × 10⁻⁵ | 1.6 × 10⁻⁴ |
| 3 | u2 | 0.107 | 0.069 | 11.5 |
Note that ICER for scenario 3 is larger than any other scenario. Hence, we can exclude ICER for scenario 3 from the next calculation. Next, we compare the ICER between scenarios 1 and 2. The result of calculating ICER using the same method as before is shown in Table 3.
| Scenarios | Optimal control | TAI | TCI | ICER |
|---|---|---|---|---|
| 1 | u1, u2 | 0.0555 | 4.7 × 10⁻⁶ | 8.5 × 10⁻⁵ |
| 2 | u1 | 0.101 | 1.2 × 10⁻⁵ | 1.6 × 10⁻⁴ |
Table 3 shows that ICER scenario 2 > ICER scenario 1, which means that scenario 2 (repellent (u1)) is more costly compared to scenario 1 (combination of repellent u1 and hospitalization (u2) implemented). Hence, we can conclude that the use of repellent u1 and hospitalization (u1), as double intervention to reduce the spread of malaria, is the most cost-effective strategy compared to other possible scenarios.
4.2.2. Impact of Vector Bias on the Dynamic of Controls
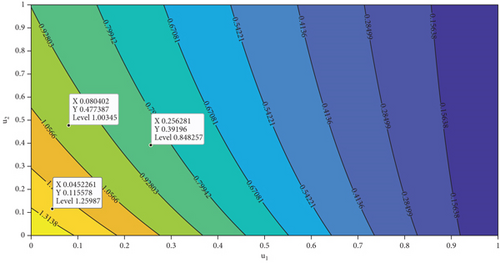
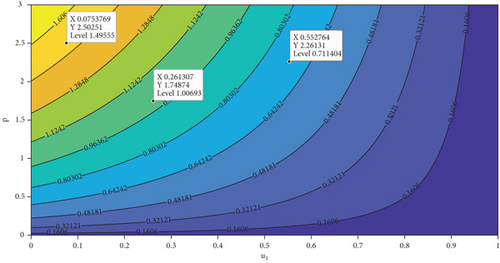
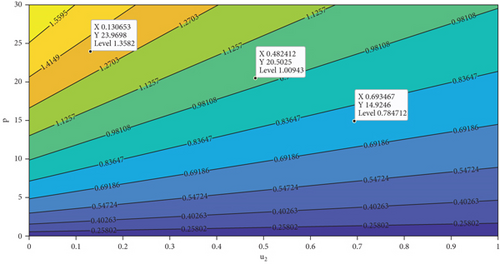
In this section, we analyze the impact of vector bias on the dynamics of control variables. At first, we analyze the dependency of to u1 and u2. By substituting all parameters in equation (27b), except u1 and u2 into , the level set of respect to u1 and u2 is given in Figure 7. It can be seen clearly that increasing proportion of people who use mosquito repellent and infected people who undergo treatment in the hospital can reduce the control reproduction number significantly (Figure 7(a)). Furthermore, from Figures 7(b) and 7(c), we can see that increasing of vector-bias parameter will increase the minimum effort of mosquito repellent and treatment such that .
To study the impact of vector bias on the dynamics of malaria control, we computed the solutions of u1 and u2 for p = 1, 2, 3, as shown in Figure 8. Note that the basic reproduction number for each p is , , and , indicating that without intervention (repellent or hospitalization), malaria will persist in the population.
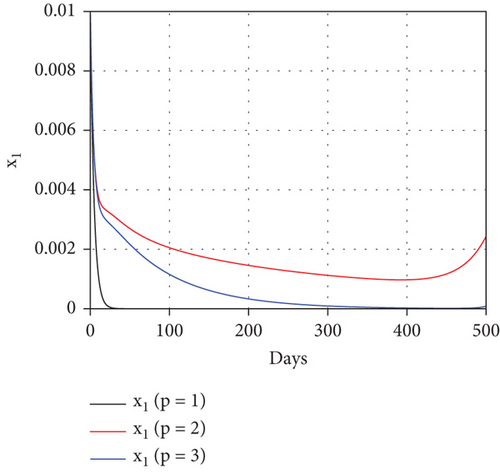
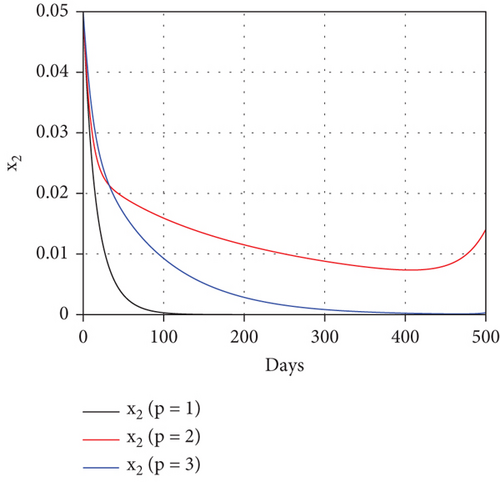
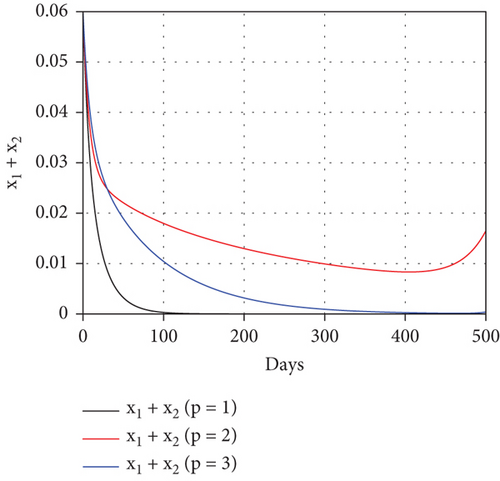
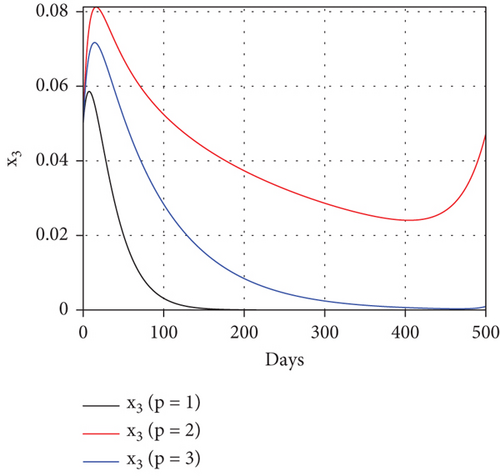
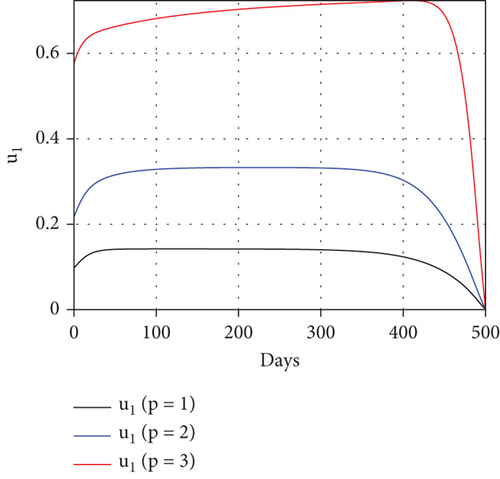
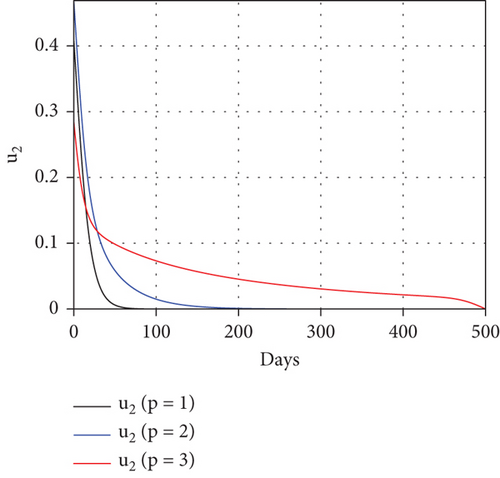
The profiles of the controls appear similar for each value of p. However, a larger p requires a higher rate of repellent and hospitalization at all times t, resulting in a higher cost function value. For comparison, please refer to Table 4. It is clear that a higher value of vector bias necessitates a higher intensity of interventions, as indicated by a higher cost of J. This high intensity of intervention from the early period of the simulation leads to a greater reduction in the number of infected individuals. When p = 3, the percentage of infected individuals is reduced by 97% compared to the total infected without any control, whereas for p = 2 and p = 1, the reductions are 87% and 26%, respectively.
| Case p = 1 | Case p = 2 | Case p = 3 | |
|---|---|---|---|
|
|
1.02 | 1.44 | 1.77 |
| Total infected humans without control | 0.00246 | 0.1075 | 0.2366 |
| Total infected humans with control | 0.00182 | 0.0141 | 0.0062 |
| Total averted infected | 6.4 × 10⁻⁴ | 0.0934 | 0.2304 |
| Percentage of reduction | 26% | 87% | 97% |
| J | 9.78 × 10⁻⁴ | 0.0056 | 0.0069 |
5. Conclusion
In this paper, we developed a nonstandard SAIS-UV model for malaria transmission. Unlike other malaria models [50–52], here, we consider a vector bias impact on the transmission process. As mentioned by [31], vector bias phenomena cannot be ignored in the malaria transmission process since it gives a higher preference to mosquitoes to bite infected humans. Unlike the proposed vector bias model by the author in [15, 29, 30, 53], here, we consider optimal control and asymptomatic cases in our analysis. With this model, infected humans are divided into two compartments, namely, asymptomatic and symptomatic individuals. With vector bias, mosquitoes are assumed to be more attracted to bite-infected humans. Mathematical analysis regarding its equilibrium points, global stability of the equilibrium points, and the basic reproduction number have been shown analytically. We found that malaria will always go extinct if the basic reproduction number is smaller than one. On the other hand, we always found a globally stable endemic equilibrium point if the basic reproduction number is larger than one. Furthermore, we also found that a larger vector bias of mosquitoes will increase the basic reproduction number.
For the malaria control strategy, we extend our model by involving two distinct interventions, namely, mosquito repellent (u1) with an efficacy of 1 − ξ and hospitalization (u2). In order to minimize the cost of intervention, we treat u1 and u2 as time-dependent variables. The Pontryagin maximum principle has been used to characterize the optimal control problem. Using cost-effectiveness analysis, we found that a combination of mosquito repellent and hospitalization is more cost-effective compared to other single interventions (hospitalization only or mosquito repellent only). Furthermore, we also found that the more biased vectors attracted to infected humans, the higher the cost needed to control the spread of malaria.
Although this model is simple in terms of the number of compartments involved, it can still provide us with insights into the importance of understanding the vector-bias phenomenon in malaria. Furthermore, we have not yet included other important factors such as people’s awareness and fumigation to control the spread of malaria. Hence, we will consider these two interventions in future studies. Please refer to [54–56] for existing mathematical models on people awareness, media campaigns, and the use of Wolbachia in some vector-borne disease transmission models.
Conflicts of Interest
The authors declare that there is no conflict of interest.
Acknowledgments
This research is funded by the Ministry of Education and Culture of Indonesia in collaboration with the Education Fund Management Institution (LPDP) of the Republic of Indonesia through the UKICIS Research Grant Scheme (ID number 4345/E4/AL.04/2022).
Open Research
Data Availability
The data used to support this study is taken from the previously published papers.


