Insights Into Lithium-Ion Battery Cell Temperature and State of Charge Using Dynamic Electrochemical Impedance Spectroscopy
Abstract
Understanding and accurately determining battery cell properties is crucial for assessing battery capabilities. Electrochemical impedance spectroscopy (EIS) is commonly employed to evaluate these properties, typically under controlled laboratory conditions with steady-state measurements. Traditional steady-state EIS (SSEIS) requires the battery to be at rest to ensure a linear response. However, real-world applications, such as electric vehicles (EVs), expose batteries to varying states of charge (SOC) and temperature fluctuations, often occurring simultaneously. This study investigates the impact of SOC and temperature on EIS in terms of battery properties and impedance. Initially, SSEIS results were compared with dynamic EIS (DEIS) outcomes after a full charge under changing temperatures. Subsequently, DEIS was analysed using combined SOC and temperature variations during active charging. The study employed a commercial 450 mAh lithium-ion (Li-ion) cobalt oxide (LCO) graphite pouch cell, subject to a 1C constant current (CC)–constant voltage (CCCV) charge for SSEIS and CC charge for DEIS, with SOC ranging from 50% to 100% and cell temperatures from 10 to 35°C. The research developed models to interpolate battery impedance data, demonstrating accurate impedance predictions across operating conditions. Findings revealed significant differences between dynamic data and steady-state results, with DEIS more accurately reflecting real-use scenarios where the battery is not at equilibrium and exhibits concentration gradients. These models have potential applications in battery management systems (BMSs) for EVs, enabling health assessments by predicting resistance and capacitance changes, thereby ensuring battery cells’ longevity and optimal performance.
1. Introduction
Lithium-ion (Li-ion) batteries are crucial in achieving global emissions reductions. However, these batteries experience degradation over time and usage, which can be influenced by various factors such as their operating conditions and charge level [1]. The impact of operating conditions, such as the combined influences of varying states of charge (SOC) and cell temperature, is essential in battery research. By studying how SOC and temperature affect battery cell properties, researchers can gain valuable insights into battery behaviour, such as how these factors affect cell resistance and cell health, and work towards optimising their performance.
Furthermore, with the rising need for fast charging in the present market, extreme fast charging (XFC), defined as charging ≥350 kW at 6C to 80% SOC in ~10 min, is highly sought after for Li-ion batteries in electric vehicles (EVs) [2–4]. XFC is becoming feasible due to the network of public direct-current (DC) XFC chargers with the power to add 200 miles of driving range in 10 min via the 400 kW output [5]. However, using these XFC chargers on a battery is mainly limited by the Li+ insertion process at the graphite anode [6]. This limit leads to a build-up of ions that results in a high concentration gradient of Li+ on the interface of the graphite, and if this concentration of Li+ ions is saturated, anode lithium plating will occur [6].
To mitigate the high concentration gradient of Li+ ions on the interface, charging enhancement methods, such as a magnetic field or ultrasound, can be utilised to stir the Li+ ions to even out the concentration gradient and allow for fast charging without the build-up of lithium plating [7, 8]. The proposed approach of using charging enhancement methods to mitigate Li+ ion concentration gradients on the electrode/electrolyte interface has the potential for broad applicability, making it a versatile solution that can be adapted to a wide range of studies, particularly in the context of enhancing charging processes. However, the cell’s lithium diffusion rate and charge transfer resistance (Rct) properties at the anode must be measured to quantitatively evaluate and control the effect these charging enhancement methods have on improving the even distribution of Li+ ions on the electrode/electrolyte interface.
Electrochemical impedance spectroscopy (EIS) is a widely used, fast, non-intrusive measurement method for evaluating cell properties and degradation through fitting equivalent circuit models (ECMs). By analysing changes in the parameters of the ECM, such as resistance and capacitance values, EIS provides valuable insights into the underlying degradation mechanisms and helps identify the affected properties [9].
The majority of studies on battery impedance utilise the steady-state EIS (SSEIS) approach, where no DC bias is applied when investigating the effects of SOC or temperature on impedance [10–12]. The primary advantage of SSEIS is that it ensures the cell under test satisfies the stationarity and linear assumption condition, enabling reliable impedance measurements [13]. However, SSEIS is not applicable when investigating active charging because the concentration gradients in the battery have already settled once SSEIS starts.
Several studies have explored the use of dynamic EIS (DEIS), where a DC bias is employed, and alternating current (AC) impedance probing is carried out during active battery use—for example, Karden et al. [14] conducted an extensive study, producing impedance plots for continuous discharging DEIS for different DC currents SOCs and temperatures. However, this was for lead-acid batteries with no charging aspect considered. A combination of EIS and charge/discharge curves analysis for predictions of the dynamic behaviour of lithium-iron-phosphate (LFP) Li-ion batteries was studied by Dong et al. [15] over a wide range of charges and discharges, including battery parameters relative to the function of changing SOC, although they did not consider the effect of changing temperature (only 22 ± 1°C). Juang et al. [16] DEIS was carried out to investigate the impact of temperature and DC bias current on LFP and lead-acid battery impedance characteristics. This work demonstrated that, as the battery’s DC bias current increases, DEIS indicated that the impedance semi-circular trajectory results, where the trajectory diameter (which corresponds to the resultant value of resistance and capacitance for an electrochemical process) shrinks in diameter. However, their results only considered a single SOC.
Previous authors have introduced approaches for DEIS in commercial Li-ion cells by allowing for the investigation of varying SOC during DEIS, namely Huang et al. [17] with a lithium-manganese-oxide/Li half-cell, Teo, Subramanian, and Schwartz [18] with a Li-ion cobalt oxide (LCO) and graphite cell, and Huang, Li, and Zhang [19] with a lithium-nickel-manganese-cobalt (NCM) cell. These investigations compare SSEIS and DEIS data during charging and discharging, recording impedance and the Rct variable, with Rct representing the difficulty of charge transfer between the electrode material and the electrolyte interface. However, these authors did not consider the effect of temperature on impedance; only Huang et al. considered temperature for the Rct value, and none of these studies investigated the other battery property variables. This present study reports interesting new findings obtained by examining the other battery properties of wire induction (L), Ohmic resistance (Rohm), solid electrolyte interphase (SEI) constant phase element (CPESEI), SEI resistance (RSEI), double-layer CPE (CPEdl), and Warburg (Zw, or W) elements, in addition to the Rct value, with SOC and temperature.
EIS is the method selected to examine these battery properties non-invasively, although the current interrupt diagnostic method was also considered for reasons described in Section 2.1 [20]. Thus, this study undertakes a comparative analysis of distinct EIS charge protocols, specifically SSEIS and DEIS, to evaluate how these varying EIS protocols lead to differences in battery properties, including induction, capacitance, and resistance. This investigation also considers SOC and temperature variations. The primary goal is to investigate the impact of SOC and temperature on EIS concerning battery properties and impedance. Furthermore, this study aims to differentiate SSEIS and DEIS data and identify novel trends in battery properties for predicting impedance curves. This predictive capability is critical when implementing charging enhancement techniques that modify the cell’s temperature and SOC. In such scenarios, anticipating the impedance curve for the baseline non-enhanced charging scenario under equivalent temperature and SOC conditions allows for a thorough assessment of the enhancement method’s efficacy while the battery is actively charging. The prediction of the battery impedance involves the development of models, which will be discussed in detail later in this article. Consequently, the findings of this research contribute valuable insights to understanding DEIS. These insights expand the knowledge of batteries and EVs, particularly in comprehending the combined effects of temperature and SOC during charging, which will be elaborated upon in subsequent sections.
This article covers the following key topics: The first highlights why EIS has been selected, briefly discussing what SSEIS and DEIS are, the application and challenges of non-conventional EIS, and how EIS permits the production of an ECM. The second is the experimental setup and protocols used to carry out SSEIS and DEIS on the Li-ion battery. Finally, this study discusses the impact of varying EIS charge protocols on battery properties, particularly impedance. It also explores the influence of battery SOC and temperature on these properties, utilising the “full charge battery equivalent circuit model” (FCBEM) for SSEIS and the novel “active charge battery equivalent circuit model” (ACBEM) for DEIS.
2. Impedance Spectra and ECM
2.1. Steady-State and DEIS
The two main Li-ion battery diagnostic techniques that analyse a battery’s response to a current or voltage excitation are impedance and current interrupt methods [20]. The current interrupt method calculates the effective battery resistance by measuring the voltage change during a current excitation. This method gives accurate open-circuit voltage (OCV) measurements and provides solid-state diffusion coefficients in lab environments. It does not require additional hardware, so it is relatively straightforward to implement for on-board analysis. However, it does not provide a wide frequency bandwidth, unlike EIS. Furthermore, its long test time and OCV nature make it unsuitable for probing how the charging enhancement methods would affect the battery while actively charging [20].
EIS allows for the analysis of the active processes occurring inside a battery. However, the disadvantages of this method are the need for costly instrumentation and the difficulty of gaining good-quality data at very low frequencies. Gaining meaningful data analysis requires understanding the various frequency-dependent characteristics and curves observed in the EIS spectra to battery ECM parameters, which is covered in Section 2.2 [21].
Conventionally, for EIS, the measured battery must be at a steady state, labelled SSEIS, where a probing AC excitation, IAC, or voltage is applied, keeping the cell at OCV with a zero net current condition. SSEIS is usually implemented at 0% or 100% SOC to avoid interrupting a constant current (CC) charge and associated capacity measurement, although stopping a discharge/charge mid-cycle and probing the battery is possible. However, for the measurement, the net current must remain at zero throughout the time required to measure the whole EIS spectrum. Therefore, when taking an EIS measurement to gain the spectrum results on a Nyquist plot, with real impedance elements, such as resistance, on the abscissa and imaginary impedance elements, like inductance and capacitance, on the ordinate axis, the measurement process will take time, with the high-frequency (kHz) measurements taking seconds, the mid frequencies (Hz) taking approximately a couple of minutes, and the low (mHz) measurements taking several minutes or up to an hour [22]. Keeping a cell’s conditions steady can be challenging in such time scales, with measurement drift from the growth of an oxide layer, build-up of reaction products in the solution, or temperature changes affecting the measured system [23].
Alternately, a dynamic or non-conventional EIS, dubbed DEIS, can be applied, where a probing AC excitation current, IAC, or voltage is overlayed with an applied charging/discharging DC, IDC, or voltage. In this case, keeping the cell at a steady state is not required, allowing for the characterisation of battery behaviour under dynamic conditions and multiple probing results during a single charge or discharge process. This provides valuable insights into the dynamic responses of the battery’s impedance and properties. Hence, this is the main reason why EIS was selected for analysing the battery, due to its capability to be applied as DEIS; however, there are some challenges to DEIS, and interpretation of the dynamic impedance can be difficult [18].
First, the challenges for utilising DEIS differ depending on whether EIS is applied with a laboratory-grade potentiostat or in situ for controlling the system. In the context of in situ applications, several primary challenges need consideration [13]. First, the lack of precise control arises as field-based EIS relies on available equipment, often requiring more precision and control, such as that found in potentiostats. Second, the limited frequency range of field instruments can restrict the ability to cover the required spectrum for comprehensive impedance spectra, potentially compromising data quality. Third, electrode stability becomes critical for in situ EIS, where long-term measurements are standard, necessitating equipment to ensure electrode stability over extended periods. Fourth, data analysis poses challenges in field conditions due to electrical noise and interference, demanding specialised data processing techniques to extract meaningful insights from measurements. Lastly are cost considerations; e.g., while the goal is to circumvent the expense of laboratory-grade potentiostats, the development of custom in situ EIS setups and instruments can also incur significant costs, mainly when specialised equipment, such as customised sensors and advanced impedance analysers, are essential [13]. Hence, in situ techniques are excluded from this study, and a laboratory-grade potentiostat is applied instead.
Furthermore, on the DEIS challenges, SSEIS typically operates under the assumption of a linear system, with the Fourier transform from the time to frequency domain following a linear response assumption [24] and the relationship between the sinusoidal perturbation input (commonly an applied current or voltage) and the resulting impedance response is assumed to be linear, following Ohm’s law [13]. However, in the case of DEIS, non-linearity arises due to the significantly higher applied current (IAC + IDC) than SSEIS, where only IAC is applied. According to the Butler–Volmer relationship between current and overpotential, DEIS’s overpotential (η) is more pronounced than SSEIS’s. Consequently, this leads to differences in battery properties observed between DEIS and SSEIS [19].
Discerning whether a response is linear or non-linear involves monitoring the evolution of an EIS experiment by observing input and output signals plotted on a single current (I) vs. potential (E) graph over time, known as a Lissajous plot [25]. A quantitative assessment of the non-linearity and the derivation of a specific non-linearity value from I vs. E over time could not be achieved; yet, a similar plot of charge per unit area (Q) measured in C.cm−2 against potential (E) can provide insights into linearity [26, 27]. The insight is that an ideal linear system would have a linear relationship between charge and potential. As potential increases, the charge per unit area would increase proportionally, giving a straight line. However, this relationship deviates during a non-linear system and will provide a curved or warped response [28]. Thus, this Q vs. E analysis was carried out at the different SOC to determine the relationship provided by the testing. The initial impedance steps during DEIS between 0% and 30% SOC displayed curved non-linear characteristics compared to their SSEIS counterparts. The incomprehensible impedance curve data further emphasised this non-linearity, thought to derive from the initial application of the current and non-linear increase in battery voltage [29], prompting its exclusion from the analysis presented in this paper. However, subsequent impedance steps observed during DEIS between 50% and 100% SOC displayed a linear straight trend on the Q vs. E graph. Given the linearity observed within the investigated data range, a quantitative assessment of non-linearity was not carried out.
- 1.
DEIS systems may exhibit variations in impedance properties over time due to their frequency-dependent responses. This effect can be further exacerbated by changes in the battery cell’s SOC during DEIS, potentially resulting in significant errors in the low-frequency spectral region if not properly managed [13]. Whilst omitting very low-frequency measurements can mitigate this issue, it comes at the cost of reduced insight into slower diffusional processes within the cell [13].
- 2.
Non-linear behaviour tends to become more pronounced under extreme conditions, such as rapid battery charging or discharging. It is challenging to distinguish genuine system behaviour from measurement factors such as drift or noise [19].
- 3.
Joule heating during charging and discharging introduces further distinctions between DEIS and SSEIS, with these differences being more prominent at lower temperatures. However, at temperatures exceeding 25°C, these distinctions may become less consequential [30].
- 4.
Non-linear DEIS often demands more sophisticated optimisation techniques for parameter estimation due to the complexity of non-linear models and the more significant number of parameters involved. This model complexity can be computationally intensive and may necessitate more extensive experimental data for accurate ECM parameter estimation [19].
Overcoming these challenges requires making informed choices about the frequency range and including or excluding ECM parameters to improve experimental results. Moreover, developing advanced modelling approaches, coupled with a more profound understanding of DEIS concerning battery properties influenced by temperature and SOC factors, is pivotal. Thus, a comprehensive ECM is needed to accurately characterise complex electrochemical processes inside the battery.
The following section discusses the principles of ECMs and their application for fitting a model to a Li-ion battery.
2.2. ECM
EIS data, whether SSEIS or DEIS, is frequently analysed by fitting it to an analogous ECM. The circuit model comprises common electrical elements such as inductors, resistors, and capacitors. EIS models commonly employ various elements in a network, arranged in both series and parallel configurations, to create a battery ECM. While it is possible to model an entire Li-ion battery cell using a lengthy ECM, interpreting the meaning of each Nyquist semi-circle in an EIS spectrum can be challenging with this approach [31]. Therefore, combining and simplifying several of these elements is recommended to reduce the number of circuit elements for practical impedance analysis, as the ECM would contain too many variables.
The complete simplified ECM of a Li-ion battery full-cell is shown in Figure 1a, often called a second-order Randles ECM. The simplified Randles cell, especially the second-order Randles cell, is one of the most common cell models used [23]. It includes a wire induction (L), Rohm, a CPESEI, RSEI, CPEdl, Rct, and lastly, Zw, or W elements [32]. With these elements highlighted, the EIS spectra Nyquist plot for this model shows two-time constants in the graph, categorised into the SEI and charge transfer sections, as seen in Figure 1b.
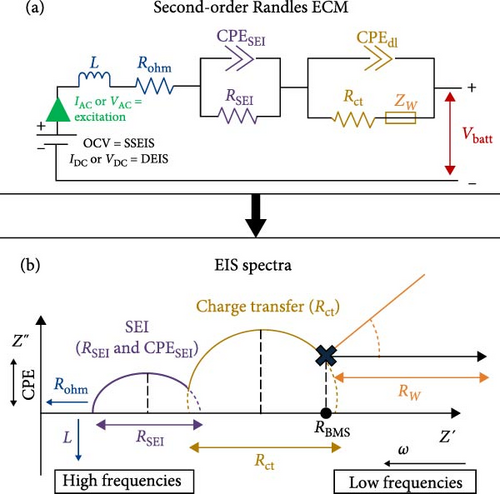
When examining Figure 1b, it is noted that the inductive response observed in the high-frequency range of the spectrum may be attributed to measurement system factors, such as the wires linking the cell to the measuring instrument or the cell geometry and windings [13]. Furthermore, the point at which the EIS data intersects with the real horizontal axis in the high-frequency region indicates the sum of inline or non-frequency dependant resistances [13].
In the mid-frequency range, the arcs observed in the EIS data correspond to the electrochemical reactions at the electrode–electrolyte interface in the battery cell. These arcs are the result of the interplay between capacitive and resistive effects. At each electrode, two parallel processes occur: lithium transport through the SEI (RSEI) in conjunction with dielectric polarisation (CPESEI) and lithium (de-) intercalation (Rct) in conjunction with double-layer (dis-) charging (CPEdl) [13]. Thus, the EIS spectrum exhibits inputs from at least four distinct processes.
Finally, the low-frequency tail observed in the EIS spectra represents primarily solid-state Li-ion diffusion in the active material of the cell electrodes. However, it is also possible that other diffusion aspects, such as concentration gradients within the separator and diffusion in the electrolyte-filled pores within the electrodes, may contribute to this spectrum region [13].
3. Experimental Setup and Protocols
Modern EIS analysis software, such as Z-VIEW, used in this paper uses a non-linear least squares fitting (NLLS) algorithm to determine the ECM parameters that best fit the measured impedance spectrum. Initially, the algorithm is given estimates for all the parameters and then assesses the resulting fit [23].
For SSEIS and DEIS, initial parameter estimates were sourced from similar LCO/graphite chemistry or Li-ion-sized 450 mAh capacity batteries. The inductance (L) was set to 2.00 × 10⁻⁷ H, as indicated by previous studies [37]. The Rohm at 0.13 Ω (also informed by the impedance’s intercept on the x-axis) [37]. The pseudo-capacitance of the SEI (CPESEI-T) was characterised by a value of 0.30 F.sP−1 [37, 38] and exponent (CPESEI-P) of 0.90 [37–39], with RSEI noted at 0.040 Ω [37, 39]. For the double-layer CPE, the pseudo-capacitance (CPEdl-T) was defined as 0.25 F.sP−1 [40], with an exponent (CPEdl-P) of 0.90 [40, 41] and Rct of 0.10 Ω [37, 40].
- 1.
Fitting software like Z-VIEW typically employs optimisation algorithms to minimise the difference between the experimental data and the model predictions. The choice of initial guesses for fitting parameters can influence the convergence of these algorithms. In some cases, an incorrect initial guess may lead the optimisation algorithm to converge to a local minimum rather than the global minimum, resulting in a less accurate fit [42].
- 2.
Compared to SSEIS, DEIS involves a driving current or voltage on top of the excitation value, which may lead to non-linearity, and the increased complexity in dynamic measurements can make the fitting process more sensitive to initial guesses. SSEIS, on the other hand, should exhibit more predictable behaviour, and as a result, SSEIS data analysis may be less sensitive to incorrect initial guesses for fitting parameters. However, sensitivity to initial guesses still exists, particularly when fitting a complex impedance spectrum [43, 44].
- 3.
The user’s experience and expertise in selecting appropriate initial guesses can also influence the sensitivity of the fitting process. A knowledgeable user may choose initial guesses that lead to convergence on the global minimum, even in complex dynamic measurements [45].
With appropriate initial values selected and once the algorithm’s ECM parameters reach an acceptable data fit, where errors on the estimated parameters are less than 5% on the fitting software, and the algorithm line overlayed the experimental result, a different data set can be evaluated on the degree to which the ECM parameters and cell properties change due to external factors such as temperature and SOC. With the ECM now defined, the experimentation arrangement and battery SSEIS and DEIS testing protocols are described.
The cell used was a commercial Renata ICP582930PR-01 450 mAh LCO and graphite anode Li-ion pouch cell, where the SOC of the battery is determined from the OCV based on the SOC–OCV curve. At 0% SOC, the battery had an OCV of 3.6 V, and at 100% SOC, an OCV of 4.2 V [46].
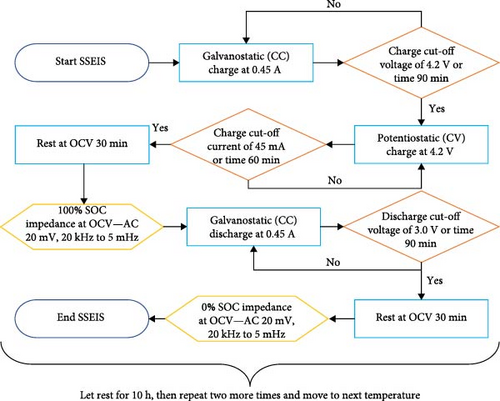
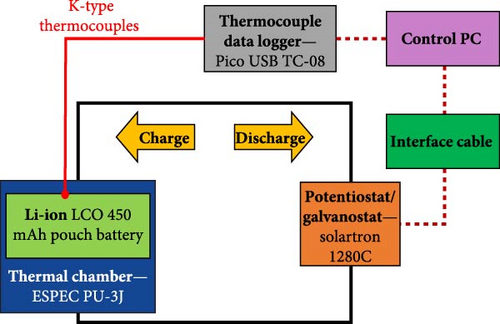
For the SSEIS testing, the battery was connected to a Solarton 1280C electrochemical test system potentiostat and galvanostat, which would allow battery charging, discharging, and impedance probing, and the battery was kept in an ESPEC PU-3J temperature chamber. The cell was analysed under temperature conditions of 10, 15, 20, 25, and 30°C at OCV following: (1) a full charge to achieve 100% SOC, and (2) after complete discharge to attain 0% SOC. This testing emphasised the charging aspect (100% SOC), and the ensuing results will be elaborated upon in subsequent discussions. Interpolation between data points is executed by inputting a new temperature value into the model. Subsequently, the model references and applies the trends derived from ECM parameters in Section 4.1.2 to predict the impedance curve for the new temperature. To show this, after the modelling process, a temperature condition of 22.5°C was also included as a validation point to verify the model’s efficacy. The cell’s and environmental chamber temperatures were recorded using K-type thermocouples connected to a Pico USB TC-08 thermocouple data logger.
To control the Solarton 1280C, the CorrWare 3.5i software was utilised to establish an SSEIS testing protocol (Figure 2a). Following a complete cycle at a fixed temperature, the cell was given a 10-h rest before the test was repeated at the same temperature for three cycles. This process was repeated at the next temperature until cycling through all temperatures.
The battery was connected to a four-terminal connection scheme used in high-performance EIS systems. To measure the cell surface temperature and the temperature of the surroundings, 4 K-type thermocouples were arranged in the mounting fixture. One thermocouple was attached to the central surface of the cell, one attached to the wall of the metal box containing the battery and 3D-printed battery holder, one attached to the battery holder itself, and a final one suspended in mid-air at the centre of the metal box to measure the free air temperature of the chamber. The schematic of the battery test setup is shown below in Figure 3.
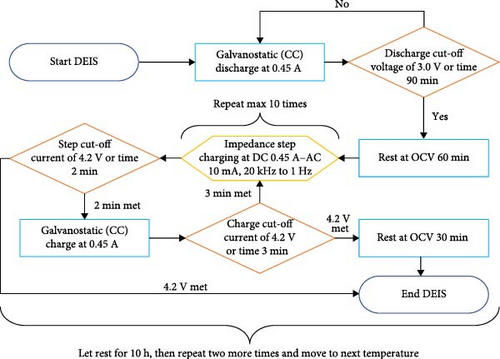
The DEIS setup closely resembles the SSEIS fixture arrangement but with two differences: the testing protocol and the additional thermocouples used on the cell. The DEIS testing protocol, illustrated in Figure 2b, involves subjecting the cell to the same temperature conditions as SSEIS (10, 15, 20, 25, and 30°C) but with active charging during impedance probing. Again, as part of the validation process, a temperature condition of 22.5°C was incorporated after the modelling phase, with interpolation now considering both cell temperature and SOC from ECM trends reported later in Section 4.2.2. Furthermore, throughout the DEIS conducted during the charging process, multiple impedance results are obtained at various stages of the charging cycle, with the amount depending on the ambient temperature; the cell could exhibit between 7 and 10 different impedance results during a full charge. For the cell surface temperature, three thermocouples were used, with one on the back centre surface of the cell and the other two on the front top right and front bottom left surfaces to capture any temperature gradients present in the cell.
4. Results and Discussion
4.1. Steady State EIS
4.1.1. Battery Impedance With Temperature at 100% SOC Model (FCBEM)
For the SSEIS testing, the impedance results covering the ambient temperature range of 10–30°C, while the cell was at OCV after being charged to 100% SOC, are shown in Figure 4a (note that individual SSEIS results are shown in the Supporting Information in Figure S1).
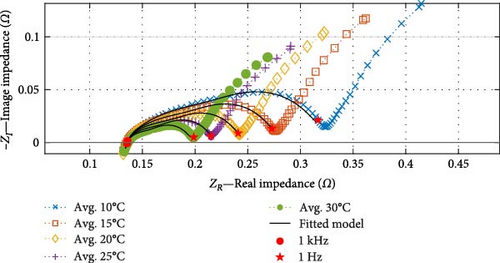
The results demonstrate significant variations in EIS measurements with temperature, even with small temperature changes of 5°C. The influence of temperature variation is most notable at low temperatures (≤15°C). As the ambient temperature in the environmental chamber increases, the impedance decreases, particularly in the mid-frequency region where the impedance curves become shallower, indicating a reduction in both the capacitance and resistance of the SEI and charge transfer arcs. This reduction in capacitance and resistance aligns with expectations due to increased ionic conductivity and improved reaction kinetics at higher temperatures [47].
The shape of the low-frequency diffusion tail initially appears less affected by temperature than the mid-frequency region. The Warburg tail follows a consistent pattern and angle across all temperatures. However, it is observed that the length of the Warburg tail, measured by both the horizontal (Warburg real impedance) and vertical (Warburg imaginary impedance) components, decreases with increasing temperature [38].
In the high-frequency induction region, a slight increase in the induction value arises with higher temperatures, but the overall effect of temperature remains minimal [38]. Interestingly, the high-frequency intercept, Rohm, superficially, does not appear to change with increasing temperature. However, upon closer inspection, the Rohm value only drops minimally with increasing temperature. As identified in the literature, the expected drop would decrease more noticeably at higher temperatures as the electrolyte conductivity reduces; thus, the fact that it does not change noticeably indicates that other effects dominate the resistive term [38].
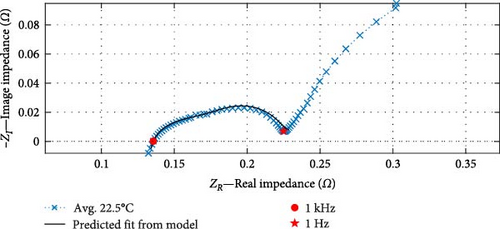
The suitability of the fitted “FCBEM” is illustrated in Figure 4a. As anticipated, the data fitting results demonstrate strong alignment with the impedance data between the 1 kHz and 1 Hz fitting range. The real impedance exhibits an average R2 value of 0.9998 (with a maximum of 0.9999 and a minimum of 0.9997), while the imaginary impedance boasts an average R2 value of 0.9971 (with a maximum of 0.9977 and a minimum of 0.9966) between the model and the experimental data. This high consistency confirms the model’s reliability regarding fit to the data. To illustrate the model’s accuracy and capabilities, a temperature data point of 22.5°C, which was not included in the model fitting process, is displayed in Figure 4b. The model demonstrates a robust predictive capacity, with a real impedance R2 value of 0.9998 and an imaginary impedance R2 value of 0.9977.
Since the model provides a good fit to the data, the specific ECM model parameters are now discussed as a basis for the FCBEM. A comparative analysis of the ECM parameters with temperature between SSEIS and DEIS data focuses on the cell at 100% SOC.
4.1.2. SSEIS vs. DEIS for Impedance and Battery Equivalent Circuit Parameters With Temperature
When comparing between SSEIS and DEIS, shown in Figure 5, it is revealed that there are notable differences in how impedance is affected by dynamic versus steady-state conditions. DEIS consistently shows a higher real impedance (ZR) across the frequency spectrum. This can be attributed to the dynamic conditions in DEIS, where active charging leads to more significant effects, such as ion accumulation at the electrode–electrolyte interface and higher Rct. These factors, in theory, create non-uniform ion concentration gradients, resulting in higher overall resistance. In contrast, SSEIS, conducted under more stable and equilibrium conditions, shows lower impedance as these dynamic effects are minimised or absent, providing a steadier response.
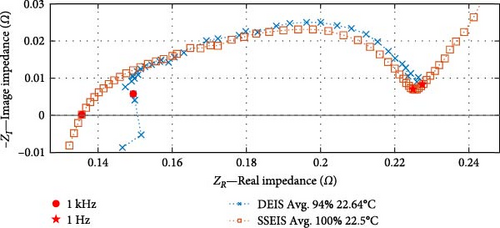
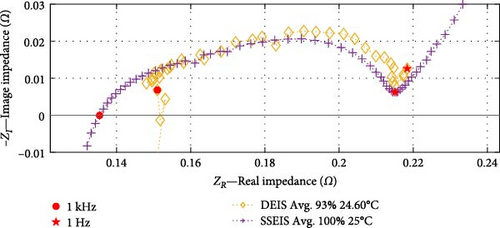
Regarding imaginary impedance (ZI), DEIS shows smaller values, indicating higher capacitive behaviour during dynamic charging. This higher capacitive effect is likely due to increased charge storage within the double layer at the electrode–electrolyte interface, influenced by the active movement of ions and continuous variation in SOC and temperature. The more uniform arc in SSEIS reflects a system at equilibrium, where fewer fluctuations occur in charge transfer processes, leading to a less pronounced capacitive response. Although both techniques operate at similar temperatures, the dynamic nature of DEIS introduces additional complexities, such as SEI stress, temperature variations, and transient effects, all contributing to the observed differences in impedance.
These differences underscore that DEIS captures real-time, non-equilibrium processes such as evolving ion concentration gradients and SEI layer changes, which are absent in SSEIS. This makes DEIS more suitable for assessing battery performance in real-world conditions.
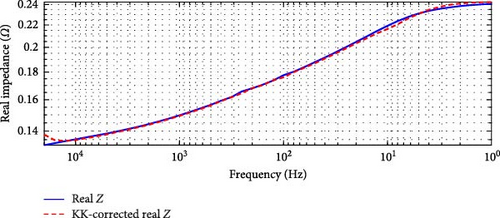
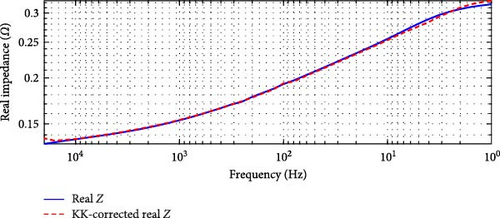
However, to check the DEIS data, a Kramers–Kronig (KK) compatibility check was performed to assess the stability of the impedance measurements. The standard tolerance for KK compatibility in EIS is generally set at 5% [48]. This tolerance indicates that the relative error between the actual impedance and the KK-corrected data should not exceed 5%. This ensures that the EIS data is stable, especially in battery research where diagnostic accuracy is crucial. If the data exceeds this threshold, it may suggest the presence of noise or non-ideal conditions, implying that the system might behave non-linearly.
In the case of the SSEIS data, as shown in Figure 6, the highest overall relative error is 4.59% in Figure 6a, occurring at 20°C, and the lowest is 3.52% in Figure 6b, occurring at 10°C. This range of errors confirms that the SSEIS impedance data is KK-compatible, with deviations primarily occurring in the high and low-frequency regions. The mid-frequency range, however, shows a strong correlation between the actual and KK-corrected real impedance values, supporting the accuracy of the model fitting in these regions.
For the DEIS data, shown in Figure 7, the highest overall relative error is 62.00% in Figure 7a, occurring at 93% SOC and 24.60°C, while the lowest is 5.79% in Figure 7b, occurring at 69% SOC and 10.83°C. These results indicate that the DEIS impedance data is not KK-compatible, especially in the high-frequency region. The significant deviations observed, particularly at high and low frequencies, suggest that the system instability during dynamic charging contributes to some of the more unsatisfactory fits at the start and end regions of the impedance curves, as seen in the DEIS section. Despite this, the mid-frequency range shows a better match between real and KK-corrected data, further indicating that the discrepancies are primarily due to instability in the data at the frequency extremes rather than the model itself.
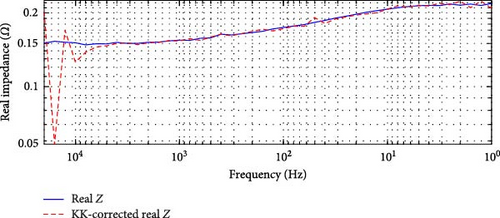
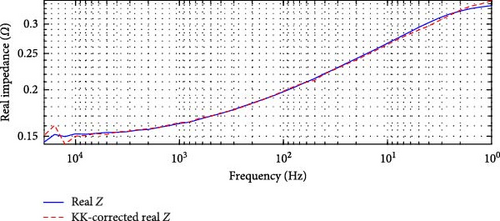
This KK analysis supports the hypothesis that the mismatches between the model fit and the impedance data, particularly in the high and low-frequency regions, are more likely due to data instability rather than a fault in the modelling approach.
With the data checked and after analysing parameter results from SSEIS and DEIS ECMs, several noteworthy trends emerge. This comparative analysis marks the first attempt to systematically compare all battery parameter trends with cell temperature across both SSEIS and DEIS, offering valuable insights into the dynamic behaviour of batteries under varying temperatures [18, 19].
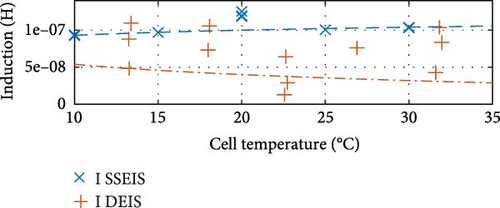
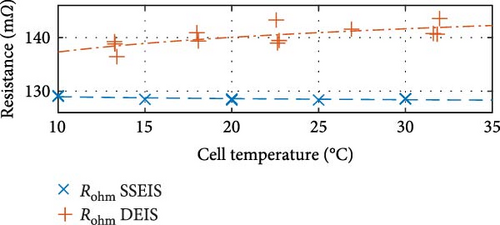
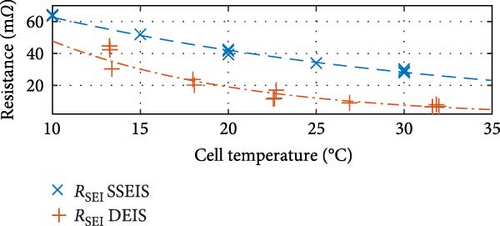
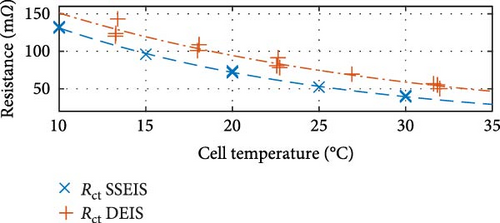
First, commenting on the SSEIS trends in Figure 8a, the induction value trend exhibits a marginal 11.8% increase when transitioning from 10 to 30°C, which aligns with expectations. The resistance-focused graphs in Figure 8b,e,h demonstrate that resistance values decrease as temperature increases across all cases. However, the magnitude of the response varies. Notably, Rohm shows a slight logarithmic drop with a temperature of 0.4% in value, while RSEI and Rct exhibit a more pronounced exponential decrease in response to temperatures of 55.1% and 69.9%, respectively.
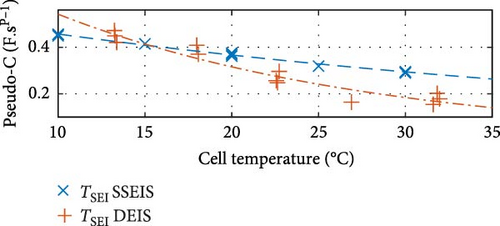
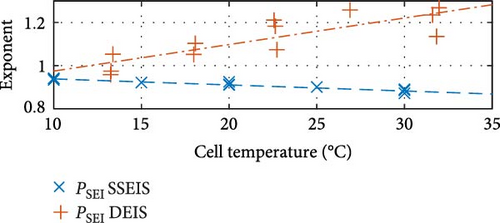
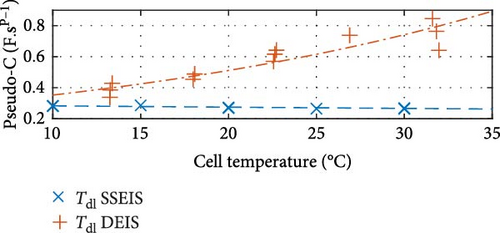
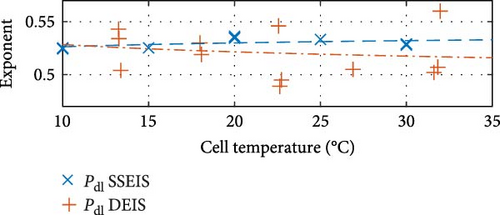
Similarly, between the temperature limits of 10 to 30°C, the pseudo-capacitance (TSEI and Tdl) values exponentially, as shown in Figure 8c,f, and the exponent value (PSEI), shown in Figure 8d, linearly, decrease with increasing temperatures by 35.6%, 5.8%, and 6.0%, respectively. In contrast, the CPEdl exponent (Pdl) results in Figure 8g illustrate a steady linear increase with increasing temperatures of 1.1%. Furthermore, the pseudo-capacitance value of CPESEI (TSEI) drops more prominently compared to CPEdl (Tdl), which does not vary as much with temperature.
These trends show that the pseudo-capacitance of the SEI arc (TSEI) and the resistances of the SEI (RSEI) and Rct sections are the most sensitive to temperature changes and suggest that they are the dominant factors regarding how cell properties are affected by temperature. These trends are consistent with previous findings by Fly et al. [38], further validating the SSEIS parameter fitting results at different ambient temperatures.
Regarding the DEIS data between 91% and 100% SOC, examining all the graphs in Figure 8 reveals notable distinctions from the SSEIS outcomes. While specific trends may exhibit similarities, they often shift in terms of location. In several instances, the DEIS trends diverge markedly from their SSEIS counterparts, and these differences will be reflected upon. Consequently, these findings underscore that DEIS testing yields outcomes distinct from SSEIS’s.
To quantify the variations observed in DEIS data between 10 and 30°C, as illustrated in Figure 8a,b, it was noticed that the induction and Rohm trends experience a notable shift in their trendline. From min to max temperature, there is a surprising logarithmic drop of 40.7% in the induction value and an unexpected exponential increase in the Rohm value of 3.2% as the temperature rises. These trends contrast with those observed in SSEIS data. For the drop in induction, which is suspected to come from the wires connected to the battery, these wires may exhibit changes in material properties, such as conductivity and resistivity, due to thermal expansion as temperature increases from the battery actively charging as opposed to the battery staying at the same temperature as it does during SSEIS. Theoretically, this could result in a shift in the impedance response, decreasing the observed inductive effects.
For Rohm with temperature, while Huang et al. [49] and An et al. [30] state that there is no to a slight change of Rohm with temperature during DEIS charging, here the increase is suggested to come from electrolyte conductivity changes, whereby the logarithmic increase in resistance with temperature, despite typically expecting a decrease in resistance with increased temperature due to enhanced ionic mobility, advocates changes in the electrolyte’s composition or interactions within the cell that negatively affect conductivity more than anticipated. This change could derive from stress-induced microstructural modifications with the dynamic testing conditions, possibly inducing mechanical stresses within the electrode materials, leading to microstructural changes such as crack formation or particle isolation that could increase the Rohm more significantly than static conditions would suggest [50, 51].
Further contrasting trends emerge in the CPESEI exponent (PSEI), CPEdl pseudo-capacitance (Tdl), and CPEdl exponent (Pdl) graphs, displayed in Figure 8d,f,g. These trends correspond to the DEIS data’s response to temperature variations between 10 and 30°C, showing a linear 25.2% and exponential 110.4% increase in PSEI and Tdl and a linear 2.1% decrease in Pdl with rising temperature.
For the CPESEI exponent, PSEI, the temperature increase indicates the SEI’s homogeneity. A linear increase in PSEI with temperature suggests that the SEI becomes more uniform with rising temperature [52]. This improved uniformity could be due to enhanced mobility of electrolyte ions and more uniform SEI layer formation or repair mechanisms facilitated by increased temperature, leading to more homogenous charge distribution and interfacial properties [53]. For the CPEdl pseudo-capacitance, Tdl, an exponential increase in temperature may reflect enhanced electrochemical activity and ion adsorption at the electrode surfaces due to increased electrolyte ion mobility and electrode surface interactions [54]. This exponential behaviour indicates that the effect of temperature on double-layer capacitance is not merely linear but accelerates with temperature, potentially due to more active surface sites and improved ion adsorption kinetics [55]. Lastly, the CPEdl exponent, Pdl, provides information about the roughness and heterogeneity of the electrode surface and the distribution of relaxation times [56]. A linear decrease in Pdl with rising temperature could indicate a slight increase in the heterogeneity of the electrochemical processes or changes in the surface roughness at the electrode–electrolyte interface [57]. This change in the surface roughness might be due to temperature-induced changes in the electrolyte composition or morphology of the electrode surfaces, leading to a more complex electrochemical response.
The observed novel trends with temperature in the DEIS data are attributed to the dynamic interplay of temperature effects on electrochemical kinetics, ion mobility, interface formation, and material properties within the battery. Temperature not only influences the intrinsic properties of the battery materials but also affects the interfacial reactions and the formation/maintenance of the SEI layer. These changes are more pronounced in dynamic conditions, as captured by DEIS, where the dynamic behaviour allows for observation of active processes that might not be evident in steady-state measurements. This dynamic activity has led to unexpected impedance spectra or non-idealities in the system, including unusual CPE pseudo-capacitance, exponent values, and differing trends. Furthermore, it highlights the method’s sensitivity to detecting subtle variations in battery behaviour under operational temperature variations.
The only graphs maintaining the same trend are shown in Figure 8c,e,h, corresponding to CPESEI pseudo-capacitance (TSEI), RSEI, and Rct, revealing an exponential 66.0%, 84.1%, and 60.9% drop, respectively, with increasing temperature. Only these three properties maintain consistently similar trendlines between SSEIS and DEIS out of the eight total properties investigated. This underscores the disparities introduced by DEIS. However, it is seen that DEIS predicts similar overall values to SSEIS, and the two are generally close, even if the trends are different. This difference, though, emphasises the need for further testing to comprehensively quantify the combined effects of temperature and SOC on ECM properties during DEIS active charging.
Having established the temperature-dependent 100% SOC relationships for the parameters, these trends were incorporated into the ECM for the steady-state case, as illustrated in Figure 9. The impedance equation for frequency is defined in Equation (2), which was derived from fundamental equations [23]. By incorporating the corresponding trend equations for each parameter, a wide-ranging model that accounts for the influence of temperature on the cell’s impedance behaviour has been obtained.

In the ECM equation, Zcircuit SSEIS symbolises the total impedance, with the notation Z1+2+3 outlining the segmentation of impedance within the ECM schematic. Furthermore, j signifies the unit of imaginary impedance, and ω (omega) corresponds to the circuit’s angular frequency, influenced by an applied AC signal.
Consequently, this model enables us to interpolate cell impedance curve data within the temperature range of 10°C to 30°C, assuming the cell is at 100% SOC and OCV following a complete charge. While this serves as a valuable starting point, further insight through investigating the DEIS results is discussed in the next section and sheds light on how impedance curves are influenced by dynamically changing temperature and SOC.
4.2. DEIS
4.2.1. Battery Active Charging Impedance With Temperature and SOC Model (ACBEM)
In the analysis of the DEIS data, impedance curves were taken from six of the total pool of 46 conditions, as shown in Figure 10. The purpose was to examine the impact of the cell SOC on the cell’s impedance curve at the same temperature. The impedance results have been categorised into three graphs, representing temperature groups of 22.3, 22.6, and 24.3°C (rounded to the nearest decimal place). Each graph consists of two curves representing lower and higher SOC values.
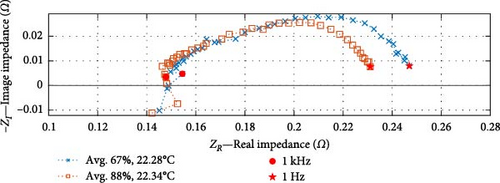
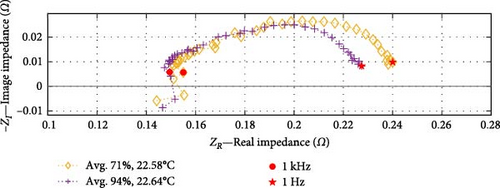
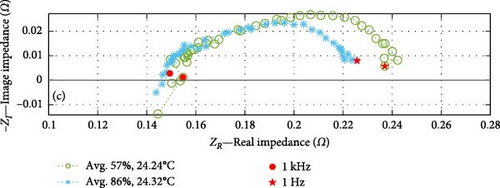
Based on the SOC conditions selected, Figure 10a shows a 21% increase in SOC, from 67% to 88%; Figure 10b indicates a 23% SOC increase within the range of 71%–94%, while Figure 10c shows a 29% SOC rise from 57% to 86%. The consistent trends observed in the datasets at corresponding temperatures indicate that impedance experiences a decrease as the SOC increases, particularly within the charge transfer sections. Section 4.2.2 investigates whether the dominant factor contributing to this effect is the CPEdl or Rct parameter. Notably, these results focus on SOC values ranging from a minimum of 57% to a maximum of 94%, and different SOC trends may emerge below or above this range.
A higher minimum frequency during the probe sweep needed to be selected to prevent excessively long impedance steps during DEIS testing. This necessitated the exclusion of the Warburg tail in the charge transfer section, resulting in a different ECM and model for DEIS, as shown in Figure 11. The impedance equation, relating to frequency, is defined by Equation (3) [23]. This model allows for a wide representation of the impedance behaviour during active charging.

Regarding cell temperature during probing frequency, Figure 12 shows relative temperature stability throughout the probing frequency range, regardless of the environmental chamber starting temperature or SOC. The temperature remains relatively consistent and linear across the broad probing frequency spectrum (from 104 to 101 Hz), with only minimal fluctuations seen across different cell temperatures and SOCs. For the various impedance steps selected in Figure 12a, the cell temperature remains stable and linear with the sweeping probing frequency, with the max change in step temperature from start to end of 0.27°C and the minimum change of 0.06°C.
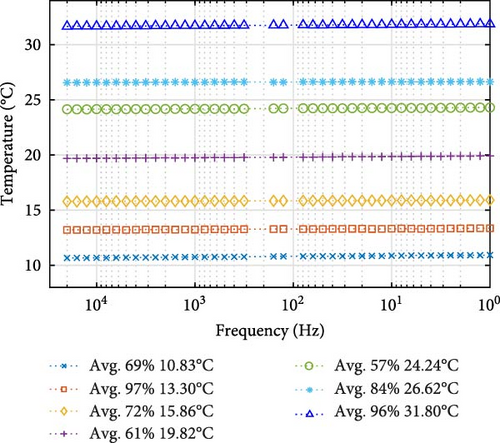
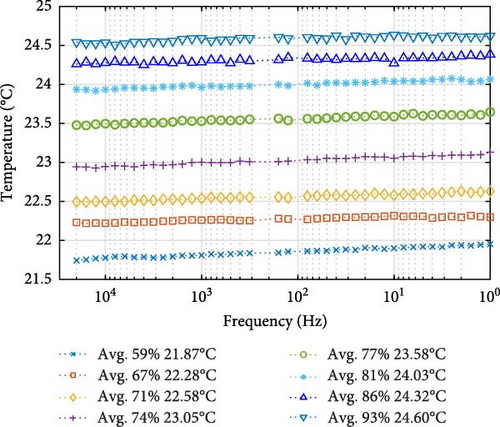
However, for the 22.5°C ambient temperature group in Figure 12b, the temperature from start to end ranges from 21.74 to 24.62°C in the group, with an average step spacing between impedance steps of 0.39°C. Interestingly, at lower and mid-point SOCs, particularly between 59% and 67%, and 74% and 77% SOC, the temperature gradient shows a steeper increase, with spacing between steps of 0.42°C and 0.53°C, respectively. However, just between the third and fourth steps and as SOC increases toward the higher range, the temperature differences between probe steps diminished, with a gap of just 0.29°C observed between 67% and 71% SOC and a gap of just 0.27°C between 86% and 93% SOC. This spacing suggests that internal heating is most pronounced during charging at the beginning and mid-SOC range, gradually tapering off after the start, increasing again around the midpoint, and then diminishing toward the end.
Subsequently, following the linear cell temperature data, seven impedance curves that are sufficiently spaced from one another have been selected to demonstrate the fidelity of the fitted “ACBEM,” as shown in Figure 13a; note that individual DEIS results are shown in the Supporting Information in Figure S2–S7. The legend provides information on cell temperatures and SOC, with environmental ambient temperatures ranging from 10°C to 30°C and SOC values between 50% and 100% while charging the cell.
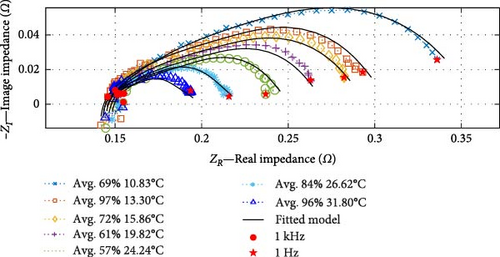
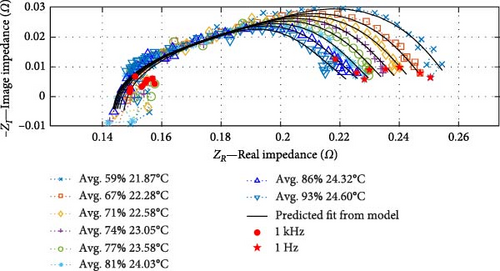
These results illustrate that, similar to SSEIS, substantial changes are discernible in EIS measurements in response to changes in temperature. As cell temperature rises, impedance notably decreases, primarily within the mid-frequency range. However, the SOC also plays a role in further decreasing the impedance in the charge transfer arc as the SOC levels rise. This finding demonstrates a complex interplay between cell temperature and SOC and their combined effect on impedance. These aspects are explored later in Section 4.2.2, and the temperature-SOC contour plots are shown in Figure 14.
The accuracy of the fitted ACBEM is illustrated in Figure 13a. The model closely aligns with the impedance data, with the real impedance exhibiting an average R2 value of 0.9975 (ranging from a maximum of 0.9996 to a minimum of 0.9906) and the imaginary impedance showing an average R2 value of 0.9380 (ranging from a maximum of 0.9892 to a minimum of 0.7979) in its correspondence with the experimental data. This robust performance confirms the model’s effectiveness. To verify its accuracy and capabilities, the entire dataset collected at an ambient temperature of 22.5°C, not included in the model fitting process, is presented in Figure 13b. This dataset also demonstrates a strong predictive capacity, with the average R2 value for real impedance at 0.9975 (ranging from a maximum of 0.9992 to a minimum of 0.9958) and for imaginary impedance at 0.9247 (ranging from a maximum of 0.9612 to a minimum of 0.8068). Consequently, this enables interpolating battery impedance curve data across the temperature range while charging at a 450 mA rate. This dataset holds significant value as it represents the first instance of combining temperature and SOC parameters for DEIS analysis.
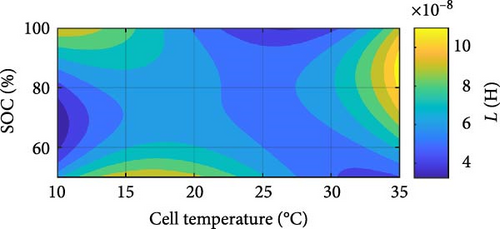
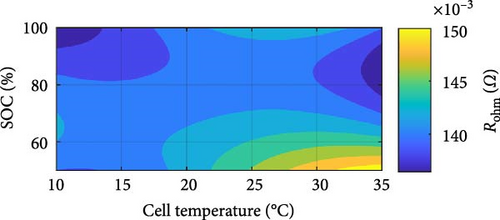
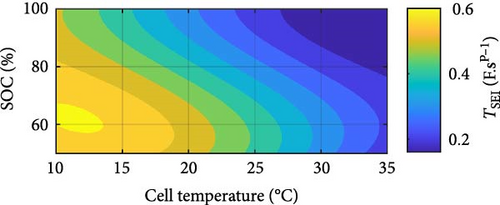
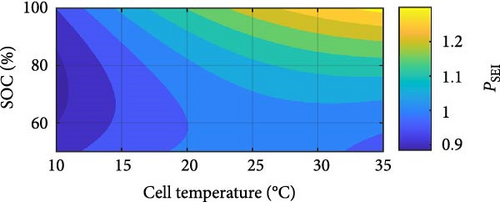
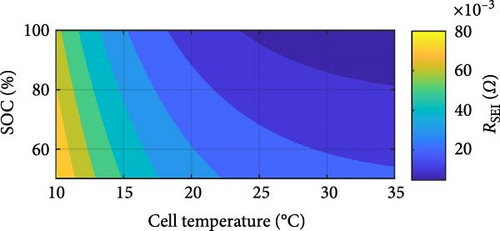
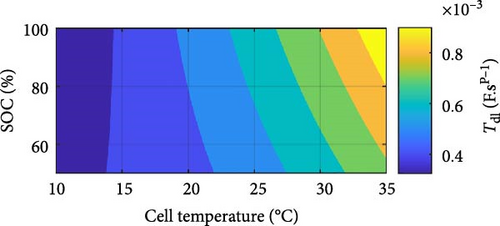
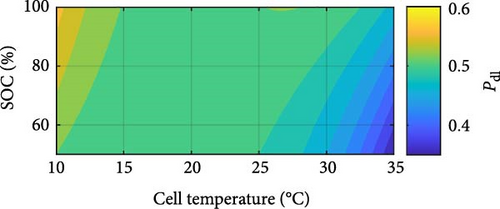
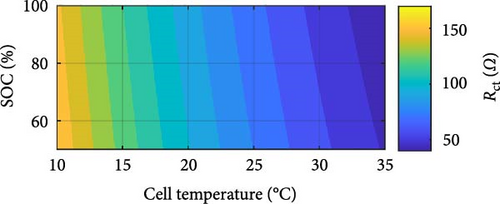
Similar battery ECM parameters graphs, as shown in Figure 8 for the SSEIS section, have been generated for DEIS in Figure 14. From this, parameters have been combined to create contour maps for each cell parameter, providing a comprehensive analysis of the combined influence of temperature and SOC on the cell’s impedance behaviour while it is actively charging.
While current research presented in this paper on the ACBEM predominantly centres on charging processes, it is worth acknowledging the potential for extending this methodology to encompass the discharging process. Developing a separate “active discharge battery equivalent circuit model (ADBEM)” capable of faithfully capturing battery behaviour during discharge cycles is feasible through meticulous analysis of discharging data and applying similar modelling techniques.
However, it is important to recognise the inherent challenges associated with modelling discharging scenarios. Unlike charging, where input current and operating temperature can be more readily controlled in a stationary vehicle charging environment, discharging in real-world EVs involves variable current draw and fluctuating temperatures influenced by dynamic driving conditions. This variability introduces complexities that can pose challenges in accurately modelling discharging behaviour experimentally.
This study investigates the charging process under controlled temperature and SOC conditions under comparable stationary vehicle charging. This analysis is motivated by the need for high vehicle charging rates, where temperature regulation relies on the vehicle’s cooling system. Establishing the analogous relationship for discharging will be explored in future research endeavours.
4.2.2. DEIS for Battery Equivalent Circuit Parameters With Temperature and SOC
The DEIS analysis of battery ECM parameters reveals several intriguing trends. Examining the resistance-focused graphs in Figure 14e,h, it is evident that both RSEI and Rct decrease exponentially with increasing temperature, while their response to increasing SOC is more nuanced, with RSEI decreasing slightly linearly and Rct decreasing with a power–law relationship. To provide a more precise illustration of these patterns, Figure 15 utilises Rct as a case study. Figure 15a,b demonstrate the exponential decrease and power–law decline corresponding to temperature and SOC, respectively.
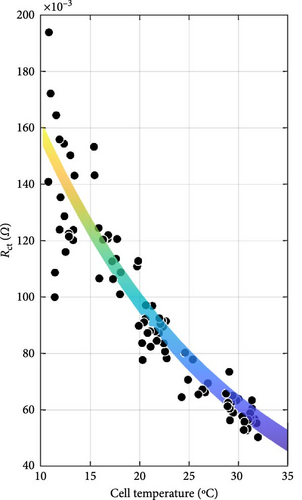
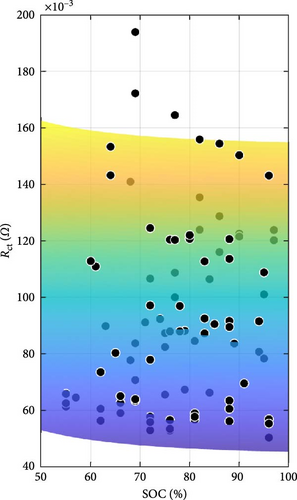
With regard to temperature, as the temperature rises, the mobility of ions within the electrolyte and at the electrode–electrolyte interfaces is expected to increase. This enhanced ion mobility facilitates faster ion diffusion through the SEI layer and promotes more rapid charge transfer kinetics at the electrode surfaces. Consequently, the resistance associated with ion transport through the SEI layer, RSEI, and the Rct, decreases exponentially with increasing temperature [58]. As for SOC, at higher SOC levels, the concentration gradient of ions within the electrolyte may become more pronounced, promoting faster ion diffusion through the SEI layer and reducing its resistance [59]. Additionally, changes in the electrolyte’s conductivity with SOC and spatial distribution of intercalated lithium within any given solid particle and throughout the thickness of each porous electrode could influence the overall impedance response, contributing to the observed decreasing trends in RSEI and Rct with increasing SOC during DEIS [18, 60, 61]. Furthermore, the paper by Huang, Li, and Zhang [19] shows that for Rct with DEIS charge, the Rct value between 50% and 100% SOC will decrease in a similar power-law trend with increasing SOC, similarly lining up with the findings in this paper.
In Figure 14b, which represents Rohm, it is seen that increasing SOC reduces resistance in a power–law manner, as others report for SSEIS [32, 37]. However, like the results in Section 4.1.2, an unexpected trend emerges with temperature, where a slight logarithmic increase in resistance is observed at higher temperatures. While Section 4.1.2 suggests this phenomenon derives from stress-induced microstructural modifications with dynamic testing, cell ageing is also worth considering. However, the extent of the increase in Rohm—averaging 2.51% between 10 and 30°C over a relatively short span of 20 test cycles—surpasses the expected ageing-related increase based on existing literature, Fly et al. [38], which predicts only a 0.38% increase after 42 cycles under similar conditions.
This discrepancy suggests that additional mechanisms beyond conventional cell ageing influence resistance. Furthermore, with DEIS at lower SOC, this increase in resistance is more noticeable. Considering SOC as well in the context of DEIS, this unexpected rise in Rohm could stem from the electrode physical properties of the SEI film, such as porosity and SEI thickness. The dynamic fluctuations in SOC could potentially influence ion pathways within the electrode, particularly if the electrode materials undergo volume alterations or if the electrode/electrolyte interface changes during cycling [62]. This change could lead to less efficient ion transport pathways, thus increasing resistance. However, it is notable that higher charging temperatures correspond to decreased resistance during the active test within each temperature group, e.g., (10, 15, 20, 25, 30°C).
Turning to CPE SEI pseudo-capacitance, Figure 14c demonstrates that TSEI decreases exponentially with rising temperature and decreases linearly with increasing SOC, which both show similar trends to SSEIS [37]. The exponential decrease of TSEI with rising temperature could stem from elevated temperatures accelerating internal degradation processes at the SEI layer, which leads to reduced pseudo-capacitance due to decreased conductivity of the graphite agglomerate [63, 64]. However, it is important to note that this decrease in pseudo-capacitance may be countered by an improvement in ion mobility resulting from the reduction of RSEI with increasing temperature, indicating an intricate balance between degradation processes and enhanced mobility within the battery system. As for the linear decline in TSEI with increasing SOC, the pseudo-capacitive behaviour associated with the SEI diminishes as the battery becomes more charged. This diminishment could be due to changes in the SEI layer’s composition and structure, making a more porous outer SEI and thus degradation as SOC increases, altering its capacitive properties [65, 66]. When the temperature and SOC data are combined, it is noteworthy that the decline of TSEI with temperature is more pronounced at lower SOC levels, suggesting a greater sensitivity of SEI pseudo-capacitance to temperature variations under these conditions.
Conversely, Figure 14f illustrates that the CPE double-layer pseudo-capacitance, Tdl, increases exponentially with increasing temperature and SOC, where with temperature, this relationship differs from SSEIS and aligns with SSEIS with SOC [37]. This pseudo-capacitance trend is more intricate in DEIS than SSEIS, owing to the cell’s active charging and the interplay between temperature and SOC, with Tdl likely reflecting enhanced electrochemical activity at the electrode–electrolyte interface and electrolyte gap under these conditions [67]. Higher temperatures promote faster charge transfer kinetics and ion diffusion, while higher SOC levels provide more active sites for ion adsorption, leading to increased double-layer capacitance [68].
In Figure 14d, the CPE SEI exponent component PSEI exhibits a linear increase with temperature and an exponential increase with rising SOC. The linear increase of PSEI with temperature suggests an enhancement in the homogeneity and stability of the SEI layer. Temperature elevation can improve ions’ mobility and diffusion rates within the electrolyte, forming a more uniform SEI layer [69]. Higher temperatures can facilitate more consistent electrochemical reactions across the SEI layer, reducing inhomogeneities and resulting in a higher PSEI value, indicative of a closer approach to ideal capacitive behaviour. The exponential increase of PSEI with SOC can be explained by the changing nature of the SEI layer and electrode–electrolyte interactions as the battery charges. As SOC increases, the electrochemical environment within the battery changes significantly, leading to alterations in the SEI layer’s structure and properties. These changes include forming new components within the SEI layer or modifying its thickness and conductivity [70]. The exponential trend suggests that as the battery becomes more charged, these modifications dramatically enhance the uniformity and efficiency of the SEI layer’s capacitive properties. This trend could be due to the accelerated formation of a more homogeneous SEI layer at higher charge levels, which better accommodates the movement and distribution of ions.
In Figure 14g, the CPE double-layer exponent Pdl follows a logarithmic decrease with increasing temperature and a marginal exponential increase with rising SOC. Similar to PSEI, the exponential increase, even if marginal, as SOC increases, the nature of the double layer at the electrode–electrolyte interface is suggested to become more consistent due to the more extensive intercalation of lithium ions as SOC rises, with the interface becoming increasingly homogeneous, and the relaxation times becoming more uniform [71]. This Pdl increase thus indicates a progressive reduction in heterogeneity and a smoother electrochemical response with increasing SOC. However, the logarithmic decrease of Pdl with increasing temperature, on the other hand, suggests changes in the surface roughness and heterogeneity of the electrode–electrolyte interface. As temperature rises, the morphology and structure of the electrode surface may undergo modifications, impacting the distribution of active sites and the surface area available for electrochemical reactions, indicating a complex but growing heterogeneity for the double layer in how ions interact with the electrode surface, resulting in a decrease in Pdl [72]. Additionally, it is noteworthy that changing SOC only between the outermost temperatures of 10–15 and 20–30°C has a notable effect on the Pdl value. These results illustrate the complex relationship between DEIS measurements’ temperature, SOC, and exponent parameters.
Lastly, in Figure 14a, the induction value shows no strong correlation between temperature and SOC. However, a subtle trend suggests that the induction value decreases logarithmically with increasing temperature and experiences a minimal exponential increase with rising SOC. However, its behaviour is more dependent on specific test conditions.
In summary, the DEIS results unveil complex and nuanced relationships between ECM parameters, temperature, and SOC, highlighting insight into the new trends that simultaneous temperature and SOC changes have on active charging as well as the need for further investigation to explore the how these properties may change during different charge rates. Thus, these findings contribute significantly to our understanding of battery behaviour during dynamic charging and offer valuable knowledge for monitoring battery performance in practical applications, such as fast charging for EVs or energy grid storage. Ultimately, this research adds to advancing the field of battery cell technology, permitting the optimisation of battery designs and enabling the development of more efficient and reliable energy storage solutions.
While this study establishes a basis for evaluating changes and enhancements in charging procedures, it acknowledges its limitations and outlines prospects for further investigation.
Besides the SOC and temperature effects considered while evaluating battery impedance in this study, EIS has considerable potential in estimating a battery’s state of health (SOH). As batteries degrade, changes in parameters such as Rct and SEI layer characteristics are reflected in impedance spectrum shifts in the curve. In particular, these changes can indicate a battery’s ageing process for the low-frequency domain where diffusion dominates. Since EIS is a non-invasive technique that can follow the progressive development of impedance and resistance over time, its potential for SOH monitoring is very high. Recent works have supported this, and some have shown that ECMs can estimate SOHs using frequency domain analysis. These parameters include RSEI and Cdl, which are notably related to battery health indicators [73, 74]. Furthermore, combining traditional ECM-based approaches with data-driven techniques such as machine learning can improve SOH estimation precision and permit real-time health assessment in operation [75, 76]. Future work may be directed to DEIS investigation for real-time SOH evaluation during fast charging cycles, thus providing a route toward incorporating the SOH monitoring capability into a battery management system (BMS) for EVs and other applications.
In addition to traditional EIS methods, it is also interesting to consider the roles played by power converters, especially non-isolated DC–DC power converters for EIS, that enable the more practical implementation of spectroscopy, especially for in situ applications [77]. Some applications can take advantage of specific frequency features inherent to power converters to perform online impedance measurements (online refers to the real-time monitoring of a battery’s electrochemical properties, typically using EIS, without interrupting its operation). A notable example is wireless charging systems that exploit the switching frequencies of power converters to integrate online battery spectroscopy. Locorotondo et al. [78] prove that a wireless charging system can be designed to perform real-time impedance analysis during battery operation, thus enabling continuous insight into the battery state without interruptions of the charging processes. In this regard, such an approach not only optimises the use of EIS in practical applications but also underlines how converter frequency modulation can further improve the real-time monitoring capability of EIS for SOH and performance evaluation during charging.
Moreover, research endeavours should also delve into the practical implementation of charging enhancement techniques, like ultrasound charging, on commercial 450 mAh LCO/graphite cells during DEIS, employing the ACBEM for assessing the impact of these techniques on battery impedance and properties. Expanding the study’s temperature and SOC range from 0 to 40°C and extending DEIS data collection from 0% to 100% SOC could also provide a more comprehensive understanding. In future research, exploring the influence of different charge rates, from slow charging at 0.5C to XFC at 6C, could reveal valuable insights into their effects on results.
Additionally, diversifying the research to include various cell chemistries, such as NCM and LFP, is recommended. While this study deals only with one type of Li-ion cell of the LCO type, EIS and DEIS techniques widely apply to different battery types since they are based on the same electrochemical processes across diverse chemistries. However, the differences within the respective families of battery chemistries in their impedance characteristics differ from chemistry to chemistry. For instance, Rct, SEI behaviour, and diffusional processes differ due to ion mobility and material composition. For example, LFP batteries exhibit extremely stable thermal behaviour and are thus likely to exhibit different SEI degradation behaviours than LCO cells when subjected to the same conditions [79, 80]. Future research could apply the models developed in this study to these chemistries, incorporating the specific impedance behaviours of each chemistry to refine predictions related to SOC, SOH, and temperature impacts. This broader exploration of chemistry will further contribute to our understanding of impedance properties across a range of battery types. Addressing these points and pursuing these research directions promises to advance our understanding of cell behaviour and performance across various operating conditions and charging methods.
5. Conclusions
This paper is the first to use DEIS to explore how both cell temperature and SOC affect battery performance while charging, with the results and findings being novel. The study examines the impact of diverse charging protocols on battery cell properties and impedance, introducing a unique comparative analysis of SSEIS and DEIS results. This developed method illuminates the parameters with operating temperature on the equivalent circuit fitting when fully charged and the combined effects of SOC and operating temperature when actively charging, offering informative insights into new trends and the impact of simultaneous SOC and temperature changes on dynamic battery usage.
This study has comprehensively examined battery impedance spectra and ECMs, showing cell impedance properties in SSEIS and DEIS cases, with a novel comparison of where battery parameter trends with temperature agree and disagree between the two impedance methods. Furthermore, developing the “FCBEM” and the “ACBEM” has been demonstrated as a valuable approach for future research. These developments are based on existing models but refine these frameworks by incorporating modifications that accurately account for the intertwined influence of temperature and SOC impact on battery cell impedance.
The FCBEM was constructed based on SSEIS data, allowing for the analysis of ECM parameters, such as the resistance and capacitance for the SEI layer, battery double layer, and charge transfer sections, under different ambient temperatures. The ACBEM, alternatively, has incorporated combined SOC and temperature variation effects during DEIS, resulting in a new model for active charging impedance. Both models accurately fit the impedance data, enabling interpolating battery cell impedance curves within specific temperature and SOC ranges.
The analysis focused on a specific commercial 450 mAh LCO/graphite polymer pouch cell. However, it is essential to note that the same protocols used in this study can be applied to other Li-ion chemistries. To foster further research and promote a collaborative spirit, the data used in this study is openly accessible, inviting all interested parties to contribute to our collective understanding of the SOC and temperature sensitivity of cell parameters derived from EIS, whether from steady-state or CC charging.
- 1.
Temperature Influence on Resistance and Capacitance: The exponential decrease in RSEI and Rct with rising temperature enhances ion mobility and facilitates faster ion diffusion and charge transfer kinetics, improving battery performance.
- 2.
Impact of SOC on Electrochemical Properties: The nuanced response of RSEI and Rct to increasing SOC highlights the complexity of Li-ion battery behaviour as it becomes more charged. The findings suggest that higher SOC levels promote faster ion diffusion, possibly due to a more pronounced concentration gradient and alterations in the electrolyte’s conductivity and the spatial distribution of lithium ions within the electrode structure.
- 3.
Dynamic Changes in SEI and Double-Layer Capacitance: The exponential decrease in SEI pseudo-capacitance (TSEI) with temperature and linear decrease with SOC suggest temperature-accelerated degradation processes. In contrast, the exponential increase in double-layer pseudo-capacitance (Tdl) indicates enhanced electrochemical activity.
- 4.
Homogeneity and Stability of the SEI Layer: The linear increase in SEI exponent (PSEI) with temperature and exponential increase with SOC signify improvements in SEI layer homogeneity and stability, leading to more efficient capacitive behaviour.
- 5.
Electrode-Electrolyte Interface Dynamics: Changes in the double-layer exponent (Pdl) reflect the interplay between surface roughness, electrode morphology, and ion distribution. Trends suggest decreasing electrode surface homogeneity with temperature and progressive growth in homogeneity with SOC, which influences battery performance.
These findings contribute to our broader understanding of battery performance and have significant practical implications. They pave the way for advancements in battery characterisation and monitoring techniques. They provide a practical basis for subsequent research to investigate further variables impacting impedance properties and to develop more sophisticated models for accurate impedance prediction in varying operating conditions. This work is instrumental in facilitating battery health assessment by anticipating changes in resistance and capacitance values, thereby ensuring battery cells’ longevity and optimal performance.
Conflicts of Interest
The authors declare no conflicts of interest.
Funding
This research was supported by Ricardo PLC open access funding enabled and organized by JISC GOLD.
Acknowledgments
The authors would like to acknowledge the permissions given by Carlos Pastor-Fernández for the modified ECM and EIS diagram.
Supporting Information
Additional supporting information can be found online in the Supporting Information section.
Open Research
Data Availability Statement
The data that support the findings of this study are available from the corresponding author upon reasonable request.


