DNA Barcoding of Nematode Parasites Infecting Ompok bimaculatus and Nemacheilus anguilla From Barvi Reservoir, Maharashtra
Abstract
In the present study, the DNA barcoding of the nematode parasite infecting Ompok bimaculatus and Nemacheilus anguilla fish species was carried out in Barvi Reservoir, Maharashtra. To ascertain the taxonomic status of these nematode parasites, an 18S gene marker was used. Accurate identification of fish parasites is essential to formulate preventive strategies and to study host–environment relations. The present study did barcoding of the nematode parasites of the fishes caught from the Barvi Reservoir using the nuclear 18S rDNA (SSU) sequence. The nuclear 18S rDNA (SSU) was amplified into two overlapping amplicons and sequenced to identify the species based on the sequence similarity with the NCBI GenBank database. The present study sequences (both fragments) showed 98% similarity with the species of Eustrongylides. The average genetic distance value between the present study sample and species of Eustrongylides was 0.003. In the phylogenetic tree also, the sequence was clustered with the species of Eustrongylides with significant bootstrap values. The present study identified the nematode parasite of the fish caught from the Barvi Reservoir, as species of Eustrongylides. The species-level identification could not be possible due to the insufficient/lack of reference sequences in the database. It indicates the knowledge gap concerning the species-specific molecular markers for nematode parasites of the fish.
1. Introduction
As parasitism is the most common lifestyle on the planet, understanding its role in the environment may help to assess changes in a given host population [1]. Fish serve as hosts to a range of taxonomically diverse parasites and exhibit various life cycle strategies [2]. Parasitic infections are prevalent in wild populations from diverse environmental conditions. Under natural conditions in the wild population, these parasites may cause serious diseases. Nematodes are one of the important parasites that infect fish species of all ecosystems, including freshwater, brackish water, and marine water [3]. These parasites can compromise the immunity of the fish and make them susceptible to secondary infection by other pathogens. It could lead to fish mortality and economic loss to the fish farmers. Sometimes, the survived fish with a heavy load of endo-parasites is not preferable to consumers. Some of the parasites have a zoonotic potential and could infect humans also. Though small numbers of nematode parasites occur in healthy fish, high numbers of nematodes can cause illness or even death. Just like humans and other animals, fish experience diseases and parasites. Fish have both specific and nonspecific defenses against these threats. Nonspecific defenses encompass the skin, scales, and the mucus layer produced by the epidermis, which traps and hinders the growth of microorganisms. Should pathogens penetrate these defenses, fish can trigger inflammatory responses. These responses entail heightened blood flow to infected sites, facilitating the arrival of white blood cells tasked with combating the pathogens.
Parasites are frequently found in fish populations as a natural phenomenon. They can offer insights into the ecology of host populations. For instance, in the field of fisheries biology, the composition of parasite communities can serve as a tool to differentiate between separate populations of the same fish species dwelling in a shared region [4]. There are various types of nematode species, and many of them can travel throughout a fish’s body and infect the liver, kidneys, and other vital organs that are important for fish. Thus, accurate identification of species is essential to trace its trajectory in different hosts and to use appropriate drugs [5]. Further, species delimitation is necessary to study the co-evolution of the host and parasite. However, the taxonomy of nematode parasites is incomplete due to phenotypic plasticity and morphological similarity [6, 7].
Recently, bottom-dweller fishes (Ompok bimaculatus and Nemacheilus anguilla) from the Barvi Dam, Badlapur, Thane, Maharashtra, India, have been heavily infected with nematode parasites, and the catch was discarded due to the infestation. The morphological characteristics of the parasite are ambiguous and unable to identify the parasite up to the species level. DNA markers such as mitochondrial cytochrome c oxidase subunit I (COI), nuclear 18S rRNA, and internal transcribed spacer (ITS) sequences have been used to identify the nematode parasites from fish and study their phylogeny [8, 9].
2. Materials and Methods
2.1. Study Area and Sampling
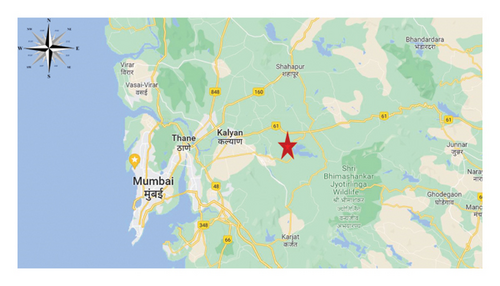
The study samples were collected from the Barvi Reservoir (19°11′N, 73°20′E), located on the river Barvi, Badlapur, Thane, Mumbai, Maharashtra (Figure 1). During the monsoon months of the year 2021, selected fishes (O. bimaculatus and N. anguilla) of the Barvi Reservoir were infected with the nematode parasites. A total of 30 parasites (15 each from O. bimaculatus and N. anguilla fish species) were collected aseptically from the coelomic (body) cavity and internal organs, and near the intestine. The average length of the parasite was ∼6 cm. The nematode parasites were preserved in absolute alcohol for further molecular work.
2.2. DNA Extractions
The DNA was extracted from nematode samples using the phenol–chloroform method [10]. The quantity of DNA was checked using a Nanodrop microvolume spectrophotometer (Thermo Fisher Scientific, USA), and the purity was estimated using the ratio of A260/A280.
2.3. Amplification of Nuclear 18S Ribosomal RNA Gene
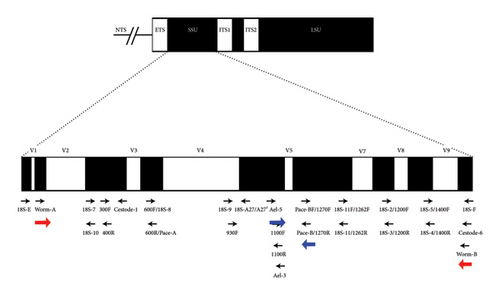
The nuclear small subunit ribosomal ribonucleic acid (18S rRNA) has been amplified using the primers reported by Littlewood, Timothy, and Olson [11]. Initially, the complete gene (∼1800 bp) was amplified using the primers, Worm A and Worm B. Later, for sequencing purposes, the gene was amplified into two overlapping amplicons of 1100 and 750 bp using the nested primers Worm A and 1270 R and Worm B and 1100 F, respectively. The schematic diagram of the primer location is given in (Figure 2).
The PCR was set up in a 12.5-μL reaction volume consisting of 100 ng of template DNA, 10 pmol of forward and reverse primers; 250 μM dNTPs (10 mM stock), I unit Taq polymerase, 1.25 μL of 10× buffer, and distilled water. The PCR conditions for the complete gene (with primer sets Worm A and Worm b) amplification were set as initial denaturation at 94°C for 2 min, followed by denaturation at 94°C for 30 s, annealing at 54°C for 30 s, and extension at 72°C for 2 min with a final extension of 72°C for 10 min.
A nested PCR was performed to amplify the gene into two overlapping fragments of small size (Worm A and 1270R; Worm B and 1100F). A gradient PCR with different annealing temperatures (43°C–56°C) was set up to standardize the PCR.
2.4. Purification and Sequencing of the Amplicons
After resolution, the PCR products were excised from the gel and purified using a Gel Extraction Kit (Thermo Fisher Scientific) followed by the manufacturer’s protocol. The fragments were sequenced commercially (Eurofins, Bangalore) using the primers in both forward and reverse directions.
2.5. Bioinformatics Analysis
The quality of the sequence was verified using FinchTV software by observing the Phred score (Q-value) of each base, and the uniformity of the peaks in the chromatogram. The end sequences with low Q—values were trimmed, and the resultant sequences were subjected to the NCBI Basic Local Alignment Search Tool (BLAST) analysis using the program BLAST (https://www.ncbi.nlm.nih.gov/blast). After identifying the species, a dataset of closely related species was prepared by downloading the reported sequences. The sequences were aligned to their homologous positions using the MEGAXI, and the genetic distance values were estimated using the Kimura two-parameter model. The frequency of nucleotide, variable, conserved, and parsimony informative sites was estimated using the MEGAXI. The best evolutionary model for the sequence set was assessed using the jModel test. The phylogenetic tree was reconstructed using the maximum parsimony, maximum likelihood, and Bayesian inference methods.
3. Results
3.1. Morphological Observation of Parasite
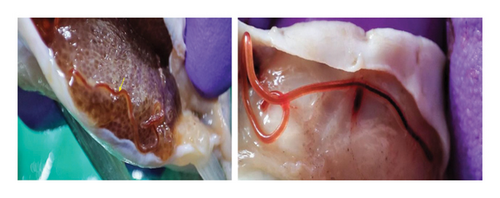
The parasites were harboring in the coelomic cavity and also adjacent to the gut of the fish and the average number of parasites ranged from 10 to 20 larvae per fish. The average length of the parasite was ∼6 cm (Figure 3).
3.2. Quality and Quantity of Genomic DNA
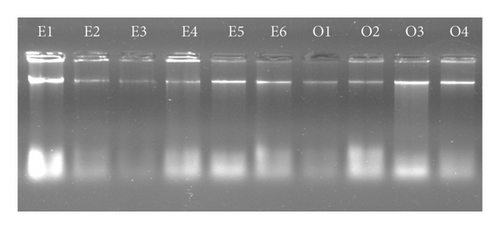
The total genomic DNA of the nematode parasites was isolated using the phenol–chloroform method. The quality and quantity of the DNA was verified by the gel electrophoresis and spectrophotometer (Figure 4). The quantity of DNA was varied from 300 to 700 ng/μL across the samples.
3.3. PCR Amplification of 18S rRNA
The complete gene of 18S rRNA (∼1800 bp) isolated from N. anguilla (Figure 5(a)) and O. bimaculatus (Figure 5(b)) was amplified using the primers Worm A and Worm B resulted in the amplification of the 18S rRNA with a fragment size of ∼1800 bp. Out of 30 samples, good amplification was observed in 10 samples and was used for nested PCR to amplify the overlapping fragments.
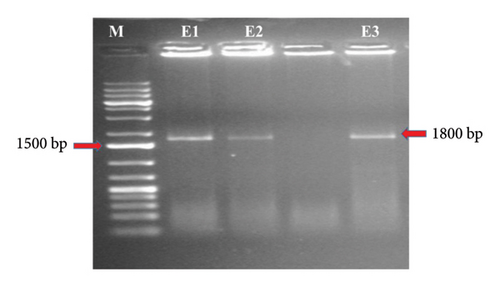
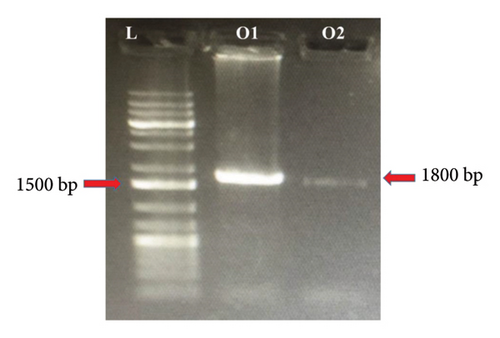
For the PCR amplification of the entire 18S rRNA gene by using Worm A and Worm B primers resulting in an amplicon size of around ∼1800 bp. Then, this PCR product was used for amplification by using two different PCRs. For the first fragment, amplification was done by using primers (Worm A and 1270 R), which yielded an amplicon of approximately ∼1100 bp. For the second fragment, amplification was done by using primers (Worm B and 1100 F), resulting in an amplicon size of around ∼750 bp.
3.4. PCR Amplification of Fragment I of 18S rRNA
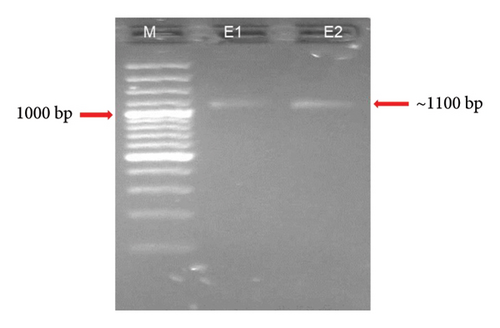
Fragment I of the 18S rRNA complete gene was amplified by using Worm A and 1270 R primers at different annealing temperatures 43°C, 44°C, 45°C, 46°C, 47°C, 49°C, 50°C, 52°C, 54°C, 56°C, and 57°C, which resulted in the amplification of Fragment I of the 18S rRNA with a fragment size of ∼1100 bp. The template used for this reaction was the PCR product obtained from the complete gene of 18S rRNA (∼1800 bp). A distinct and intense band was observed at 56°C and was selected to carry out the first nested PCR using the primers, and the same temperature was used to scale up the PCR product for further purification (Figure 6). The PCR product was amplified in 50 μL and purified using the gel extraction kit. Out of 10 samples, good amplification was observed in eight samples and the amplicons were sent to the sequencing.
3.5. PCR Amplification of the Fragment II of 18S rRNA
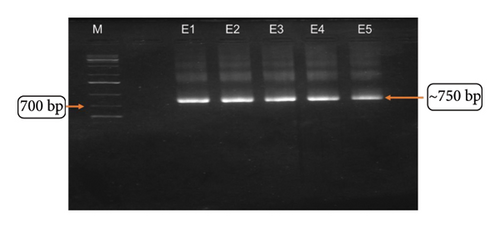
The Fragment II of the 18S rRNA complete gene was amplified using the primers Worm B and 1100 F at different annealing temperatures 42°C, 44°C, 46°C, 48°C, 50°C, and 52°C, which resulted in the amplification of Fragment I of the 18S rRNA with a fragment size of ∼750 bp. A distinct and intense amplicon was observed at 50°C, and the same temperature was used to scale up the PCR product for further purification (Figures 7(a) and 7(b)). The template used for this reaction was the PCR product obtained from the complete gene of 18S rRNA (∼1800 bp). Of the 10 samples, good amplification was observed on eight samples and the amplicons were sent to the sequencing.

3.6. Sequence Analysis
However, after trimming the poor-quality sequences at the ends, the length of Fragment I (1100 bp) in E3 and E6 is 659 and 722 bp, respectively. Similarly, the length of Fragment II (∼700 bp) in E3 and E6 is 435 and 526 bp, respectively. In the case of Sample nos. E2 and E8, good-quality sequences were obtained for Fragment I only. The sequence similarity analysis with the NCBI GenBank database is given in Table 1.
| Sample | Fragment I (∼1100) (bp) | Fragment II (∼750) (bp) | Species name (first best matching) | Query coverage (%) | Similarity (%) | Species name | Query coverage (%) | Similarity (%) |
|---|---|---|---|---|---|---|---|---|
| E2 | 747 | — | Eustrongylides sp. | 99 | 98.99 | Dioctophyme renale | 100 | 97.66 |
| E3 | 686 | 435 | Dioctophyme renale | 100 | 97.67 | Soboliphyme baturini | 100 | 96.46 |
| E4 | — | 618 | Eustrangylides sp. (99%) | 92 | 99.30 | Dioctophyme renale | 90 | 97.51 |
| E6 | 722 | 526 | Dioctophyme renale | 95 | 96.67 | Soboliphyme baturini | 100 | 94.42 |
| E7 | 822 | — | Eustrangylides sp. | 97 | 98.87 | Dioctophyme renale | 100 | 97.92 |
| E8 | 877 | — | Dioctophyme renale | 99 | 98.63 | Soboliphyme baturini | 99 | 96.46 |
3.6.1. Fragment I and II Sequence Analysis
A dataset was prepared, including the reported sequences that showed minimum coverage (90%) and sequence similarity (90%) with the present study sequence. The sequences were aligned to their homologous position, and the unaligned sequences were trimmed from the ends. The final length of Fragment I is 643 bp of which 83 are variable sites and 560 are conserved sites across the species, whereas for Fragment II, the sequence length was 429 bp consisting of 16 variable positions and 413 conserved positions across the species.
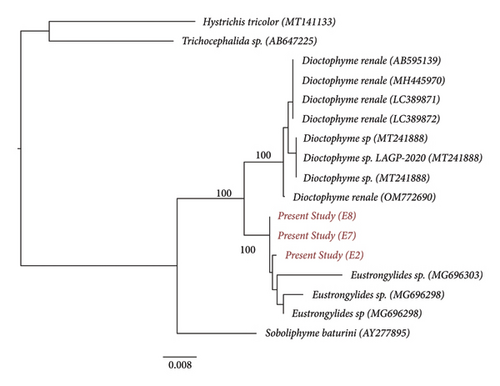
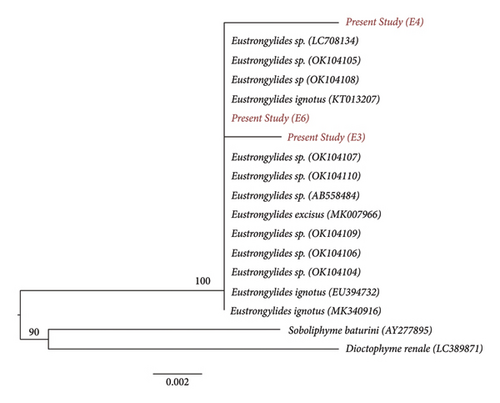
Gene sequence obtained from both the fragments was submitted to the NCBI database, and the submitted sequences were given a GenBank accession number (PP934436, PP934668, PP944856, and PP989425). Both the fragments showed the average genetic distance value of 0.003 with the Eustrongylides sp. The pairwise genetic distance and nucleotide differences based on Kimura two-parameter models were done among the species by using Fragment I and Fragment II of the 18S rRNA (Tables 2a and 2b). Furthermore, the consensus phylogenetic tree reconstructed with both fragments showed clustering of the present study species with the Eustrongylides sp. (Figures 8 and 9).
| Species | 1 | 2 | 3 | 4 | 5 | 6 | 7 | 8 | 9 | 10 | 11 | 12 | 13 | 14 | 15 | 16 | 17 |
|---|---|---|---|---|---|---|---|---|---|---|---|---|---|---|---|---|---|
| 1. Present study (E8) | 0.000 | 0.002 | 0.003 | 0.008 | 0.016 | 0.017 | 0.017 | 0.017 | 0.017 | 0.017 | 0.019 | 0.019 | 0.019 | 0.042 | 0.058 | 0.069 | |
| 2. Present study (E7) | 0 | 0.002 | 0.003 | 0.008 | 0.016 | 0.017 | 0.017 | 0.017 | 0.017 | 0.017 | 0.019 | 0.019 | 0.019 | 0.042 | 0.058 | 0.069 | |
| 3. Present study (E2) | 1 | 1 | 0.005 | 0.009 | 0.017 | 0.019 | 0.019 | 0.019 | 0.016 | 0.019 | 0.021 | 0.021 | 0.021 | 0.043 | 0.060 | 0.070 | |
| 4. Eustrongylides sp. (MG696298) | 2 | 2 | 3 | 0.005 | 0.019 | 0.021 | 0.021 | 0.021 | 0.017 | 0.021 | 0.022 | 0.022 | 0.022 | 0.045 | 0.062 | 0.072 | |
| 5. Eustrongylides_sp. (MG696298) | 5 | 5 | 6 | 3 | 0.024 | 0.025 | 0.025 | 0.025 | 0.022 | 0.025 | 0.027 | 0.027 | 0.027 | 0.050 | 0.067 | 0.077 | |
| 6. D. renale (OM772690) | 10 | 10 | 11 | 12 | 15 | 0.003 | 0.003 | 0.003 | 0.033 | 0.003 | 0.003 | 0.003 | 0.003 | 0.045 | 0.067 | 0.069 | |
| 7. D. renale (LC389872) | 11 | 11 | 12 | 13 | 16 | 2 | 0.000 | 0.000 | 0.035 | 0.000 | 0.003 | 0.003 | 0.003 | 0.047 | 0.069 | 0.070 | |
| 8. D. renale (LC389871) | 11 | 11 | 12 | 13 | 16 | 2 | 0 | 0.000 | 0.035 | 0.000 | 0.003 | 0.003 | 0.003 | 0.047 | 0.069 | 0.070 | |
| 9. D. renale (AB595139) | 11 | 11 | 12 | 13 | 16 | 2 | 0 | 0 | 0.035 | 0.000 | 0.003 | 0.003 | 0.003 | 0.047 | 0.069 | 0.070 | |
| 10. Eustrongylides_sp. (MG696303) | 11 | 11 | 10 | 11 | 14 | 21 | 22 | 22 | 22 | 0.035 | 0.037 | 0.037 | 0.037 | 0.057 | 0.077 | 0.088 | |
| 11. D. renale (MH445970) | 11 | 11 | 12 | 13 | 16 | 2 | 0 | 0 | 0 | 22 | 0.003 | 0.003 | 0.003 | 0.047 | 0.069 | 0.070 | |
| 12. Dioctophyme sp. (MT241888) | 12 | 12 | 13 | 14 | 17 | 2 | 2 | 2 | 2 | 23 | 2 | 0.000 | 0.000 | 0.048 | 0.070 | 0.070 | |
| 13. Dioctophyme sp. (MT241888) | 12 | 12 | 13 | 14 | 17 | 2 | 2 | 2 | 2 | 23 | 2 | 0 | 0.000 | 0.048 | 0.070 | 0.070 | |
| 14. Dioctophyme sp. (MT241888) | 12 | 12 | 13 | 14 | 17 | 2 | 2 | 2 | 2 | 23 | 2 | 0 | 0 | 0.048 | 0.070 | 0.070 | |
| 15. S. baturini (AY277895) | 26 | 26 | 27 | 28 | 31 | 28 | 29 | 29 | 29 | 35 | 29 | 30 | 30 | 30 | 0.058 | 0.063 | |
| 16. Trichocephalida_sp. (AB647225) | 36 | 36 | 37 | 38 | 41 | 41 | 42 | 42 | 42 | 47 | 42 | 43 | 43 | 43 | 36 | 0.065 | |
| 17. Hystrichis tricolor (MT141133) | 42 | 42 | 43 | 44 | 47 | 42 | 43 | 43 | 43 | 53 | 43 | 43 | 43 | 43 | 39 | 40 |
- Note: Values below diagonal are nucleotide differences, above diagonal are genetic distance values based on Kimura two-parameter models.
| Species | 1 | 2 | 3 | 4 | 5 | 6 | 7 | 8 | 9 | 10 | 11 | 12 | 13 | 14 | 15 | 16 | 17 | 18 |
|---|---|---|---|---|---|---|---|---|---|---|---|---|---|---|---|---|---|---|
| 1. Present study (B4) | 0.007 | 0.005 | 0.005 | 0.005 | 0.005 | 0.005 | 0.005 | 0.005 | 0.005 | 0.005 | 0.005 | 0.005 | 0.005 | 0.005 | 0.005 | 0.026 | 0.024 | |
| 2. Present study (B3) | 3 | 0.002 | 0.002 | 0.002 | 0.002 | 0.002 | 0.002 | 0.002 | 0.002 | 0.002 | 0.002 | 0.002 | 0.002 | 0.002 | 0.002 | 0.024 | 0.021 | |
| 3. Present study (B6) | 2 | 1 | 0.000 | 0.000 | 0.000 | 0.000 | 0.000 | 0.000 | 0.000 | 0.000 | 0.000 | 0.000 | 0.000 | 0.000 | 0.000 | 0.021 | 0.019 | |
| 4. E. ignotus (MK340916) | 2 | 1 | 0.000 | 0.000 | 0.000 | 0.000 | 0.000 | 0.000 | 0.000 | 0.000 | 0.000 | 0.000 | 0.000 | 0.000 | 0.000 | 0.021 | 0.019 | |
| 5. Eustrongylides sp. (AB558484) | 2 | 1 | 0.000 | 0.000 | 0.000 | 0.000 | 0.000 | 0.000 | 0.000 | 0.000 | 0.000 | 0.000 | 0.000 | 0.000 | 0.000 | 0.021 | 0.019 | |
| 6. E. excisus (MK007966) | 2 | 1 | 0.000 | 0.000 | 0.000 | 0.000 | 0.000 | 0.000 | 0.000 | 0.000 | 0.000 | 0.000 | 0.000 | 0.000 | 0.000 | 0.021 | 0.019 | |
| 7. E. ignotus (KT013207) | 2 | 1 | 0.000 | 0.000 | 0.000 | 0.000 | 0.000 | 0.000 | 0.000 | 0.000 | 0.000 | 0.000 | 0.000 | 0.000 | 0.000 | 0.021 | 0.019 | |
| 8. Eustrongylides sp. (OK104110) | 2 | 1 | 0.000 | 0.000 | 0.000 | 0.000 | 0.000 | 0.000 | 0.000 | 0.000 | 0.000 | 0.000 | 0.000 | 0.000 | 0.000 | 0.021 | 0.019 | |
| 9. Eustrongylides sp. (OK104109) | 2 | 1 | 0.000 | 0.000 | 0.000 | 0.000 | 0.000 | 0.000 | 0.000 | 0.000 | 0.000 | 0.000 | 0.000 | 0.000 | 0.000 | 0.021 | 0.019 | |
| 10. Eustrongylides sp. (OK104108) | 2 | 1 | 0.000 | 0.000 | 0.000 | 0.000 | 0.000 | 0.000 | 0.000 | 0.000 | 0.000 | 0.000 | 0.000 | 0.000 | 0.000 | 0.021 | 0.019 | |
| 11. Eustrongylides sp. (OK104107) | 2 | 1 | 0.000 | 0.000 | 0.000 | 0.000 | 0.000 | 0.000 | 0.000 | 0.000 | 0.000 | 0.000 | 0.000 | 0.000 | 0.000 | 0.021 | 0.019 | |
| 12. Eustrongylides sp. (OK104106) | 2 | 1 | 0.000 | 0.000 | 0.000 | 0.000 | 0.000 | 0.000 | 0.000 | 0.000 | 0.000 | 0.000 | 0.000 | 0.000 | 0.000 | 0.021 | 0.019 | |
| 13. Eustrongylides sp. (OK104105) | 2 | 1 | 0.000 | 0.000 | 0.000 | 0.000 | 0.000 | 0.000 | 0.000 | 0.000 | 0.000 | 0.000 | 0.000 | 0.000 | 0.000 | 0.021 | 0.019 | |
| 14. Eustrongylides sp. (OK104104) | 2 | 1 | 0.000 | 0.000 | 0.000 | 0.000 | 0.000 | 0.000 | 0.000 | 0.000 | 0.000 | 0.000 | 0.000 | 0.000 | 0.000 | 0.021 | 0.019 | |
| 15. Eustrongylides sp. (LC708134) | 2 | 1 | 0.000 | 0.000 | 0.000 | 0.000 | 0.000 | 0.000 | 0.000 | 0.000 | 0.000 | 0.000 | 0.000 | 0.000 | 0.000 | 0.021 | 0.019 | |
| 16. E. ignotus (EU394732) | 2 | 1 | 0.000 | 0.000 | 0.000 | 0.000 | 0.000 | 0.000 | 0.000 | 0.000 | 0.000 | 0.000 | 0.000 | 0.000 | 0.000 | 0.021 | 0.019 | |
| 17. D. renale (LC389871) | 11 | 10 | 9.000 | 9.000 | 9.000 | 9.000 | 9.000 | 9.000 | 9.000 | 9.000 | 9.000 | 9.000 | 9.000 | 9.000 | 9.000 | 9.000 | 0.021 | |
| 18. Soboliphyme baturini (AY277895) | 10 | 9 | 8.000 | 8.000 | 8.000 | 8.000 | 8.000 | 8.000 | 8.000 | 8.000 | 8.000 | 8.000 | 8.000 | 8.000 | 8.000 | 8.000 | 9.000 |
- Note: Values below diagonal are nucleotide differences and those above diagonal are genetic distance values based on Kimura two-parameter models.
4. Discussion
During evolution, organisms have developed various strategies to survive within their ecosystems. One such strategy is parasitism, where a parasite lives in or on a host and relies on it for nourishment and shelter to complete its life cycle. While each species plays a crucial role in maintaining ecological balance, some researchers even suggested that a healthy ecosystem tends to have a high diversity of parasites [12, 13]. However, excessive parasitic infestations can lead to secondary infections and may result in host mortality. Fish, as aquatic vertebrates, are particularly susceptible to parasitic infections. Studies have estimated that parasitic infections in fish could cause economic losses ranging from $1.05 billion to $9.58 billion [14]. Among these parasites, nematodes (roundworms) are of significant concern due to their zoonotic potential and the challenges they present for stakeholders, farmers, and consumers. Nematodes often lack distinctive features, making species identification difficult and imprecise. Accurate identification of these parasites is crucial for developing effective control strategies and understanding the dynamics of host–parasite–environment interactions.
Recently, fish in the Barvi Reservoir were heavily infested with unknown nematode parasites. These parasites were red, thread-like, and located in the coelomic area. To identify these nematodes, DNA barcoding was done, focusing on the small ribosomal RNA subunit (SSU/18S rDNA). This gene offers a useful combination of both constant regions, which are useful for alignment, and variable regions, which provide phylogenetic information [15, 16]. The 18S rDNA gene contains several variable regions, including V1 through V8, spaced at specific intervals along its length. This gene has been effectively utilized for nematode systematics and phylogenetics [17–19].
In our study, we have amplified the entire 18S rDNA gene (∼1800 bp) using Worm A and Worm B primers. The resulting amplicon was then reamplified through nested PCR to produce two overlapping fragments: Fragment I, which encompasses the V2–V3 and V4 regions, and Fragment II, which includes the V5–V7 regions. Out of 30 samples, 18S rDNA amplification was successful in 10, likely due to factors such as poor template quality, DNA degradation, or variability in primer binding sites. It is also possible that some parasites are evolutionarily divergent, leading to variations in primer binding sites.
In the present study, the sequences were assigned to the species by similarity with the NCBI GenBank database. In the database, the full length of the gene is not available, and thus, the analyses were carried out fragmentwise. The individuals of the same species show less genetic divergence value than the congeneric individuals. The database sequences that show 98%–100% similarity with the query sequences are considered the same species. Accordingly, the present study sequences (both fragments) showed 98% similarity with the species of Eustrongylides. The average genetic distance value between the present study sample and species of Eustrongylides was 0.003, indicating a high degree of genetic similarity and a close taxonomic relationship. This provides strong evidence for the identification of the sample as a particular species or closely related species within the Eustrongylides genus.
Eustrongylides is a genus of nematodes found worldwide, classified within the family Dioctophymatidae (order Ascaridida). Approximately eight species are known within this genus. The disease caused by these nematodes is called Eustrongylidosis, primarily affecting wading birds, such as shorebirds [20, 21]. These parasites are readily identifiable due to their red coloration and large size, and they are distinguished by the absence of a posterior sucker [20]. The lifecycle of Eustrongylides is complex and involves two types of intermediate hosts: a paratenic host and a definitive host. The definitive host provides the necessary environment for the parasite’s development, while the paratenic host merely acts as a transport medium. The lifecycle begins when a wading bird deposits feces into or near water bodies [20].
Eustrongylides spp. has been reported in several fish species, including European perch (Perca fluviatilis) [22], Wales catfish (Silurus glanis) [23], northern pike (Esox lucius) [24], pikeperch (Sander lucioperca) [25], and sun perch (Lepomis gibbosus) [26]. In India, this genus has been observed in Glossogobius giuris [27], as well as Channa punctatus and Channa striatus [28]. Our study reports the presence of Eustrongylides in O. bimaculatus and N. anguilla. Previously, Fernando and Furtado reported the species of Eustrongylides in Ompok from Sri Lanka [29]. Urdes observed the occurrence of Eustrongylides sp. in Anguilla anguilla from Romania [30]. Eustrongylides spp. has been recognized as a zoonotic parasite that may pose a public health risk to consumers [31–34]. The symptoms include severe abdominal pain and perforations in caeca. Coyner reported an outbreak of Eustrongylidosis is related to agricultural runoff and urban development [35]. Eutrophication of water bodies can give rise to the growth of large populations of oligochaete worms, which act as intermediate hosts for the parasite [36]. As this species lives outside the stomach in the body cavity, traditional anthelmintic are not very effective. However, disease outbreak could be prevented by controlling the oligochaete populations by monitoring nutrient levels in the water, decreasing the level of oxygen in the water, and reducing chemical runoff to the water bodies [37].
In conclusion, the present study identified the nematode parasite of the fish caught from the Barvi Reservoir, as a species of Eustrongylides. The species-level identification could not be possible due to the insufficient/lack of reference sequences in the database. It indicates the knowledge gap concerning the species-specific molecular markers for the nematode parasites of the fish. So there is a need to develop species-specific molecular markers and reference database for the species-level identification of various nematode parasites. Developing genomic and transcriptomic databases for various nematode parasites and incorporating these data into publicly accessible repositories can also enhance the accuracy of species identification. Due to zoonotic potential of Eustrongylides spp., we recommend that fishermen and consumers be made aware of the associated risks. To reduce the risk of zoonotic transmission, we suggest that fish be cooked thoroughly to an internal temperature of at least 63°C, which is sufficient to kill nematode larvae. Additionally, using separate cutting boards and knives for raw fish can help prevent cross-contamination. The increased oligochaete population in water bodies, driven by agricultural runoff and eutrophication, may facilitate the transmission of parasites. Therefore, monitoring and controlling nutrient levels and intermediate hosts in the Barvi Reservoir are essential to prevent infestations.
Conflicts of Interest
The authors declare no conflicts of interest.
Author Contributions
Gowhar Iqbal: benchwork, writing–original draft, software analysis, manuscript correction; Annam Pavan Kumar: supervision and overall guidance, software analysis, methodology review, and editing; Amjad Khansaheb Balange: methodology and validation; Sanath Kumar: methodology and validation; K. V. Rajendran: overall guidance and data analysis; Sonal Suman and Nahida Quyoom: assistance in PCR; Sangeetha S: helped in DNA isolation; and Showkat Ahmad Dar: manuscript submission, and editing. All the authors have approved the version of the manuscript submitted to the journal.
Funding
The authors wish to express their sincere gratitude to the Director, ICAR-Central Institute of Fisheries Education, Mumbai, Maharashtra, India, for providing the financial support and facilities to conduct this research work successfully.
Acknowledgments
The authors wish to express their sincere gratitude to the Director, ICAR-Central Institute of Fisheries Education, Mumbai, Maharashtra, India, for providing the financial support and facilities to conduct this research work successfully.
Open Research
Data Availability Statement
The data that support the findings of this study are available on request from the corresponding author. The data are not publicly available due to privacy or ethical restrictions.


