Relationship between the Significant Solutions of Static Traffic Assignment Problems for Mixed Traffic Flow of Connected and Automated Vehicles and Human-Driven Vehicles
Abstract
Connected and automated vehicles can reduce the traffic congestion level of the entire network through platoon-driving technologies compared to human-driven vehicles. One promising approach to enhancing platoon-driving technology’s efficiency is deploying dedicated lanes or roads for connected and automated vehicles. Since asymmetric interactions between different vehicle types increase road congestion, it is necessary to distinguish routes for efficient traffic management. However, the traditional traffic assignment problem, which uses only user equilibrium as a constraint with no difference in travel time between users, could not be proposed as a globally optimal solution because it generates an infinite number of locally optimal solutions. Recent studies have attempted to overcome the limitations by considering the sum of system-wide travel times as an additional constraint. Their research sought to help propose optimal deployment strategies through the lowest total travel time solution (best-case) or design robust transport planning strategies through the highest total travel time solution (worst-case). However, past studies have not focused on the possibility of the best/worst case appearing in reality. This study focused on the relationship between the two solutions pointed out in past studies and traffic patterns likely to appear in reality. This study interprets the Karush–Kun–Tucker condition of the static traffic assignment problem, considering the asymmetric interaction, and proposes a solution algorithm using discrete dynamics. The proposed algorithm extends the most widely used method in transportation planning research, which can overcome the limitations of asymmetric interaction problems through simple variations. The proposed algorithm can reliably derive two solutions, and entropy theory shows that both solutions are unlikely to appear in reality without additional policies such as dedicated lanes or roads.
1. Introduction
Connected and automated vehicle (CAV) technologies are expected to improve traffic safety and reduce congestion costs, an essential issue in future transportation planning. The primary technology embedded in CAVs is communication with other vehicles and recognition of surrounding road conditions for automated control. The technology allows drivers to quickly recognize unexpected roadway situations and mitigate drivers′ response time. Compared to human-driven vehicles (HDVs), CAVs have several merits: shorter headway by reducing response time, unnecessary lane changing and acceleration and deceleration maneuvers, and reliable information in a broader area or the entire network in real-time. Moreover, since the physical size of HDVs and CAVs is almost the same, these three advantages allow more CAVs to pass through the same road than HDVs in an hour. In the transportation planning study, the operational road capacity refers to the number of vehicles available in an hour, and previous studies have shown that the traffic flow to which CAV belongs increases the operational road capacity compared to that of HDV only [1]. Changes in operational road capacity can increase or decrease the travel time experienced by the same number of vehicles on the road, which can affect the traveler’s route choice behavior. In addition, changes in the travel behavior of each road can significantly change the total travel time of travelers, thereby increasing the travel demand and affecting network traffic flow patterns. Therefore, research on the traffic assignment model considering the characteristics of CAVs is very important in transportation planning, which proposes and evaluates policies according to network traffic patterns.
In most transportation planning research, the basic premise is to choose a route according to Wardrop’s first principle (i.e., user equilibrium; UE), which states that a user does not use a route with a longer travel time than other users with the same origin and destination [2]. The traffic pattern in which all users follow Wardrop’s first principle has one unique solution (i.e., UE solution) under several conditions [3]. An essential condition is that the effect of each vehicle on the operational road capacity is fixed regardless of the surrounding vehicle. Therefore, the characteristics of different vehicle types are standardized by the average area occupied on the road. This concept, defined as a passenger car unit (PCU), is converted through a passenger car equivalent (PCE) for each vehicle type, and the traditional traffic assignment model must have a fixed PCE. However, the PCE of the CAV cannot be fixed because the area occupied by the CAV changes with the number of vehicles in the platoon system.
Previous studies on variable PCE began by considering the characteristics of heavy vehicles. According to the Highway Capacity Manual (HCM), the effect of heavy vehicles on congestion depends on the proportion of vehicles mixed in the vehicle flow [4]. For example, at a 5% heavy vehicle mixing rate on a road with a slope of a six-degree slope, one heavy vehicle increases congestion six times that of a passenger car, but at a 10% heavy vehicle mixing rate, increases congestion four times. Thus, several approaches have been studied at the time of rapid increase in road freight traffic [5–7], and strategies that can be applied to the platoon system of CAV with similar characteristics have been developed [1, 8, 9]. In previous studies, the proposed approach to consider the change in the operational road capacity is divided into two categories: modifying the road travel time function and defining a significant solution among infinite multiple solutions. However, both categories have limitations, and the relationship between CAV and HDV cannot be adequately interpreted.
First, travel time functions proposed in past studies have not adequately defined the interaction between CAV and HDV. For studies that analyzed the relationship between trucks and passenger cars, the travel time function was formulated based on the properties presented in the HCM [5–7]. On the other hand, recent studies analyzing the relationship between CAV and HDV have analytically solved possible situations in a single lane [1, 8, 9]. In other words, studies on trucks between passenger cars considered the effect of vehicles in adjacent lanes on driving on multilane roads, but studies on CAVs and HDVs did not. Hence, examining the adequacy of characteristics not considered in recent studies is necessary by comparing the differences between the two approaches.
Second, recent studies have insisted that it is possible to identify the UE solution with the lowest (best-case UE; BC/UE) or highest (worst-case UE; WC/UE) total travel time [1, 8]. BC/UE can be expected to separate route choices per class to minimize the additional congestion effect in mixed traffic flow while satisfying UE conditions. In fact, the road traffic volume of BC/UE presented in a past study [8] indicates that some lanes or roads are restricted from being used by certain vehicle classes. In particular, dedicated lanes for HDVs may reduce congestion levels rather than dedicated lanes for CAVs, depending on the demand for CAV flow [10]. By contrast, a recent study has noted that WC/UE is also an important solution. Since BC/UE is such an optimized solution in terms of social cost, it may be difficult to implement with policies such as dedicated lanes or tolling systems [1]. In other words, while satisfying UE conditions, the traffic pattern with the lowest total travel time is ideal because it is optimal regarding social costs but cannot be reached. However, WC/UE may also be the worst condition that is difficult to appear in reality, and discussing the most realistic traffic flow patterns together is necessary. Hence, verifying the conditions under which each solution is derived is necessary to examine whether two solutions focusing on prior research will appear in reality. Comparative analysis allows us to determine what solutions are needed to evaluate the effectiveness of new transportation planning strategies.
This study reviews past studies on the abovementioned two essential issues and proposes several improvements. First, recent studies point out the limitations of the travel time function proposed to consider the interaction between CAV and HDV, and suggest future improvement directions. Second, this study reviews the conditions under which two solutions are derived through Karush–Kun–Tucker conditions and presents solution algorithms.
The remainder of this paper is organized as follows. Section 2 reviews the proposed travel time functions in past studies and proposes a suitable formula for analyzing the interaction between CAVs and HDVs. Section 3 demonstrates that BC/UE and WC/UE are reliably identifiable if pathfinding procedure considers each class share of roads. In addition, this section proposes an approach to explore the solution by extending the pairwise alternate segment (PAS)-based algorithm. Section 4 presents the analysis results for a simple synthetic example road network. Finally, Section 5 summarizes the implications of this study and discusses directions for future research. The notation list used in the study is shown in Table 1.
| Notation | |
|---|---|
| m class flow on link a | |
| m class flows belonging to other PASs on link a | |
| m class flow on path k from o to d | |
| qod,m | m class demand from o to d |
| m class flow ratio on path k from o to d | |
| Headway between class m (front vehicle) and class n (rear vehicle) on link a | |
| m class passenger car equivalent on link a | |
| m class travel time on link a | |
| αa, βa | Calibration parameter on link a |
| Ca | Operational capacity on link a |
| M, m | Class |
| O, o | Origin |
| D, d | Destination |
| Kod,m | Path set from o to d for class m |
| s | PAS segment |
2. Literature Review
2.1. Link Travel Time Function Configuration for the Asymmetric Interaction Problem
Asymmetric interaction refers to the asymmetric effects between different vehicle types during driving. For example, a CAV may have a reduced headway when following a CAV, but an HDV maintains the same headway regardless of the following vehicle [9]. Similarly, in the relationship between trucks and passenger cars, the headway of trucks is likely to remain independent of the following vehicle. Due to this characteristic, the link travel time perceived by HDV users may vary depending on the penetration rate of CAV and the traffic assignment model considering that the properties of CAV should consider this effect.
Vehicles affecting each traveler are divided into driving in the same lane and driving in the nearby lane. The impact from the same lane has been proposed based on the headway, which depends on the following vehicle in previous studies [1, 8]. According to these studies, the change in PCE occurring in a single lane is derived as follows.
Equations (3) to (5) are not limited to the CAV and HDV relationship but present a characteristic applicable to all vehicle types. In other words, assuming that there is no effect on the nearby lane, (5) must be satisfied. However, studies on the relationship between trucks and passenger cars based on observation data suggest that the influence of nearby lanes exists [4, 6, 7]. Figure 1 shows the PCE change by the percentage of trucks presented in the HCM [4].
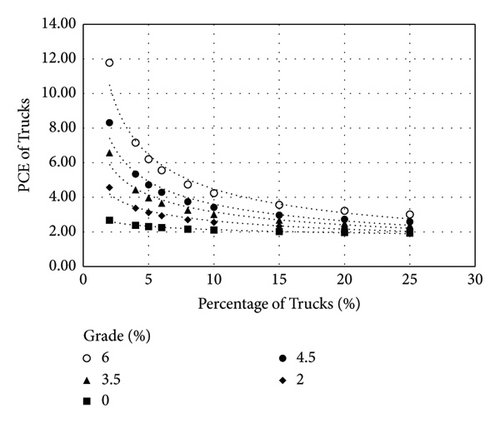
Table 2 summarizes whether the road travel time functions adopted in the past studies satisfy the properties of asymmetric interaction. Among the past studies, satisfying all conditions is using the regression result in Figure 1 [7]. Although this approach is expected to be intuitive and effective, it can only be applied with sufficient observation or simulation results. However, considering the difficulty of the analytical approach to the interaction of nearby lanes in the problem between CAVs and HDVs, it is a sufficiently attractive alternative.
Intuitively, travel time functions for mixed traffic flow should be located somewhere (i.e., at intermediate points) between the travel time functions for the single-class traffic flow per class. In addition, the derived formula should also guarantee a smooth response to changes in class shares. For (9), the abovementioned conditions are satisfied due to the fact that the formula is constructed by linear interpolation through class share. Equation (9) considers asymmetric interaction well (conditions 1 to 3), and the proof process is provided in Appendix 1. However, this approach refers to a situation where the two vehicle types drive together in the most efficient deployment. Since it is an equation based on the number of heavy vehicles on the road, it is impossible to distinguish between the case where heavy vehicles drive in a cluster and the case where they drive in a scattered manner. Nonetheless, it is possible to explain the adjacent lane effect (condition 3) but it is difficult to approach explaining this effect analytically, hence (9) is a good option.
2.2. Multiple Equilibria Issue in Asymmetric Interaction Problem
The traffic assignment problem estimates the traffic volume of each road and lane, assuming that all users choose the route with the lowest travel time. The basic form of the traffic assignment problem is a single-class analysis in which all users are assumed to be homogeneous groups, and all vehicle types are standardized as PCUs. The main reason for ignoring the characteristics of each user and vehicle is to configure the objective function as a globally convex function and derive unique estimation results under the same network conditions [3]. However, the limitation of single-class analysis is that it is impossible to know each road’s share by type and user characteristics belonging to the estimated traffic pattern. For example, the total PCU using roads derived from single-class analysis can be known, but the proportion of trucks and passenger cars cannot be known. Since identifying roads mainly used by specific travel modes is an essential issue in proposing transportation policy, studies have been conducted to overcome the limitations of the single-class analysis, and studies that further considered entropy theory have reached significant results [13–16]. These studies pointed out that entropy-maximized traffic patterns, which are most likely to appear in reality, can be identified among the infinite number of traffic patterns that satisfy UE conditions. However, the following two assumptions must be accompanied to ensure the globally convex objective function:
Assumption 1. The PCE of each class should be identical regardless of all road conditions.
Assumption 2. If a link cannot be satisfied with Assumption 1, the link should be a dedicated link for a specific class.
In the previous study [8], the necessity of the abovementioned assumptions was well verified through variational inequality. However, to analyze the relationship between CAV and HDV, Assumption 1 cannot be met because the PCE of CAV depends on CAV share in the road, as described in Section 2.1. Thus, asymmetric interaction, the characteristic of the PCE changing according to class share, cannot be a unique equilibria problem. Thus, significant traffic patterns should be identified through additional criteria to solve the asymmetric interaction problems, as previous studies have identified the ratio of each type on the road through entropy theory.
An example of a two-link network (Figure 2) with travel time functions considers the asymmetric interaction ((9)). The route choice rule is UE, and the disutility is represented by travel time only. As mentioned before, traffic assignment considering asymmetric interaction has multiple UE solutions as shown in Table 3. It should be noted that if a certain class uses only one route, it will have a lower total travel time than when both routes are used by all classes. Intuitively, the equilibrated link cost is lower where a dedicated link exists due to the fact that mixed traffic flows cause additional congestion effect by asymmetric interaction. If the results with the lowest additional congestion effect (e.g., assignment result 1) can always be identified, then the optimized dedicated links deployment for the goal of total travel time minimization can be provided. Furthermore, it can address the question of which class is most efficient to deploy dedicated links or lanes depending on the CAV demand [10].
Several studies insisted that two flow patterns can always be identified [7, 8]. The two are the lowest total travel time (i.e., the best-case UE; BC/UE) and the highest total travel time (i.e., the worst-case UE; WC/UE). In addition, a recent study has also proved that the upper and lower bounds of WC-UE can be analytically derived by a partition-based norm relaxed method of feasible direction (NRMFD) solution algorithm [1]. In particular, the most recent study suggests the importance of WC/UE and emphasizes that BC/UE is challenging to realize by transportation planning strategy [1]. Rather than seeking the most efficient way to operate CAVs, such as a strategy for deploying dedicated lanes, it is important to ensure the robustness of the new transportation policy by examining the worst conditions that will appear in reality.
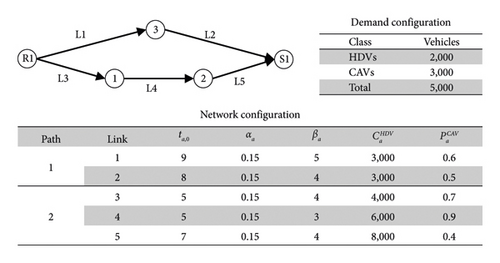
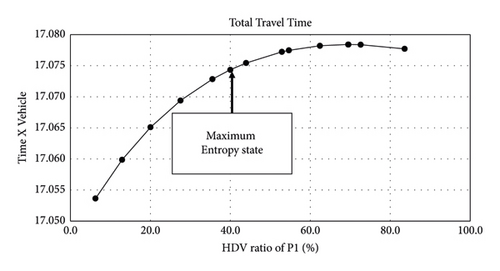
However, past studies have not significantly addressed under what conditions WC/UE and BC/UE are derived. In another example (Figure 3) using (9), WC/UE can be easily solved by hand, which differs from the maximum entropy user equilibrium state (ME/UE). Many studies have pointed out that the most likely condition to be derived from reality is the state in which maximum entropy state [13–16]. Hence, Figure 4 suggests that both WC/UE and BC/UE are traffic patterns that cannot appear in reality without any external action (i.e., transportation planning strategy). In short, the meaning of the three traffic patterns considering asymmetric interactions caused by CAV is as follows:
-
ME/UE: mixed traffic flow pattern without transportation planning strategies.
-
BC/UE: best results of mixed traffic flow pattern with dedicated lane provision strategies (e.g., lower bound of total travel time).
-
WC/UE: worst results of mixed traffic flow pattern with dedicated lane provision strategies (e.g., upper bound of total travel time).
All three traffic patterns will be essential to evaluate new transportation planning strategies to operate CAVs efficiently. For example, if there is no significant difference in BC/UE’s performance compared to ME/UE, the layout of dedicated lanes would not be a good improvement direction. Conversely, if the performances of ME/UE and WC/UE are similar, it would be desirable to take active action. In this context, ME/UE, which is out of the focus of existing studies, has a significant meaning. In addition, to understand the relationship between the three traffic patterns, it is necessary to understand under what conditions WC/UE and BC/UE are derived.
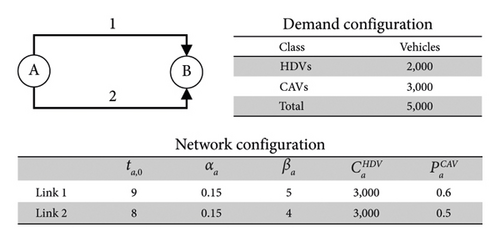
| Assignment result | Class flow on link 1 | Class flow on link 2 | Equilibrated travel time | ||
|---|---|---|---|---|---|
| HDVs | CAVs | HDVs | CAVs | ||
| 1 | 1,068 | — | 932 | 3,000 | 9.007730 |
| 2 | 584 | 877 | 1,416 | 2,123 | 9.016527 |
| 3 | — | 1,799 | 2,000 | 1,201 | 9.008144 |
3. An Extended PAS-Based Solution Algorithm for the Asymmetric Interaction Problem
3.1. Global Optimality Condition for Asymmetric Interaction Problem
If each class flow is a local optimum solution, then the differential value of the Lagrangian function in (13) is zero. The μ is based solely on origin/destination (O/D) pairs rather than on a path-specific value because the costs of all used paths should be the same UE condition. Hence, the following formula is obtained by combining (12) and (13).
Assuming that the flow of different O/D pair flow () is zero, (14) depicts the weighted value of the connected and automated vehicle equivalent (CVE) of the links included in the path. Hence, (12) and (15) are set to “P”, which is the path PCE (path CVE between HDVs and CAVs). Importantly, the CVE of each link is determined by the class share (), and the class share has monotonicity by condition 2 ((8)). Since only one satisfies (14), there is only one stationary point. Also, since the stationary point is a UE solution with the maximum total travel time (WC/UE) by condition 3 ((9)), this problem is globally concave.
The flow of different paths on a link only occurs in a link commonly used by different path flows, as shown in Figure 5. The A-2 link commonly used by two O/D pairs A-B and A-C affects the flow of the A-C pair in finding the stationary path flow vector of the A-B pair.
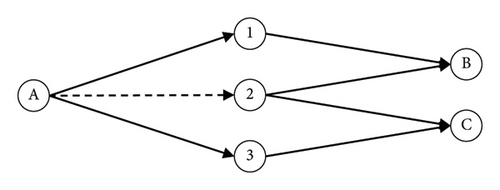
The first term of (16) is a concave problem by the class share of HDVs. The important fact is that the path-equilibrated travel time is a concave by the class share of HDVs. If the path-equilibrated travel time is a concave by the class share of HDVs, then the travel time of the links included in the path is also concave. Due to the fact that the flow of different O/D pair flow () on the link does not change, the second term of (16) is also concave.
Thus, UE solutions with asymmetric interactions are globally concave for total travel time by Karush–Khun–Tucker conditions. The stationary solution is the WC/UE with the maximum total travel time; thus, BC/UE is the farthest boundary solution from the stationary solution.
3.2. An Extended PAS-Based Solution Algorithm for the Asymmetric Interaction Problem
The solution algorithm of the traffic assignment problem searches for the optimal solution through an iterative process and is classified according to the scope of the exploration: link-based algorithms [17], path-based algorithms [18–20], and bush-based algorithms [14, 21–23]. The basic search method is to choose the fastest route for each repetitive process and move some of the previously assigned route traffic, repeating it until all route users meet the UE condition. Among them, the bush-based algorithm has the fastest time required to search for an optimal solution and has a structure suitable for searching for BC/UE and WC/UE in this study.
The PAS-based algorithm is essentially the same as the bush-based algorithm (BBA; i.e., algorithm B). The stationary point of the restricted subproblem is calculated through the flow shift between two paths where a common node does not exist (i.e., PAS; Figure 6), and then another PAS is found to repeat the same process. The convergence of the PAS-based algorithm has already been proved in past studies and is known as the most efficient algorithm for the deterministic static traffic assignment problem [14, 15].
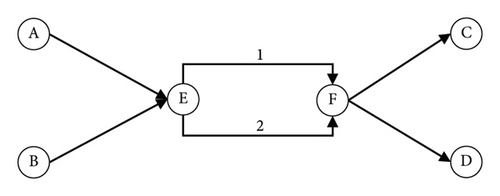
The greatest difference between the BBA and the PAS-based algorithm is that the uniqueness of the path flow vector can only be guaranteed through the PAS-based algorithm. The two algorithms can be distinguished by their objectives. BBA aims to assign a link flow vector satisfying the UE conditions, whereas the PAS-based algorithm intends to guarantee the uniqueness of the path flow vector. In response, the concepts of cost-effective PAS and flow-effective PAS are defined [15]. Cost-effective PASs mean that the travel costs (i.e., disutility) of the two segments satisfy the UE conditions. Thus, if all PASs in the network are cost-effective, the traffic assignment results satisfy the UE conditions. This is in the same context as determining the branch nodes of different paths in algorithm B to determine whether the travel costs between the branch nodes are the same. Flow-effective PASs mean that the path flow vector satisfies the proportionality property. This property is not considered by the BBA, as it does not aim for unique path flow vectors.
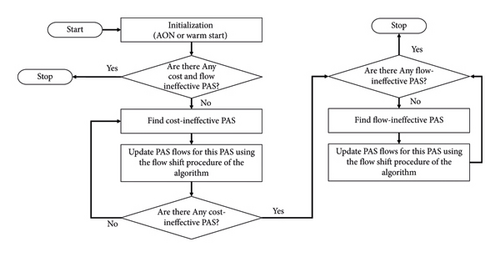
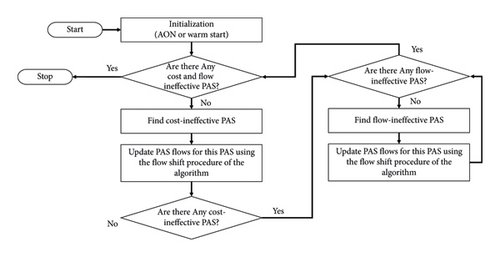
Thus, this study’s proposed algorithm modifies the criteria for the flow-effective PAS to match the research purpose. The remaining procedures of the algorithm do not differ significantly from the current PAS-based algorithms, and Figure 7 displays a flowchart of the general PAS-based algorithm.
-
BC/UE criterion 1: one of the classes cannot use both segments of PAS.
-
BC/UE criterion 2: if more than one PAS flow vector satisfies criterion 1, then the total travel time should be the lowest.
-
Step 1: all HDV flows are assigned to s1 and all CAV flows are assigned to s2.
-
Step 2: by comparing the travel times of the two segments, the flow moves to the smaller side to satisfy the UE conditions.
-
Step 3: step 2 is repeated by assigning the class flow to different segments from those assigned in step 1.
Thus, less than two path flow vectors can be searched that satisfy the UE conditions and flow-effective BC/UE criterion 1. Still, BC/UE criterion 2 should be satisfied for all path flow vectors found above. It could take twice longer even if algorithms guarantee only the uniqueness of the link flow vectors because up to two UE path flow vectors must be found and compared. Moreover, the proportionality property can be achieved without additional flow shift, whereas BC/UE criterion 2 requires a comparison of all PASs in the flow-efficient PAS procedure. Furthermore, this problem must have a cyclic structure as shown in Figure 8, because flow shifts affect UE conditions.
The flow-effective PAS criteria of WC/UE and ME/UE are as follows.
As a result, for ME/UE and WC/UE to be the same, the ideal conditions require all roads and demand. These conditions are unlikely in reality, so ME/UE and WC/UE are different solutions.
4. Simulation Analysis
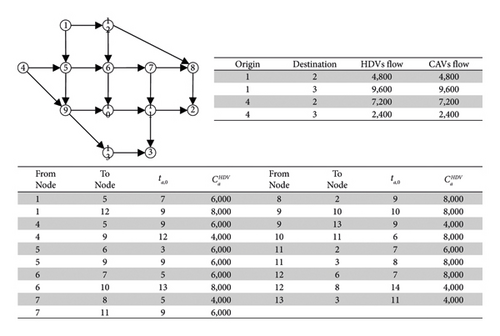
The BC/UE and WC/UE derived from the proposed solution algorithm are shown in Tables 4 and 5. As the previous study has pointed out, BC/UE results indicate that some links use only a single class to reduce the additional congestion effect caused by asymmetric interactions [10]. Hence, arranging a dedicated lane or link would be most efficient based on the results derived in Table 4. However, as shown in Table 6, it is difficult to expect the same result with a discrete number of dedicated lane plans because the HDV ratio of each link is a continuous number. As a result, Table 4 is expected to be used as an indicator to evaluate the effectiveness of a new transportation planning strategy or as a reference for exploring alternatives to dedicated lane deployment.
| FN | TN | HDVs flow | CAVs flow | Travel cost | Cost·Veh |
|---|---|---|---|---|---|
| 1 | 5 | 9,600.0 | 1,554.3 | 18.02 | 201,007 |
| 1 | 12 | 4,800.0 | 12,845.7 | 20.71 | 365,388 |
| 4 | 5 | 8,820.2 | — | 15.30 | 134,989 |
| 4 | 9 | 779.8 | 9,600.0 | 27.91 | 289,744 |
| 5 | 6 | 11,940.1 | — | 10.06 | 120,085 |
| 5 | 9 | 6,480.2 | 1,554.3 | 12.61 | 101,313 |
| 6 | 7 | 11,878.0 | — | 16.52 | 196,219 |
| 6 | 10 | 62.1 | 10,278.9 | 13.73 | 142,022 |
| 7 | 8 | 5,074.4 | — | 6.94 | 35,230 |
| 7 | 11 | 6,803.6 | — | 11.23 | 76,417 |
| 8 | 2 | 9,874.4 | 2,566.8 | 15.48 | 192,571 |
| 9 | 10 | 560.9 | 11,154.3 | 11.18 | 130,993 |
| 9 | 13 | 6,699.0 | — | 19.62 | 131,438 |
| 10 | 11 | 622.9 | 21,433.2 | 14.02 | 309,171 |
| 11 | 2 | 2,125.6 | 9,433.2 | 11.19 | 129,331 |
| 11 | 3 | 5,301.0 | 12,000.0 | 18.40 | 318,372 |
| 12 | 6 | — | 10,278.9 | 7.37 | 75,764 |
| 12 | 8 | 4,800.0 | 2,566.8 | 30.83 | 227,140 |
| 13 | 3 | 6,699.0 | — | 23.98 | 160,646 |
| Total travel cost | 3,337,840 | ||||
| FN | TN | HDVs flow | CAVs flow | Travel cost | Cost·Veh |
|---|---|---|---|---|---|
| 1 | 5 | 6,291.8 | 6,291.8 | 18.47 | 232,470 |
| 1 | 12 | 8,108.2 | 8,108.2 | 21.87 | 354,697 |
| 4 | 5 | 5,457.6 | 5,457.6 | 17.35 | 189,397 |
| 4 | 9 | 4,142.4 | 4,142.4 | 30.71 | 254,410 |
| 5 | 6 | 7,111.2 | 7,111.2 | 11.02 | 156,787 |
| 5 | 9 | 4,638.3 | 4,638.3 | 13.36 | 123,907 |
| 6 | 7 | 7,231.9 | 7,231.9 | 19.30 | 279,223 |
| 6 | 10 | 3,932.2 | 3,932.2 | 14.03 | 110,326 |
| 7 | 8 | 2,990.5 | 2,990.5 | 7.12 | 42,569 |
| 7 | 11 | 4,241.4 | 4,241.4 | 12.05 | 102,188 |
| 8 | 2 | 7,045.7 | 7,045.7 | 6.34 | 230,252 |
| 9 | 10 | 4,757.7 | 4,757.7 | 11.70 | 111,288 |
| 9 | 13 | 4,023.0 | 4,023.0 | 21.48 | 172,846 |
| 10 | 11 | 8,689.9 | 8,689.9 | 17.32 | 301,066 |
| 11 | 2 | 4,954.3 | 4,954.3 | 11.41 | 113,065 |
| 11 | 3 | 7,977.0 | 7,977.0 | 8.72 | 298,662 |
| 12 | 6 | 4,052.9 | 4,052.9 | 7.63 | 61,807 |
| 12 | 8 | 4,055.2 | 4,055.2 | 34.05 | 276,140 |
| 13 | 3 | 4,023.0 | 4,023.0 | 26.26 | 211,256 |
| Total travel cost | 3,622,357 | ||||
| From node | To node | |
|---|---|---|
| 1 | 5 | 86.1 |
| 1 | 12 | 27.2 |
| 4 | 5 | 100.0 |
| 4 | 9 | 7.5 |
| 5 | 6 | 100.0 |
| 5 | 9 | 80.7 |
| 6 | 7 | 100.0 |
| 6 | 10 | 0.6 |
| 7 | 8 | 100.0 |
| 7 | 11 | 100.0 |
| 8 | 2 | 79.4 |
| 9 | 10 | 4.8 |
| 9 | 13 | 100.0 |
| 10 | 11 | 2.8 |
| 11 | 2 | 18.4 |
| 11 | 3 | 30.6 |
| 12 | 6 | — |
| 12 | 8 | 65.2 |
| 13 | 3 | 100 |
As mentioned in Section 3.2, WC/UE and ME/UE are identical because they satisfy (18) and (19) of the simulation analysis. WC/UE under general conditions is difficult to derive for the same reason as BC/UE. Hence, previous studies have suggested the importance of WC/UE to improve the robustness of new transportation planning strategies, but it will be essential to consider BC/UE as well. Another way to say is that evaluating the adequacy of the new dedicated lane deployment strategy in both upper and lower aspects based on ME/UE is necessary.
| FN | TN | HDVs flow | CAVs flow | Travel cost | Cost·Veh |
|---|---|---|---|---|---|
| 1 | 5 | 3,833.1 | 11,772.0 | 16.04 | 250,263 |
| 1 | 12 | 10,566.9 | 2,628.0 | 18.07 | 238,469 |
| 4 | 5 | 7,824.6 | — | 12.90 | 100,973 |
| 4 | 9 | 1,775.4 | 9,600.0 | 24.66 | 280,549 |
| 5 | 6 | 5,163.8 | 11,048.9 | 9.49 | 153,939 |
| 5 | 9 | 6,494.0 | 723.1 | 11.76 | 84,862 |
| 6 | 7 | 10,930.5 | — | 13.26 | 144,946 |
| 6 | 10 | — | 11,846.3 | 13.24 | 156,847 |
| 7 | 8 | 4,699.3 | — | 6.43 | 30,211 |
| 7 | 11 | 6,231.2 | — | 10.57 | 65,866 |
| 8 | 2 | 9,499.4 | 1,830.5 | 14.10 | 159,738 |
| 9 | 10 | 2,036.2 | 10,323.1 | 10.98 | 135,661 |
| 9 | 13 | 6,233.2 | — | 16.96 | 105,718 |
| 10 | 11 | 2,036.2 | 22,169.5 | 10.59 | 256,365 |
| 11 | 2 | 2,500.6 | 10,169.5 | 9.96 | 126,158 |
| 11 | 3 | 5,766.8 | 12,000.0 | 16.12 | 286,446 |
| 12 | 6 | 5,766.8 | 797.4 | 7.46 | 48,964 |
| 12 | 8 | 4,800.1 | 1,830.5 | 27.15 | 180,012 |
| 13 | 3 | 6,233.2 | — | 20.73 | 129,211 |
| Total travel cost | 2,935,199 | ||||
| FN | TN | HDVs flow | CAVs flow | Travel cost | Cost·Veh |
|---|---|---|---|---|---|
| 1 | 5 | 9,964.0 | — | 14.99 | 149,316 |
| 1 | 12 | 4,436.0 | 14,400.0 | 16.38 | 308,452 |
| 4 | 5 | 7,883.6 | — | 13.02 | 102,675 |
| 4 | 9 | 1,716.4 | 9,600.0 | 24.02 | 271,811 |
| 5 | 6 | 11,231.8 | — | 8.53 | 95,762 |
| 5 | 9 | 6,615.8 | — | 11.00 | 72,743 |
| 6 | 7 | 11,025.9 | — | 13.55 | 149,434 |
| 6 | 10 | 205.9 | 11,998.1 | 13.33 | 162,665 |
| 7 | 8 | 4,753.4 | — | 6.50 | 30,876 |
| 7 | 11 | 6,272.5 | — | 10.61 | 66,567 |
| 8 | 2 | 9,189.4 | 2,401.9 | 14.36 | 166,451 |
| 9 | 10 | 2,090.1 | 9,600.0 | 10.86 | 126,947 |
| 9 | 13 | 6,242.0 | — | 17.01 | 106,149 |
| 10 | 11 | 2,296.0 | 21,598.1 | 10.84 | 258,931 |
| 11 | 2 | 2,810.6 | 9,598.1 | 10.24 | 127,104 |
| 11 | 3 | 5,758.0 | 12,000.0 | 16.09 | 285,802 |
| 12 | 6 | — | 11,998.1 | 7.14 | 85,618 |
| 12 | 8 | 4,436.0 | 2,401.9 | 27.18 | 185,887 |
| 13 | 3 | 6,242.0 | — | 20.78 | 129,738 |
| Total travel cost | 2,882,930 | ||||
5. Conclusion and Discussion
This study focused on three important traffic patterns (ME/UE, BC/UE, WC/UE) in applying a transportation planning strategy for mixed traffic flows with CAVs and HDVs. The asymmetric interactions of a mixed traffic flow cause multiple UE solutions and past studies focused on searching for the best or worst solutions in terms of total travel time. However, the conditions under which the best and worst cases occur are not addressed significantly, and the maximized entropy patterns most likely to be derived from reality are not discussed. In fact, as a result of Karush–Khun–Tucker conditions and simulation analysis, it is expected that both best and worst cases will be difficult to see in reality. Hence, to determine the effectiveness of transportation planning strategies, it is necessary to compare them with the most actual traffic flow patterns rather than using the best and worst cases, respectively. The comparative analysis of the three traffic patterns discussed in this study will be a significant indicator in determining whether a new transportation planning strategy is applied.
In addition, the application of asymmetric interaction effects due to nearby lanes that can be considered in subsequent studies was discussed. The necessity of considering the effects of nearby lanes was reviewed through similar cases (trucks and passenger cars), and future research direction was proposed by suggesting an analytical approach and a simulation-based approach. The extended PAS-based algorithm proposed in this study is intuitive because it is a simple modification of the algorithm developed in past studies. Hence, it is expected to be expandable by considering additional properties of CAVs, such as the effect of reducing fuel consumption. Moreover, past studies about asymmetric interactions are unsuitable for searching ME/UE because they propose an approach to finding stationary points.
In future studies, it is necessary to propose specific evaluation indicators through various simulation analyses of several transportation planning strategies. In addition, there is a need to supplement the travel time function to express the impact of adjacent lanes better and increase the algorithm’s efficiency to facilitate analysis in more complex networks [25].
Conflicts of Interest
The authors declare that they have no conflicts of interest.
Acknowledgments
This work was supported by the Korea Agency for Infrastructure Technology Advancement (KAIA) grant funded by the Ministry of Land, Infrastructure and Transport (Grant no. 24AMDP-C161756−01).
Appendix
Open Research
Data Availability
The data used to support the findings of this study are included within the article.


