Nonstationary Changes in Annual Rainfall over Indonesia’s Maritime Continent
Abstract
The investigation into changing rainfall patterns in the Indonesian Maritime Continent (IMC) involved testing for trends, step changes, and variance nonstationarity using the Mann–Kendall, Pettitt, and White tests, respectively. The analysis covered data from 106 meteorological stations over the period from 1981 to 2021, with all tests conducted at annual time scales to understand the evolving precipitation dynamics in the region. According to the findings of this study, the average annual rainfall in IMC is nonstationary. Rainfall has increased dramatically by 12.72 mm with a significant shift point in 1994. However, this characteristic is likely to vary if the analysis period is extended, reduced, or conducted in different time frames. The spatial analysis indicates that 35.8% of meteorological stations observed a notable increase in rainfall, while 28.3% experienced a significant shift, and 16% displayed considerable variation. Consequently, the study only partially identified the nonstationary nature of rainfall in the IMC. Moreover, the research highlights a substantial rise in rainfall in the central to eastern IMC region, whereas the central to western region predominantly shows a decrease. This nonstationary test helps avoid errors in climatic conditions and analytical methods, presenting recommendations for hydrological projects. Consequently, employing this nonstationary test helps prevent inaccuracies in understanding climatic conditions and analytical techniques, thereby offering valuable suggestions for hydrological projects.
1. Introduction
Identifying the nonstationary characteristics of rainfall holds crucial importance in the context of climate change, as extensively addressed by the Intergovernmental Panel on Climate Change [1]. Climate experts assert that climate change will impact the hydrological cycle [2], alter rainfall patterns [3], and induce instability or nonstationarity within the climate system [4]. In support of this notion, the authors of [5] stated that climate change serves as a significant driver of climate nonstationarity when there is a notable alteration in the mean (both trend and step change) or a substantial shift in the variance. Such nonstationary shifts in the climate system will profoundly influence the assessment of climate predictions [6]. Hence, it is imperative to ensure, prior to making forecasts, analyses, or verifying climate data, whether the time series data’s characteristics are stationary or nonstationary. Consequently, the chosen analysis approach and anticipated outcomes should align with the prevailing climate conditions. In addition to that, the authors of [5, 6] have conducted a comprehensive study to identify symptoms of climate nonstationary. The study results state that a climate variable’s time series will be considered nonstationary if there is a significant change in the mean (trend and step change) or a significant change in the variance.
The Indonesian Maritime Continent (IMC), located within the tropical zone between Asia and Australia and bounded by the Pacific and Indian Oceans, experiences diverse factors influencing its rainfall patterns. These factors include the Pacific Decadal Oscillation (PDO) [7], El Niño-Southern Oscillation (ENSO), and Indian Ocean Dipole (IOD) climate modes [8–10], as well as the monsoon [11], known as remote forcing. Geographical positioning [12] and local topography [13] also contribute as local forcing mechanisms. However, these driving factors, particularly remote forcing elements, are notably sensitive to climate change, as evident in the PDO [14, 15] and ENSO [16, 17]. Anticipated shifts in rainfall-driving factors due to climate change are expected to impact rainfall characteristics in the IMC, both spatially and temporally, leading to initial observations of nonstationary rainfall. Furthermore, the IMC stands as one of the largest and most influential centers of atmospheric convection globally [18, 19], playing a pivotal role in the equatorial region’s climate system [20]. Changes in rainfall patterns within the IMC can serve as indicators of shifts in climate variability, such as those linked to ENSO.
The objective of this study is to examine how rainfall patterns have changed over the past four decades within the Indonesian Maritime Continent (IMC) region through regional-scale observations. Specifically, the study focuses on analyzing the total accumulated annual rainfall and detecting climatic changes based on nonstationary criteria derived from rainfall data collected across the IMC. What sets this study apart is its aim to demonstrate that the traditional rainfall patterns in the IMC have shifted, resulting in nonstationary conditions. Understanding the nonstationary nature of rainfall is crucial for selecting the most appropriate methodology to evaluate rainfall predictions. Despite ample evidence from previous studies indicating that stationary assumptions are no longer suitable for changing rainfall conditions [21], current methods of evaluating rainfall predictions often rely on these assumptions. Utilizing an incorrect methodology for evaluation could introduce significant uncertainty into the results. In addition, this study utilizes annual rainfall data to analyze nonstationary characteristics, aiming to provide a comprehensive representation of rainfall patterns across the IMC region. While conventional analyses of nonstationarity typically focus on extreme rainfall events, this study points out that such an approach may not fully capture the variability present across the IMC due to its diverse driving factors, resulting in substantial variations in rainfall.
In this study, we aim to identify changes in rainfall patterns using statistical nonstationary criteria, focusing on mean (trend and step change) and variance tests. We utilize rainfall data from The Agency for Meteorology, Climatology, and Geophysics of The Republic of Indonesia (BMKG), covering the period from 1981 to 2021. This timeframe corresponds to two standard periods defined by the World Meteorological Organization (WMO) Climatological Standards Normal (1981–2010 and 1991–2020), which serve as benchmarks for understanding climate variability and assessing climate change perspectives. By combining data from these two normal climate periods, we aim to capture changes occurring across both intervals. The subsequent section will elaborate on the data sources and methodologies employed to derive our results. Furthermore, Section 3 will present and analyze the findings, with the conclusion provided in the final section.
2. Materials and Methods
2.1. Observation Datasets
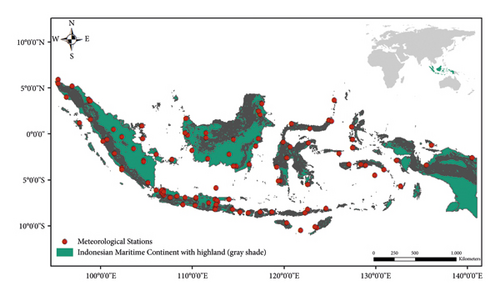
The monthly rainfall data were provided by BMKG. In this study, we analyzed data from 106 meteorological stations (Figure 1) for the period 1981–2021. The rainfall data used in this study correspond to observations previously utilized in studies by [9, 22, 23], although there are differences in the time frames and the number of meteorological stations considered. These stations are situated across the region from west to east. However, limited by topographical constraints and available human resources, meteorological stations in Papua (the easternmost island) are represented by only four stations with the longest continuous data that have undergone quality control (QC). To ensure the robustness of the trend assessment results, a requirement was imposed during the QC process stipulating that the time series data for each station must encompass at least 80% complete years [9].
2.2. Homogeneity and Mann–Kendall Trend Test to Assess Significant Change in Time Series
We employed the Pettitt test [24] to identify any irregularities in the analyzed time series. This test is designed to detect shifts or sudden changes in the mean and evaluate their significance through a hypothesis test. The null hypothesis assumes homogeneity in the data, while the alternative hypothesis suggests the presence of a point where the data exhibits a change [3].
The Mann–Kendall trend test, coupled with Sen’s slope estimator, was employed to assess both the significance and magnitude of identified trends [9, 22]. This approach enables the evaluation of trends within the time series data, utilizing a nonparametric method that effectively eliminates outliers [25].
2.3. Symptom Nonstationary in Variance
- (1)
Given a set of data, obtain the residual, ei, from (1)
- (2)
Run the following auxiliary regression:
() - (3)
Obtain R2 from this auxiliary regression
- (4)
Under H0, there is no heteroscedasticity; it can be shown that the sample size (n) times R2 obtained from the auxiliary regression asymptotically follows the chi-squared distribution with a degree of freedom equal to the number of regressors (excluding the constant term) in the auxiliary regression. From the equation, we have
() - (5)
It is expected that the null hypothesis will be rejected when nR2 exceeds the critical value obtained from chi-square table at a given level of significance.
3. Results
3.1. Annual Trend and Significant Change
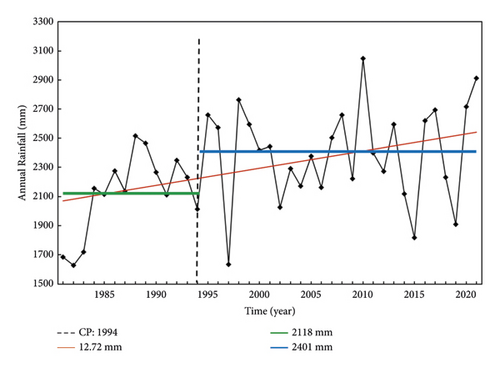
Changes in the mean annual rainfall across the Indonesian Maritime Continent (IMC) exhibit a notably positive or increasing trend over the past four decades, as illustrated in Figure 2. This figure presents the average annual rainfall across all meteorological stations within the IMC region. Our analysis focuses solely on identifying the nonstationary characteristics across the entire area, disregarding the individual trends at each meteorological station. The Mann–Kendall test, conducted at a 95% significance level, indicates a magnitude of approximately 12.72 mm according to Sen’s slope estimator. However, this finding contrasts with the results reported by [9, 22]. Despite utilizing the same dataset from the BMKG, authors of [9, 22] employed different time frames and varied numbers of meteorological stations. The author of [22] utilized 63 meteorological stations, with an average data span of 43.1 years (1950–1997), while [9] utilized 162 meteorological stations with varying record lengths, the longest spanning 43 years (1970–2012). Their findings suggest a significant decrease in annual rainfall trend according to [22] and a nonsignificant decrease according to [9], when averaged across the IMC region.
The records conclude in 1997 [22], coinciding with the powerful El Niño event of that year. Nearly all meteorological stations exhibit a significant decrease in rainfall. However, when the trend is re-evaluated using data for a longer period that extends beyond the El Niño year, as demonstrated in [9], the trend becomes insignificant. Conversely, when the trend is calculated using data extending until 2021, it shows a significant increase. These varying outcomes arise due to differences in the time frames of analysis. The authors of [5] argue that the characteristics of the trend depend significantly on the chosen time frame for analysis. In addition, another explanation for this discrepancy is the post-1997 behavior of the El Niño-Southern Oscillation (ENSO) on the Southern Oscillation Index (SOI) data, which indicates a higher frequency of positive SOI values. The effect of positive SOI values (indicative of La Niña events) in the IMC region correlates with increased rainfall. This diagnosis highlights the crucial impact of ENSO on IMC’s rainfall patterns.
Furthermore, the Pettitt test identified a significant shift in the average, indicating an unexpected climate change. It refers to a sudden transition of the climate system from one stable state to another [28]. The shifts in averages align with a positive trend. This transition occurred in 1994, with average rainfall values of 2,118 mm before 1994 and 2,401 mm after 1994. The climate change in 1994 is attributed to natural factors. This hypothesis is supported by the observed behavior of rainfall in the IMC, which tends to decrease during El Niño events and increase during La Niña events [11]. ENSO, a climate variability phenomenon, has shown changes in behavior, as indicated by [29], with positive SOI occurrences becoming more frequent amid current climate change concerns. This observation is supported by [30], who identified a long-lasting ENSO phenomenon during the period of 1981–2018, particularly during La Niña periods such as 1983–1985, 1998–2000, 2007–2009, 2010–2012, and 2016–2018. In addition, recent SOI data indicate the occurrence of a long-lasting ENSO phenomenon during 2020–2022, all categorized as strong events. According to [30], ENSO events before 2000 were predominantly triggered by local interactions in the Pacific, while those after 2000 tended to be influenced by sea surface temperature (SST) anomalies in the Atlantic and Indian Oceans, which are attributed to global warming-induced warm anomalies. Consequently, changes in rainfall in the IMC can be viewed as an indirect consequence of climate change resulting from global warming, which alters sea surface temperatures and consequently affects ENSO behavior. Furthermore, significant climatic phenomena like ENSO can serve as primary drivers of changes or notable shifts in average annual rainfall in the IMC [31].
When examining the combined or averaged data across the Indonesian Maritime Continent (IMC), utilizing the mean criteria (encompassing trend and step change), the rainfall patterns within the IMC for the period of 1981–2021 are classified as nonstationary. However, this nonstationary mean characteristic is not mirrored in the variance, as indicated by the White test, which did not detect any heteroscedasticity disturbance in the annual average rainfall data for the IMC.
3.2. Spatial Distribution of Trend, Step Change, and Variance
The vast and varied topography of the Indonesian Maritime Continent (IMC) contributes to its status as a region characterized by high rainfall diversity, boasting the world’s largest regional rainfall [19]. The authors of [12] categorized rainfall areas within the IMC into monsoonal, equatorial, and local types. However, these classifications evolved based on observed rainfall conditions from direct land measurements, and author of [32] provided updates on specific seasonal zones within the IMC region for the 1991–2020 period. These three types of rainfall are further subdivided into various subtypes. Monsoonal rainfall is divided into monsoonal subtypes 1 and 2; equatorial rainfall into equatorial subtypes 1, 2, and 4; and local rainfall into local subtypes 1, 2, 4, and 5. The subdivision of these subtypes reflects the heterogeneous nature of rainfall across the IMC. The IMC Season Zone Update Book is accessible at https://iklim.bmkg.go.id/id/detail-bulletin/?tahun= 2022&id=45.
Table 1 presents the outcomes of applying the nonstationary test, providing details for each meteorological station. Specifically, there are 35 meteorological stations displaying a significant increasing trend, 3 stations with a significant decreasing trend, 29 stations exhibiting a significant step change, and 17 stations showing a significant variance. The Mann–Kendall trend test performance is characterized by Z values and the corresponding significance level, while the Pettitt and White tests are represented by P values.
| No | Office ID | BMKG met. st. | Lon. | Lat. | Name of island | Significant value | |||
|---|---|---|---|---|---|---|---|---|---|
| Incr. trend | Decr. trend | Step change | Variance | ||||||
| 1 | 96001 | CUTBAU | 95.35 | 5.87 | Sumatera | −2,190 | 0.022 | ||
| 2 | 96009 | LHOKSEUMAWE | 96.93 | 5.23 | Sumatera | 1,708 | 0.047 | ||
| 3 | 96011 | BLANGBINTANG | 95.42 | 5.52 | Sumatera | 3,381 | 0.002 | 0.022 | |
| 4 | 96015 | CUTNYAKDIEN | 96.25 | 4.05 | Sumatera | 0.044 | |||
| 5 | 96031 | SAMPALI | 98.78 | 3.62 | Sumatera | 2,303 | |||
| 6 | 96033 | BELAWAN | 98.71 | 3.79 | Sumatera | 0.016 | |||
| 7 | 96035 | POLONIA | 98.89 | 3.64 | Sumatera | 0.029 | 0.036 | ||
| 8 | 96073 | SIBOLGA | 98.88 | 1.55 | Sumatera | 0.042 | |||
| 9 | 96075 | BINAKASITOLI | 97.71 | 1.17 | Sumatera | ||||
| 10 | 96091 | TJPINANG | 104.53 | 0.92 | Sumatera | ||||
| 11 | 96109 | PEKANBARU | 101.43 | 0.47 | Sumatera | 0.045 | |||
| 12 | 96163 | TABINGPDG | 100.29 | −0.79 | Sumatera | ||||
| 13 | 96167 | SICINCIN | 100.71 | −0.58 | Sumatera | 0.041 | |||
| 14 | 96171 | RENGAT | 102.32 | −0.33 | Sumatera | ||||
| 15 | 96179 | DABOSINGKEP | 104.58 | −0.48 | Sumatera | 0.021 | |||
| 16 | 96195 | SLTNTAHAJAMBI | 103.64 | −1.63 | Sumatera | ||||
| 17 | 96207 | KERINCI | 101.45 | −2.08 | Sumatera | ||||
| 18 | 96221 | PALEMBANG | 104.7 | −2.90 | Sumatera | ||||
| 19 | 96223 | KENTEN | 104.71 | −3.00 | Sumatera | ||||
| 20 | 96237 | PGKLPINANG | 106.13 | −2.17 | Sumatera | ||||
| 21 | 96249 | BULUHTUMBANG | 107.75 | −2.75 | Sumatera | 0.038 | |||
| 22 | 96253 | BENGKULU | 102.33 | −3.68 | Sumatera | ||||
| 23 | 96255 | PBAAIBENGKULU | 102.32 | −3.87 | Sumatera | ||||
| 24 | 96295 | RADENINTEN | 105.18 | −5.27 | Sumatera | −2,280 | 0.014 | 0.042 | |
| 25 | 96509 | TARAKAN | 117.57 | 3.33 | Kalimantan | ||||
| 26 | 96529 | TJREDEP | 117,433 | 2.15 | Kalimantan | 3,078 | 0.000 | ||
| 27 | 96535 | PALOH | 109.3 | 1.74 | Kalimantan | ||||
| 28 | 96557 | NANGAPINOH | 111.47 | −0.42 | Kalimantan | 3,023 | 0.024 | ||
| 29 | 96559 | SINTANG | 111.47 | 0.06 | Kalimantan | ||||
| 30 | 96581 | SUPADIO | 109.45 | −0.14 | Kalimantan | 2,230 | 0.037 | ||
| 31 | 96583 | SIANTAN | 109.19 | 0.08 | Kalimantan | ||||
| 32 | 96595 | MUARATEWEH | 114.53 | −0.56 | Kalimantan | 1,900 | |||
| 33 | 96607 | SAMARINDA | 117.16 | −0.48 | Kalimantan | 2,752 | 0.000 | 0.040 | |
| 34 | 96615 | KETAPANG | 109.97 | −1.80 | Kalimantan | ||||
| 35 | 96633 | SEPINGGAN | 116.9 | −1.26 | Kalimantan | ||||
| 36 | 96645 | PANGKALANBUN | 111.66 | −2.73 | Kalimantan | ||||
| 37 | 96655 | PALANGKARAYA | 113.95 | −2.22 | Kalimantan | 0.026 | |||
| 38 | 96685 | SYAMSUDINNOOR | 114.76 | −3.45 | Kalimantan | ||||
| 39 | 96687 | BANJARBARU | 114.48 | −3.46 | Kalimantan | ||||
| 40 | 96695 | STAGENKOTABARU | 116.17 | −3.30 | Kalimantan | ||||
| 41 | 96525 | TJSELOR | 117.22 | 2.50 | Kalimantan | 1,915 | 0.018 | ||
| 42 | 96733 | PDKBETUNG | 106.75 | −6.26 | Jawa | ||||
| 43 | 96737 | SERANG | 106.11 | −6.11 | Jawa | ||||
| 44 | 96739 | CURUG | 106.57 | −6.29 | Jawa | ||||
| 45 | 96741 | TJPRIUK | 106.88 | −6.11 | Jawa | 2,011 | 0.020 | ||
| 46 | 96745 | KEMAYORAN | 106.84 | −6.16 | Jawa | 0.018 | |||
| 47 | 96749 | CENGKARENG | 106.65 | −6.12 | Jawa | 2,079 | |||
| 48 | 96751 | CITEKO | 106.85 | −6.70 | Jawa | 1,832 | 0.021 | ||
| 49 | 96753 | DARMAGA | 106.75 | −6.50 | Jawa | ||||
| 50 | 96783 | GEOFBANDUGN | 107.6 | −6.88 | Jawa | ||||
| 51 | 96791 | JATIWANGI | 108.27 | −6.75 | Jawa | ||||
| 52 | 96797 | TEGAL | 109.15 | −6.85 | Jawa | ||||
| 53 | 96805 | CILACAP | 109.02 | −7.73 | Jawa | ||||
| 54 | 96835 | SEMARANGKLIM | 110.42 | −6.98 | Jawa | ||||
| 55 | 96839 | AYANISEMARANG | 110.38 | −6.89 | Jawa | ||||
| 56 | 96845 | YOGYA | 110.3 | −7.82 | Jawa | −2,168 | |||
| 57 | 96925 | BAWEAN | 112.63 | −5.85 | Jawa | ||||
| 58 | 96933 | PERAKI | 112.46 | −7.13 | Jawa | 0.029 | |||
| 59 | 96935 | JUANDA | 112.77 | −7.37 | Jawa | ||||
| 60 | 96937 | PERAKII | 112.74 | −7.21 | Jawa | 0.047 | |||
| 61 | 96943 | KRGPLOSO | 112.6 | −7.90 | Jawa | 3,266 | 0.001 | 0.042 | |
| 62 | 96945 | TRETES | 112.64 | −7.70 | Jawa | 0.036 | |||
| 63 | 96949 | KARANGKATES | 112.45 | −8.15 | Jawa | 1,915 | 0.023 | ||
| 64 | 96973 | KALIANGET | 113.97 | −7.05 | Jawa | ||||
| 65 | 96975 | NGANJUK | 111.79 | −7.47 | Jawa | 2,748 | 0.002 | ||
| 66 | 96987 | BANYUWANGI | 114.35 | −8.21 | Jawa | ||||
| 67 | 96747 | HALIM | 106.9 | −6.25 | Jawa | ||||
| 68 | 97008 | NAHA | 125.51 | 3.68 | Sulawesi | 2,381 | 0.017 | ||
| 69 | 97012 | MANADO | 124.9 | 1.50 | Sulawesi | 1,696 | |||
| 70 | 97014 | SAMRATULANGI | 124.92 | 1.53 | Sulawesi | ||||
| 71 | 97016 | BITUNG | 125.18 | 1.44 | Sulawesi | ||||
| 72 | 97028 | TOLITOLI | 120.79 | 1.12 | Sulawesi | ||||
| 73 | 97048 | GORONTALO | 122.83 | 0.63 | Sulawesi | 1,763 | |||
| 74 | 97072 | PALU | 119.91 | −0.92 | Sulawesi | ||||
| 75 | 97086 | LUWUK | 122.72 | −1.04 | Sulawesi | 2,999 | 0.005 | ||
| 76 | 97096 | POSO | 120.73 | −1.38 | Sulawesi | 1,786 | |||
| 77 | 97120 | MAJENE | 119.2 | −3.56 | Sulawesi | ||||
| 78 | 97126 | MASAMBA | 120.32 | −2.55 | Sulawesi | 1,887 | |||
| 79 | 97180 | MAKASSAR | 119.55 | −5.07 | Sulawesi | ||||
| 80 | 97182 | PAOTERE | 119.42 | −5.11 | Sulawesi | 2,876 | 0.002 | ||
| 81 | 97192 | BAUBAU | 122.62 | −5.47 | Sulawesi | 2,876 | |||
| 82 | 97230 | NGURAHRAI | 115.17 | −8.48 | Bali | ||||
| 83 | 97240 | SELAPARANG | 116.11 | −8.55 | NTB | ||||
| 84 | 97260 | SUMBAWA | 117.43 | −8.52 | NTB | ||||
| 85 | 97270 | SALAHUDDINBIMA | 118.69 | −8.54 | NTB | ||||
| 86 | 97300 | MAUMERE | 122.25 | −8.63 | NTT | 0.026 | |||
| 87 | 97310 | LARANTUKA | 122.59 | −8.16 | NTT | 2,352 | 0.012 | ||
| 88 | 97320 | MALIKALABAHI | 124.59 | −8.13 | NTT | ||||
| 89 | 97340 | WAINGAPU | 120.33 | −9.67 | NTT | ||||
| 90 | 97374 | LASIANA | 123.6 | −10.17 | NTT | 1,675 | 0.021 | ||
| 91 | 97372 | ELTARIKUPANG | 123.4 | −10.10 | NTT | ||||
| 92 | 97380 | TARDAMUSABU | 121.83 | −10.50 | NTT | ||||
| 93 | 97406 | GALELA | 127.5 | −1.49 | Maluku | 0.030 | 0.043 | ||
| 94 | 97430 | TERNATE | 127.38 | 0.83 | Maluku | ||||
| 95 | 97460 | LABUHA | 127.5 | −0.64 | Maluku | 4,259 | 0.000 | ||
| 96 | 97600 | SANANA | 126 | −2.05 | Maluku | 2,067 | |||
| 97 | 97700 | NAMLEA | 127.08 | −3.25 | Maluku | 2,168 | 0.025 | ||
| 98 | 97722 | AMAHAI | 128.88 | −3.35 | Maluku | 1,910 | |||
| 99 | 97726 | KAIRATU | 128.4 | −3.25 | Maluku | 1,876 | |||
| 100 | 97748 | GESER | 130.88 | −3.88 | Maluku | 2,135 | 0.042 | ||
| 101 | 97790 | BANDANAIRA | 129.9 | −4.52 | Maluku | 4,118 | 0.005 | ||
| 102 | 97810 | TUAL | 132.73 | −5.66 | Maluku | ||||
| 103 | 97560 | BIAK | 136.1 | −1.19 | Papua | ||||
| 104 | 97630 | FAKFAK | 132.25 | −2.88 | Papua | 1,797 | 0.049 | ||
| 105 | 97682 | NABIRE | 135.52 | −3.35 | Papua | 3,325 | 0.004 | ||
| 106 | 97690 | SENTANI | 140.48 | −2.57 | Papua | 2,055 | 0.002 | ||
- Note. Significant value for trend: >±1.7; step change: <0.05; and variance: <0.05.
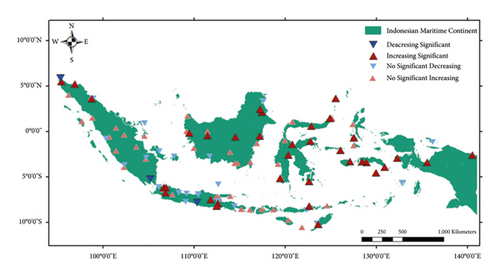
Spatial analysis results of the nonstationary test across the IMC region reveal spatial variations. Figure 3(a) illustrates the spatial distribution of rainfall trends. Notably, 35.8% of rainfall in the IMC exhibits a significant increase (depicted by upward triangles in dark red), aligning with the overall trend across the IMC. The predominant increase in trend is observed in the central to eastern IMC region. Conversely, in the central to western IMC region, particularly on Java and Sumatra islands, increasing rainfall trends are confined to the eastern and western regions of Java and the North Sumatra area. In island areas like Bali and West Nusa Tenggara, trends tend to fluctuate and lack significance, whereas East Nusa Tenggara experiences a noteworthy increase in rainfall trends.
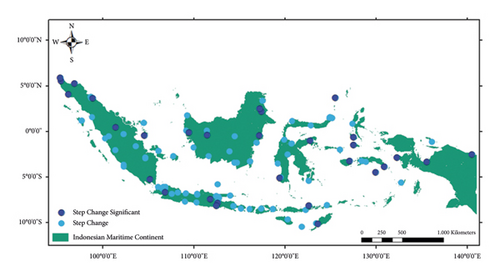
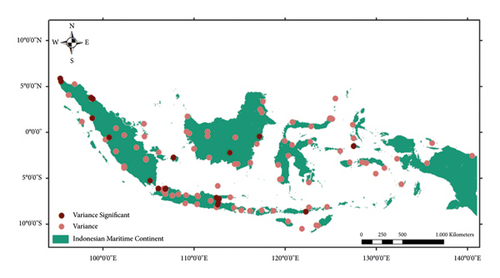
The significant step change variation accounts for 28.3%, with its distribution pattern closely resembling that of the significant rainfall trend increase (see Figure 3(b)). Dark blue points on the map highlight areas experiencing significant average shifts. On the other hand, the distribution pattern of significant variance covers 16% (see Figure 3(c)). However, this distribution pattern does not mirror the trends or significant step changes.
The spatial analysis results of the nonstationary test across the IMC region indicate a general significant increase in rainfall trends, with significant step changes or abrupt changes mostly aligning with the increasing rainfall trend. Some areas within the IMC exhibit significant variation, albeit not as prevalent as the significant trend and step change. However, the occurrence of trend, step change, and variance doesn’t consistently correspond across all observation points or meteorological stations. This spatial variation appears to be random, lacking a discernible pattern except for the trend test, which consistently reveals significant increases in the middle to eastern IMC region. It’s important to note that this analysis is based solely on annual rainfall data and overlooks monthly and seasonal variations. To further enhance our understanding, a longer data period would be necessary. Further research is warranted to elucidate why rainfall patterns vary more significantly in some meteorological stations compared to others.
3.3. Nonstationary in Trend, Step Change, and Variance
Figure 4 presents a comprehensive analysis of the nonstationary test results for each meteorological station. The analysis indicates a consistent pattern where significant step changes typically coincide with significant trends. Specifically, 24 meteorological stations consistently exhibit significant alterations in both trend and step change, spanning from west to east (represented by dark brown upward triangles). Notably, the Cutbau meteorological station in North Sumatra stands out with downward triangles in purple, indicating a decreasing trend and step change.
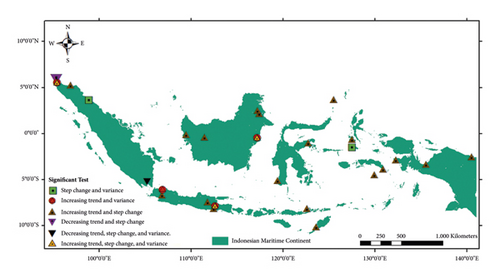
Moreover, four meteorological stations show only an increasing trend and variance (depicted by red circles), while two stations exhibit significant changes solely in step change and variance (shown as green boxes). In addition, significant alterations in trend, step change, and variance are observed in four regions: North Sumatra, East Java, East Kalimantan (illustrated by light brown upward triangles), and South Sumatra (depicted by black downward triangles).
We observe distinctive conditions within the Sumatra region, characterized by inconsistency, particularly in rainfall patterns where significant changes are lacking. According to BMKG [32], these areas are classified into monsoonal and equatorial types, influenced by various rainfall-driving factors like ENSO, IOD, MJO, and ITCZ. In addition, topographic features and daily cycles contribute to rainfall variability in this area. Depending on the circumstances, these phenomena can either reinforce or counteract each other, resulting in the region appearing relatively unaffected by shifting environmental conditions. To substantiate this hypothesis, a comprehensive examination of monthly data and their correlation with historical occurrences of ENSO, IOD, MJO, and ITCZ is necessary.
In Figure 4, we observe inconsistent trends within a small area of North Sumatra. The Cut Bau Meteorological station exhibits a significant downward trend, while Lhokseumawe shows an upward trend (denoted by a downward triangle in blue and an upward triangle in dark red, respectively, at the top of Sumatra island). Unlike the unique conditions observed in the Sumatra area, these discrepancies in the two meteorological stations likely stem from distinct local conditions, given their geographical separation by the ocean. Cutbau is situated on a small island, whereas Lhokseumawe is part of the larger Sumatra Island.
Furthermore, the spatial variation in the IMC resulting from the nonstationary test reveals heterogeneous rainfall patterns, although inconsistent with established knowledge [12]. Nonetheless, a discernible pattern emerges from this test, particularly concerning trends and step changes. In the middle to eastern IMC, trends exhibit an increase, while step changes undergo significant alterations. This condition can be attributed to the primary driving factor of rainfall in this region, namely, the proximity to the Pacific Ocean and the influence of ENSO.
Based on SOI data (accessible at https://www.ncei.noaa.gov/access/monitoring/enso/soi), the IMC area experienced more frequent occurrences of negative SOI (El Niño) phenomena before 1998. Conversely, after 1998, the region was more frequently affected by positive SOI (La Niña) phenomena. Therefore, this observed condition appears quite reasonable. Consequently, the results of spatial variation suggest that changes in rainfall within the IMC are partial, with some areas experiencing significant changes while others remain unaffected.
4. Discussion
Figure 5 depicts a scatter plot combining trends and change points. Each spread circle represents a change point, with a Z value indicating the year (where Z+ signifies an increase and Z− signifies a decrease). Upon examining Figure 5, it becomes apparent that the majority of meteorological stations exhibit an increasing trend, accounting for approximately 75.6% of all stations. Within this depiction, 33% display a significant increasing trend, while only 2.8% show a significant decreasing trend (denoted by a red dot). Furthermore, a significant proportion of change points with notable trends (43.2%) occurred during the period from 1990 to 1998. This observation suggests the potential occurrence of a climatic shift in the IMC during the analyzed timeframe spanning from 1981 to 2021. However, it’s important to acknowledge that the possibility of climatic shift may vary when using different time frames.
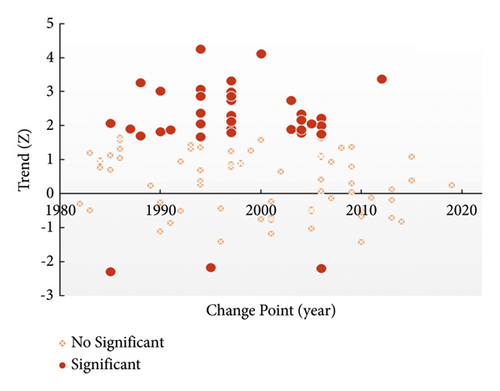
This identification provides valuable insights into climatic shifts in annual rainfall within the IMC, which largely hinge on driving factors. As discussed in the previous literature [22, 33–35], the period from 1990 to 1998 witnessed extreme ENSO events, with the peak occurring during the 1997/1998 El Niño event. The author of [34] argues that the El Niño events during 1997/1998 were not only the most intense but also the most peculiar in modern observational records. Nearly all meteorological stations experienced decreased rainfall during the 1997/1998 El Niño event, resulting in a statistically significant change in the time series.
Moreover, ENSO, as highlighted by [17], is a formidable climatic phenomenon with far-reaching impacts on global weather patterns, exerting distinct teleconnection influences on regional climates. Notably, ENSO has emerged as a significant driving force behind rainfall variations in the IMC, contributing to the establishment of nonstationary rainfall patterns in the region, albeit to a partial extent.
The outcomes of this study indicate noticeable shifts in annual rainfall across the IMC, characterized by significant upward trends and step changes. However, it is crucial to consider two key points. Firstly, these changes exhibit partial characteristics, as evidenced by both the symptoms of nonstationarity (as depicted in Figure 2) and the spatial distribution patterns (illustrated in Figures 3 and 4). Secondly, the choice of analysis timeframe significantly influences the findings [9, 22]. These insights gleaned from this preliminary analysis offer valuable directions for future research endeavours. Specifically, they underscore the importance of selecting data from global models that closely align with the IMC’s rainfall features, accounting for its nonstationarity. In addition, the variable nature of nonstationarity across different spatial and temporal dimensions emphasizes the need to consider these factors when defining the typical characteristics of rainfall in the IMC.
5. Conclusions
This research examined alterations in rainfall patterns using nonstationary criteria, focusing on mean (trend and step change) and variance parameters. The analysis encompassed annual rainfall data collected from 106 meteorological stations across the IMC, with an average data span of approximately 40 years per station. All datasets underwent rigorous quality control measures and were deemed suitable for analysis.
A significant discovery of this study is the observed change or nonstationarity in rainfall across the IMC, particularly evident in the central to eastern regions, as indicated by the trend and step change criteria. In these areas, annual rainfall exhibited a noteworthy increase. Conversely, the western IMC, notably Sumatra and Java Island, displayed more heterogeneous rainfall patterns, with some areas experiencing increases while others showed decreases. This investigation suggests that nonstationary rainfall in the IMC is only partially occurring.
Based on our study, we conclude that the primary driver of nonstationary rainfall in the IMC is likely attributable to remote forcing factors, particularly ENSO. We observed that abrupt changes in rainfall align with shifts in ENSO-related variables. Prior to 2000, ENSO occurrences were primarily influenced by local interactions in the Pacific Ocean, whereas post-2000, ENSO events tended to be triggered by anomalies in sea surface temperatures (SST) in the Atlantic and Indian Oceans, which are linked to global warming. Furthermore, the results of this study also provide major input in evaluating rainfall predictions. By considering nonstationary rainfall in IMC, we can consider the appropriate method for conducting evaluations, whether to use nonstationary evaluation methods or carry out partial evaluations according to the characteristics of each region. Consequently, the outcomes of this research can serve as valuable guidance for further studies, particularly those involving hydrological projects that require accurate representation of current rainfall conditions. It’s recommended to ensure consistency in the analysis period to facilitate meaningful comparisons across studies.
Conflicts of Interest
The authors declare that there are no conflicts of interest regarding the publication of this article.
Authors’ Contributions
GGS drafted the initial manuscript and statistical analysis. TWH revised and improved the overall manuscript including the storyline and discussion. NSN and AS performed further revisions of the manuscript. MRS carried out statistical data processing. FM supported and edited the manuscript. All authors were involved in discussion during the review process and all authors have read and approved the final manuscript.
Acknowledgments
The authors acknowledge The Agency for Meteorology, Climatology, and Geophysics, Republic of Indonesia (BMKG), for facilitating the data of rainfall stations. This manuscript contains material from a dissertation by GGS, as a part of the fulfillment to obtain a doctoral degree at Bandung Institute of Technology. The authors would like to express their gratitude to the Center for Education and Training of BMKG for funding this research (Grant Number PDL BMKG: HK.08.00/021/KDL/VI/2020 and FITB, ITB: 965/IT1.C01/KS/2020).
Open Research
Data Availability
The meteorological station data can be accessed through BMKG, which stands for The Agency for Meteorology, Climatology, and Geophysics of the Republic of Indonesia. This information is available at https://dataonline.bmkg.go.id/home.


