Securing Microservices-Based IoT Networks: Real-Time Anomaly Detection Using Machine Learning
Abstract
Increased attention is being given to Internet of things (IoT) network security due to attempts to exploit vulnerabilities. Security techniques protecting availability, confidentiality, and information integrity have intensified as IoT devices are viewed as gateways to larger networks by malicious actors. As an additional factor, the microservices-based platforms have overtaken the deployment of applications that support smart cities; however, the distributed nature of these architectures heightens susceptibility to malicious network infrastructure use. These risks can result in disruptions to system functioning or data compromise. Proposed strategies to mitigate these risks include developing intrusion detection systems and utilizing machine learning to differentiate between normal and anomalous network traffic, indicating potential attacks. This article outlines the development and implementation of an intrusion detection system (IDS) using machine learning to detect online anomalies in network traffic. Comprising a traffic extractor and anomaly detector, the system employs supervised learning with various datasets to train models. The results demonstrate the effectiveness of the decision tree model in detecting traditional denial of service (DoS) attacks, achieving high scores across multiple metrics: an F1-score of 98.08%, precision of 99.25%, recall of 96.96%, and accuracy of 99.62%. The random forest model excels in identifying slow-rate DoS attacks, attaining an F1-score of 99.85%, precision of 99.91%, recall of 99.80%, and accuracy of 99.88%.
1. Introduction
In general, the platforms that support smart city applications integrate Internet of things (IoT) networks to monitor and manage different processes within a city. These platforms have evolved from centralized architectures (monoliths) to distributed architectures since the latter offers several advantages, such as easy scalability and application improvement [1, 2]. One of these architectures is based on microservices, which facilitates the distribution and balancing of the computational load between different resources, allows easy integration of new services, and allows rapid scaling according to needs [3–6].
In a microservices architecture, large applications consist of small autonomous components that perform a specific function within the application. Microservices can generally be developed and deployed independently [7]. This type of architecture has advantages, such as reducing development time, as they are generally more straightforward, can be executed separately, and are easily reusable [8, 9]. Furthermore, each microservice can be developed in different programming languages, enabling code reuse and choice of the most appropriate language for a specific function [7]. A key advantage is the ease of error correction, as the malfunctions can be quickly isolated and debugged without affecting the operation of other microservices in the application. In addition, deployment can be performed in lightweight environments as microservices generally require few resources for execution [10].
However, despite the significant advantages of these distributed architectures, there may be greater risks associated with data and information security. Among the problems associated with security are vulnerabilities in containers since deploying microservices using this resource is prevalent. These vulnerabilities can result in risks such as denial of service (DoS) attacks, kernel leaks, and malicious images that could potentially damage or alter network’s and system’s files [2, 11, 12].
The independence and diversity of microservice-based applications can introduce new challenges for data security. For example, the fragmentation of data across different datasets and systems, combined with communication through APIs, can make it more challenging to protect and manage sensitive information [2, 11, 13]. In addition, when microservices are implemented in a cloud environment, there can be problems with data security, especially when using public clouds, as information can be intercepted by unauthorized entities, compromising the system’s security [2, 11, 14]. Similarly, there may be associated security problems in devices connected to IoT networks if they lack the necessary resources to implement authentication algorithms and effective encryption [2, 11, 15, 16], leaving the system vulnerable to attacks. Finally, because microservices are deployed in a distributed environment, intruders could take control of certain services, maliciously influencing others.
In this context, a distributed architecture increases the critical points through which an attacker can gain unauthorized access. Therefore, one of the crucial challenges is developing effective strategies to control access to the different services interconnected in an IoT platform that users need to use.
There are many network attacks aimed at exploiting system weaknesses. A network service can be affected by generating many requests to the victim machine, causing the system to crash and stop working, preventing legitimate users from accessing services, known as denial of service. Within DoS attacks, two types can be identified: traditional ones that aim to quickly overload a system with massive traffic [17] and slow-rate ones that take a more stealthy and constant approach, seeking to deplete system resources with low-intensity malicious traffic [18]. Both attacks pose significant threats to online service availability and network security. All this malicious traffic generated can be considered an unusual behavior for the network. Consequently, detecting such behavior is vital as it allows alerts to be generated in case of possible intrusions into the system.
Therefore, as a solution, we propose to develop a network intrusion detection system (IDS) based on real-time anomaly identification in this work. This system monitors and analyzes packets moving through a network to detect normal or abnormal activity related to possible attacks. It does this by examining patterns in network traffic using machine learning techniques. The anomaly detector is based on microservices that can be accessed through APIs, allowing data preprocessing and prediction. In addition, the system uses datasets from BoT-IoT [15, 19] UNSW-NB15 [20], and a dataset created through a test scenario in which the performance of the model is evaluated. These datasets are utilized to train machine learning classifiers, such as decision trees, random forests, logistic regression, and support vector machines (SVMs), for recognizing malicious network traffic.
The intrusion detection system, which is based on a microservices architecture, has several advantages, as it can be deployed at various points in the network. Multiple anomaly detection microservices can operate simultaneously in this configuration, enabling faster and more efficient data stream analysis. Each microservice is responsible for examining a specific network segment, which increases processing capacity and speeds up intrusion detection.
Distributing microservices across multiple network locations accelerates data analysis and strengthens the system. Microservices can continue to evaluate the flow of network packets without interruption, even if one of them fails. Thanks to the ability of the other microservices to take over the load and preserve the system’s operation, this capability ensures that the intrusion detection system is not affected by a single failure.
An outstanding advantage of installing an anomaly detector using microservices is the ease of deployment at specific points in the network for data flow analysis. Installing a network traffic extractor at the desired point is only necessary if it can send the data to the processing microservices. This mode of operation allows the edge devices to be used as network packet capture points, enabling multiple analysis nodes in the architecture without requiring significant computational resources from these devices. This approach allows for the most rigorous and exhaustive analysis to be performed on a server with higher computational capacity.
- (i)
The development of an anomaly detection system, that follows a microservices architecture, finely tuned for online detection of typical and slow-rate DoS attack types
- (ii)
The structuring of a dataset that comprises data from well-known datasets and data collected locally in a real scenario
- (iii)
The proposal of an experimental environment with real equipment running microservices-based applications protected by the online anomaly detection system
The remainder of the paper is organized as follows. Similar works that utilize ML-based techniques for detecting cyberattacks are displayed in Section 2. The methodology used to develop and implement an anomaly detection system in IoT networks using machine learning techniques is described in Section 3 of this paper. The results are obtained, and their discussions are presented in Section 4. Finally, Section 5 includes the conclusions and future work.
2. Related Work
The OWASP (Open Web Application Security Project) periodically publishes a reference document that describes the top 10 security risks. For 2021, access control is on this list, occupying the number one position, showing that it is one of the principal vulnerabilities in today’s applications [21].
Access control is used to authorize the use of a microservice resource. It uses policies to describe how and under what circumstances a user can access those resources. It is a crucial component of microservice network security, ensuring that resources are not illegally accessed or used [22]. Typically, this involves authentication and authorization methods, such as usernames and passwords or digital certificates. However, intruders can exploit system architecture weaknesses and circumvent these authentication and authorization mechanisms [2]. Incorporating an intrusion detection system is one strategy to provide a comprehensive network security approach. This system identifies and alerts administrators to unauthorized access, misuse, modification, or denial of network resources. It operates by continuously monitoring network traffic and analyzing data for suspicious activity.
An intrusion detection system can use anomaly detection techniques as part of its overall approach to identifying security threats. For example, an IDS might monitor network traffic and flag any unusual behavior, such as a sudden spike in network traffic, as a possible security breach.
IoT systems must implement adequate security mechanisms, as evidenced by over 100 million attacks targeting IoT devices in the first half of 2019 [23]. Consequently, some researchers have chosen to study intrusion detection systems in the IoT world. For example, Zeeshan et al. [24] proposed an architecture for intrusion detection based on deep learning. The dataset consists of application and transport layer (TCP) traffic packets in an IoT network, and the UNSW-NB15 and BoT-IoT datasets were used. The architecture classifies traffic into nonanomalous denial of service attacks or distributed denial of service attacks, achieving an adjustment of the recurrent neural network model to obtain an accuracy of 96.3%.
On the other hand, Leevy et al. [25] focused on developing predictive models specifically designed to detect information theft attacks. They built classifiers including CatBoost [26], LightGBM [27], XGBoost [28], random forests [29], decision trees [30], logistic regression [31], Naive Bayes [31], and multilayer perceptron [32]. These classifiers were trained and tested using the BoT-IoT dataset, extracting only samples of normal traffic and those associated with information theft attacks. The evaluation of the models is carried out using two performance metrics: the area under the precision-recall curve and the area under the ROC curve. As a result, the LightGBM model exhibits the best performance, scoring 0.99 for both metrics. However, the models presented by Zeeshan et al. and Leevy et al. are not implemented in a realistic scenario to evaluate their effectiveness in online anomaly detection.
Generally, IoT networks have devices with low computational power, which is a drawback when implementing high-complex intrusion detection mechanisms since they need more memory or processing power to execute such models. In this approach, Mirsky et al. [33] proposed an intrusion detection system based on neural networks designed to detect anomalous patterns in network traffic efficiently. The system observes the statistical patterns in recent network traffic and identifies unusual patterns using autoencoders, which allow for a compact representation of input data. Each autoencoder in the system is responsible for detecting anomalies related to a specific aspect of network behavior. This system can even be implemented on a single-board computer such as the Raspberry Pi, making it practical and cost-effective to provide IoT gateway defense. On the other hand, the authors Popoola et al. [34] used deep learning techniques to reduce the dimensionality of feature data containing information on IoT network traffic and built a deep learning-based classifier using this feature reduction. The output of the classifier can be binary or multiclass. They use the BoT-IoT dataset to develop and validate the model and conduct experiments to select the most suitable optimizer for better performance classification using the Matthews correlation coefficient (MCC), which is used for highly imbalanced data. The results show that the model significantly reduced the memory space required for storing large-scale network traffic data by 91.89% and achieved a classification performance of over 93%.
Attackers sometimes use networks of computer robots, also known as botnets, which can be remotely controlled to carry out various malicious activities. The researchers Koroniotis et al. [15] applied machine learning and deep learning techniques to classify packets traveling through IoT devices and microservices networks. This classification can be binary or multiclass. To train these models, the researchers constructed a dataset called BoT-IoT, creating a realistic scenario using virtual machines that simulate IoT devices, attacker machines, and normal network traffic.
Previously reported related work on intrusion detection has used monolithic architectures for implementation, which can limit the scalability and flexibility of the system. This work incorporates an innovative approach by developing its components in a microservices architecture, enabling an efficient distribution of tasks and resources. This approach results in a more scalable and adaptable system, especially as the network traffic load increases.
Table 1 shows the performance metrics used to evaluate the model’s accuracy in the previously mentioned research works.
In most of the referenced works, attack detection is performed offline, meaning that network traffic is analyzed after the events have occurred, using datasets constructed from the network flow to create machine learning models and test models. This work aims to perform online detection of anomalous traffic that can be used to generate early alerts to application administrators, enabling corrective actions to be taken.
3. Methodology
Our online anomaly detection method over an IoT network is developed in three main phases: implementation of a test scenario in which the machine learning models can be validated through different performance metrics, offline training for the construction of the machine learning models, and finally, the development and implementation of the online anomaly detection system in the network traffic. Considering good practices for running experiments is crucial for ensuring the reliability and validity of research findings, and it is important to highlight the significance of methodological rigor in experimental design and execution within the domain of IDS design, where reproducibility and validity are vital for accurate performance evaluation and to ensure the robustness of findings [35, 36]. The following sections detail each of the phases.
3.1. Implementation of the Test Scenario
As a first phase, for the development of the online anomaly detection system, a network infrastructure is built, as shown in Figure 1, which consists of a victim machine, a network traffic extractor, an anomaly detector for network traffic, and attacker machines.
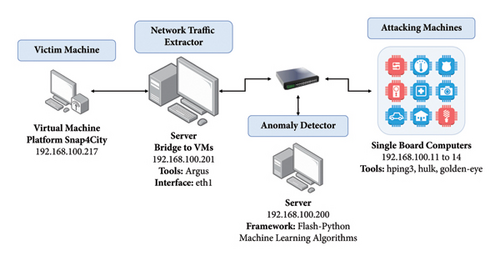
The network infrastructure for testing the online anomaly detection system is composed of the following components.
3.1.1. Victim Machine
This virtual machine is the target of attackers in the test scenario. The IoT platform based on microservices Snap4City [3] has been installed on this machine. Normal traffic is generated on this machine by simulating IoT nodes that transmit random data every 5 and 10 seconds, which can be viewed through a user interface. In addition, HTTP requests are made to microservices deployed on another server using a Python script.
3.1.2. Network Traffic Extractor
It is responsible for real-time monitoring and analyzing network traffic to obtain the attributes or characteristics of network flows. Each network flow consists of a group of packets that hold the same origin and destination IPs and ports. The Argus tool [37] is used for this purpose. Argus is an open-source tool with an active community of developers and users, providing access to ongoing development, support, and documentation along with tools such as CICFlowMeter are alternatives that are widely used for feature extraction in industry and research. The dataset used as a starting point for this work used Argus as a feature extraction tool due to its level of granularity that allows an in-depth examination of network behavior in real time. The server where the traffic extractor is deployed also serves as a network bridge to capture the packet flow that travels to and from the victim machine.
3.1.3. Anomaly Detector
It is responsible for identifying anomalies attributable to an attack through the analysis of patterns in network traffic using machine learning models. The anomaly detector is deployed on this machine, developed under a microservices-based architecture using containers.
3.1.4. Attacker Machines
A cluster of single-board computers is used to carry out traditional and slow-rate DoS attacks on the victim machine. Each of the computers has been equipped with attack tools such as Hping3 [38], GoldenEye [39], Hulk [40], and Slowloris [41]. Using single-board computers (SBCs) to emulate attacker nodes provides a cost-effective, flexible, and accessible solution for testing and validating intrusion detection systems (IDSs). Leveraging SBCs to emulate attacker nodes in IDS development, especially in the absence of a deployed edge network, ensures continuity of development, enables simulation of future scenarios, and validates IDS functionality.
3.2. Offline Training of the Models
In this second phase, the machine learning models are built offline using the Python programming language’s libraries NumPy, Pandas, and Scikit-Learn. This process involves three fundamental stages: data selection, data preprocessing, and training and evaluation of machine learning models. These stages are described as follows.
3.2.1. Selection of Data for Training
-
BoT-IoT and UNSW-NB15: they are datasets created by researchers at the University of New South Wales (Australia) and are widely used to detect attacks in IoT networks. BoT-IoT consists of several sets and subsets that vary in size, format, and number of features. For this work, a smaller and more manageable subset, equivalent to 5% of the dataset, was chosen [15]. The UNSW-NB15 dataset was published in 2015 [20] and has 2,540,047 records and nine types of attack families. Table 2 shows the distribution of records in the BoT-IoT dataset associated with the 5% subset and in UNSW-NB15.
-
Custom dataset: under the testing scenario’s implemented conditions, a custom dataset is created containing information about the network packets of the infrastructure [42]. Traditional DoS attacks are performed every 15 minutes, using the attack tools Hping3, GoldenEye, and Hulk. Labeling in the dataset is facilitated by keeping track of the attacking machines by identifying the source of the malicious activity. In total, the dataset contains 3,595,500 records, and Table 3 shows the data distribution.
The imbalance between normal and attack samples in the dataset is due to the periodic execution of denial of service (DoS) attacks every 15 minutes during the test scenario. These attacks generated a large amount of network data associated with malicious activities, resulting in a significant proportion of samples labeled as “attack” in the custom dataset.
| Class | Number of records BoT-IoT | Number of records UNSW-NB15 |
|---|---|---|
| Normal | 643 | 2,218,764 |
| Attack | 3,667,879 | 321,283 |
| Total | 3,668,522 | 2,540,047 |
| Class | Number of records |
|---|---|
| Normal | 341,423 |
| Attack | 3,254,077 |
| Total | 3,595,500 |
Furthermore, another dataset was constructed to store detailed information about network packets associated with slow-rate DoS attacks [42]. These attacks were conducted at 15-minute intervals within the designed test scenario, using the Slowloris attack tool, resulting in a dataset comprising 118,500 records. The distribution of these records is presented in Table 4. This data collection and organization process is essential for comprehending and evaluating slow-rate attack detection.
| Class | Number of records |
|---|---|
| Normal | 73,650 |
| Attack | 44,850 |
| Total | 118,500 |
The open-source tool Argus [37] collects all the data packets and extracts the features that describe them. Table 5 shows the list of features and their description; the first 15 features were obtained from the Argus tool and the remaining 12 features were calculated from the former ones.
| No | Feature | Description |
|---|---|---|
| 1 | stime | Connection start time |
| 2 | proto_number | Numerical representation of the protocol used in the network flow |
| 3 | saddr | Source IP address |
| 4 | Sport | Source port number |
| 5 | daddr | Destination IP address |
| 6 | dport | Destination port number |
| 7 | pkts | Total number of packets in the transaction |
| 8 | bytes | Total number of bytes in the transaction |
| 9 | state_number | Numerical representation of the transaction state |
| 10 | ltime | Connection finish time |
| 11 | dur | Total connection duration |
| 12 | spkts | Number of packages from source to destination |
| 13 | dpkts | Number of packages from destination to source |
| 14 | sbytes | Number of bytes from source to destination |
| 15 | dbytes | Number of bytes from destination to source |
| 16 | TnBPSrcIP | Total number of bytes per source IP in 100 connections |
| 17 | TnBPDstIP | Total number of bytes per destination IP in 100 connections |
| 18 | TnP_PSrcIP | Total number of packets per source IP in 100 connections |
| 19 | TnP_PDstIP | Total number of packages per destination IP in 100 connections |
| 20 | TnP_PerProto | Total number of packets per protocol in 100 connections |
| 21 | TnP_Per_dport | Total number of packets per destination port in 100 connections |
| 22 | AR_P_Proto_P_SrcIP | Average rate per protocol per source IP in 100 connections |
| 23 | AR_P_Proto_P_DstIP | Average rate per protocol per destination IP in 100 connections |
| 24 | N_IN_Conn_P_SrcIP | Number of incoming connections per source IP in 100 connections |
| 25 | N_IN_Conn_P_DstIP | Number of incoming connections per destination IP in 100 connections |
| 26 | AR_P_Proto_P_Sport | Average rate per protocol per source port in 100 connections |
| 27 | AR_P_Proto_P_Dport | Average rate per protocol per destination port in 100 connections |
Finally, a random subsample of the datasets is taken to address the high degree of imbalance in the dataset and train the machine learning models. In the case of BoT-IoT, all samples of normal traffic are included, along with the selection of 200,000 random samples labeled as attacks. For the USNW-NB15 dataset, only 199,357 samples of normal traffic are included. In the custom dataset, all samples of normal traffic are included, along with the selection of 341,423 random attack traffic samples. Thus, we have a first balanced dataset, which totals 1,082,846 records, distributed in 541,423 data in each class.
On the other hand, regarding the proprietary dataset with slow-rate DoS attacks, all traffic samples corresponding to the attacks are taken, to which a random selection of 44,850 samples of normal traffic is added. By merging this subsample with the previously obtained balanced dataset, it obtains a second dataset with a total of 1,172,546 records. These are equally distributed, with 586,273 data in each category.
3.2.2. Data Preprocessing
The data need to be appropriately prepared before a machine learning algorithm can undergo training. In this sense, actions are taken to clean up the dataset, such as converting categorical features to values that the machine learning algorithm can understand, assigning at a value of −1 to the “sport” and “dport” features for instances that use the Internet Control Message Protocol (ICMP) and the Address Resolution Protocol (ARP), indicating that they do not have a valid port. In addition, the source and destination address and port (“saddr,” “daddr,” “sport,” and “dport”) are removed as they do not provide relevant information for prediction models [25]. Finally, each feature of the data is standardized by subtracting its mean and dividing by its standard deviation.
3.2.3. Training and Evaluation of Machine Learning Models
For the modeling of anomaly detection, the four most used machine learning classifiers are used: decision trees [43], random forests [43], logistic regression [31], and SVM [44]. For the creation of machine learning models, two balanced datasets are used, one aimed at evaluating traditional DoS attack detection and the other focused on the identification of slow-rate DoS attacks.
Validating a machine learning model is critical to ensure new unseen data performance. In this case, each dataset is divided into 70% for training the model and 30% for testing its performance. However, a cross-validation technique is used to refine the model’s hyperparameters. Cross-validation involves dividing the training data into several partitions, or “folds,” and training the model one-fold while evaluating its performance on the remaining folds. A 3-fold cross-validation is performed in this case, meaning the data are divided into three subsets. The accuracy metric is used to evaluate the model’s performance and select the best hyperparameters to maximize the model’s accuracy and generalization. Table 6 shows the hyperparameters used to calibrate and construct each of the models.
| Model | Hyperparameters | Values |
|---|---|---|
| Decision tree [45] | Maximum tree depth | 8, 10, 12, 14 |
| Minimum samples needed to split an internal node | 2, 4, 6 | |
| Random forest [46] | Maximum tree depth | 20, 22, 24 |
| Number of trees in the forest | 100, 200, 300 | |
| Logistic regression [47] | Constant that multiplies the regularization term | 10−6, 10−5, 10−4, 10−310−2, 10−1, 1, 10 |
| Regularization | l1, l2 | |
| SVM [47] | Constant that multiplies the regularization term | 10−5, 10−4, 10−3, 10−210−1, 1, 10, 100 |
| Regularization | l1, l2 | |
Finally, the models are evaluated by calculating the time it takes to make a prediction and comparing performance metrics such as accuracy, recall, precision, and F1-score [48].
3.3. Development and Implementation of an Online Anomaly Detection System
Having completed the offline training phase of machine learning models, the next step involves the development and implementation of the online anomaly detection system. This phase comprises two subsystems: the traffic extractor and the online anomaly detector based on microservices. Details of each subsystem are presented in the following sections.
3.3.1. Traffic Extractor
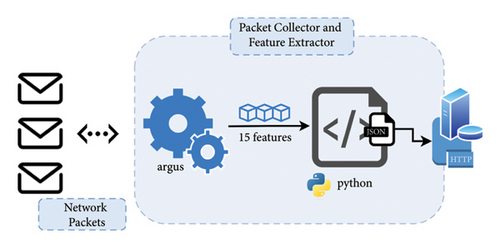
Responsible for capturing packets, traveling through a network interface, analyzing them, and extracting features describe incoming packets, thereby creating data records with attributes required by machine learning models. The Argus tool is used as a feature extractor, which is open source and allows for real-time auditing of the network traffic generated and received by a host. In addition, a Python script is developed to send the collected data to the anomaly detector.
Figure 2 depicts a feature extractor. Using the Argus tool, all packets traveling through the system’s network interface are captured, and then the tool analyzes the packets to extract 15 features for each data record. These features are received by a Python script, which performs two asynchronous tasks. The first task reads the data provided by Argus and places it in a request queue, while the second task retrieves the data stored in the queue and sends it to the anomaly detector through an API using the HTTP protocol.
3.3.2. Anomaly Detection Based on Microservices
The anomaly detector is responsible for processing the data sent by the traffic extractor and contains machine learning models to classify network traffic as either normal or attack traffic. The anomaly detector is developed under a microservices architecture using the Flask Python framework.
Figure 3 shows the microservices-based architecture implemented in the anomaly detector. The microservices are deployed in Docker containers and communicate with each other using an asynchronous messaging broker (Kafka). Each microservice has a connection to a nonrelational database (MongoDB). In addition, they are registered with a discovery server so that the APIs can be viewed within a gateway.
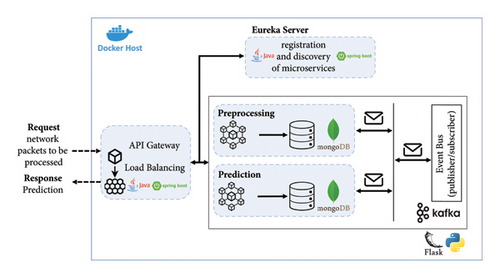
Two microservices have been developed, one for data preprocessing and the other for classification or prediction as follows:
- (i)
Receives and stores the parameters for standardizing the data in a database before proceeding to its prediction.
- (ii)
Receives a JSON file of 100 records with the attributes that describe the network traffic. The data are cleaned, preprocessed, and 12 additional features are calculated that are necessary for the machine learning models. Once the data are processed, they are published to the data-preprocessing topic.
Microservice for prediction: for this microservice, it is necessary to have the Scikit-Learn [49] library installed. There are several endpoints to store each classification model evaluated in the training phase and a method in which data from the preprocessing microservice arrives. The machine learning models are loaded, and the predictions from the models are published to the data-prediction topic.
4. Results and Discussion
In this section, the obtained results are detailed and analyzed. First, the outcomes of the offline machine learning models’ training phase are explored, encompassing performance metrics for both training and testing data, along with prediction and training times. Subsequently, the results associated with real-time attack detection in the test scenario are presented, including the calculation of performance metrics for the four models. Finally, a discussion of the proposed solution is provided.
In binary classification to detect normal traffic and attack traffic in machine learning models, hyperparameters are optimized with the comparison metric “accuracy” during the training phase. In general, all models show high performance in training with an accuracy greater than 95%.
The best parameters are used to train the models and calculate performance metrics to evaluate their performance on the training and testing data. Figures 4, 5, 6, 7 show the confusion matrices of the different models on both the training and testing datasets. These matrices are associated with the models that were trained using the dataset containing traditional DoS attacks.
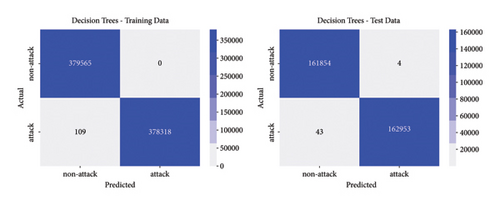
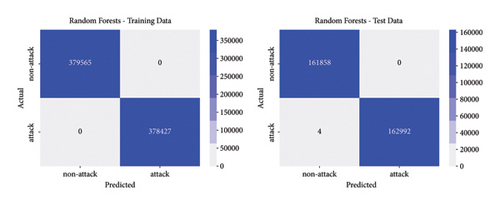
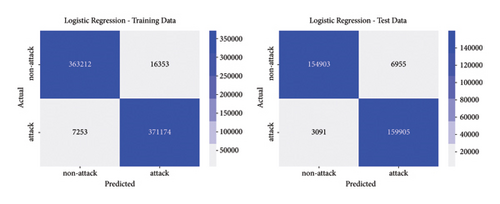
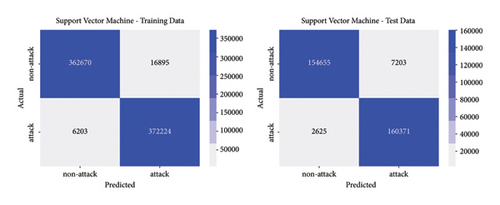
In this type of classifier, it is important to balance the rate of false positives and false negatives, regarding the interest of the detection strategies. In IDS design, false positives (detecting normal traffic as anomalous) led to the activation of countermeasures over legitimate traffic, affecting the service of users. On the other hand, false negatives end up letting flows enter the network as normal traffic, increasing the risk of damaging critical infrastructure. Figures 4, 5, 6, 7 show how different traditional algorithms could be fine-tuned to reach a balance between the rate of false positives (FPs) and false negatives (FNs) according to the needs of each situation. Random forest exposes the best performance in terms of precision and recall, exhibiting remarkable performance in both training and test stages, while logistic regression and SVM have the worst performance, with higher FP and FN rates.
Similarly, Figures 8, 9, 10, 11 provide the confusion matrices corresponding to the models trained using the dataset containing slow-rate DoS attacks. In this case, also random forest and decision trees delivered the best results for this kind of DoS attack. SVM and LR increased the number of FP and FN. This could be expected since patterns in slow-rate DoS are similar to normal traffic.
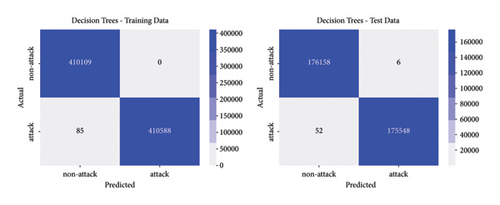
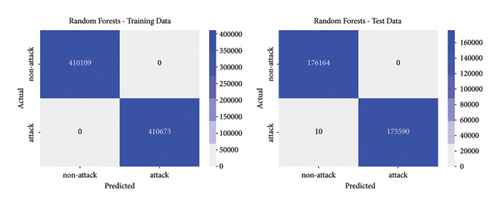
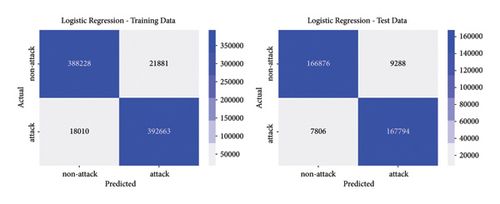
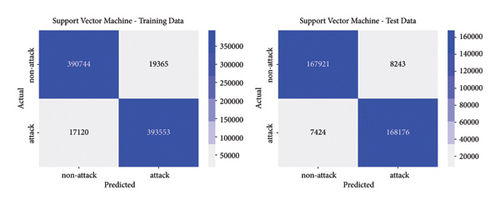
Table 7 shows the calculated metrics for assessing the performance of the models, which were built using the dataset containing traditional DoS attacks. These metrics are provided for both training and testing data, along with training and prediction times.
| Training data | |||||
|---|---|---|---|---|---|
| Model | Accuracy | Precision | Recall | F1-score | Time (sec) |
| Decision trees | 0.999856 | 1.0 | 0.999712 | 0.999856 | 21.694382 |
| Random forest | 1.0 | 1.0 | 1.0 | 1.0 | 207.022728 |
| Logistic regression | 0.968857 | 0.957802 | 0.980874 | 0.969181 | 2.987016 |
| SVM | 0.969527 | 0.956581 | 0.983608 | 0.969907 | 1.583687 |
| Test data | |||||
| Model | Accuracy | Precision | Recall | F1-score | Time (sec) |
| Decision trees | 0.999855 | 0.999975 | 0.999736 | 0.999856 | 0.116675 |
| Random forest | 0.999988 | 1.0 | 0.999975 | 0.999988 | 2.84085 |
| Logistic regression | 0.969075 | 0.958318 | 0.981036 | 0.969033 | 0.030005 |
| SVM | 0.969746 | 0.957016 | 0.983895 | 0.970270 | 0.03 |
Similarly, Table 8 presents the performance metrics associated with the models constructed using the dataset with slow-rate DoS attacks.
| Training data | |||||
|---|---|---|---|---|---|
| Model | Accuracy | Precision | Recall | F1-score | Time (sec) |
| Decision trees | 0.999896 | 1.0 | 0.999793 | 0.999897 | 15.691205 |
| Random forest | 1.0 | 1.0 | 1.0 | 1.0 | 698.143843 |
| Logistic regression | 0.951399 | 0.947217 | 0.956145 | 0.95166 | 18.544597 |
| SVM | 0.955548 | 0.953102 | 0.958312 | 0.9557 | 2.785015 |
| Test data | |||||
| Model | Accuracy | Precision | Recall | F1-score | Time (sec) |
| Decision trees | 0.999835 | 0.999966 | 0.999704 | 0.999835 | 0.105301 |
| Random forest | 0.999972 | 1.0 | 0.999943 | 0.999972 | 7.479585 |
| Logistic regression | 0.951405 | 0.94755 | 0.955547 | 0.951531 | 0.028006 |
| SVM | 0.955462 | 0.953276 | 0.957722 | 0.955494 | 0.026576 |
In conclusion, decision trees and random forest models have proven effective in detecting malicious packets in a network, both for traditional and slow-rate DoS attacks. Regarding the prediction time, the random forest model requires more computational resources, so it is not recommended for edge devices with limited resources. In such cases, the decision tree model is recommended.
In addition, the online detection capability is analyzed in the test scenario by conducting a series of attacks on the target machine. DoS attack tests were carried out approximately every 15 minutes, with variations in the execution parameters of the attack tools.
The results of the experiments and their predictions were recorded in a dataset for further analysis. For online detection of traditional DoS attacks, 3,026,300 records were obtained and used to calculate the performance metrics of the machine learning models and evaluate the performance of the anomaly detection system. The confusion matrices for the different models used are shown in Figures 12 and 13.
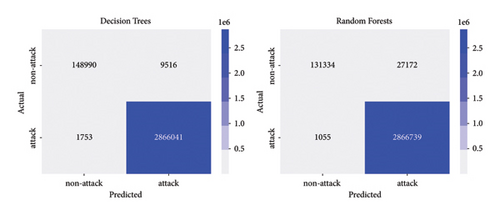
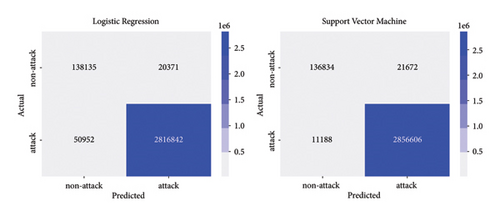
Similarly, for online detection of slow-rate DoS attacks, a total of 135,200 records were obtained, which are used to evaluate the performance of machine learning models in detecting this type of attack. The confusion matrices for these models can be found in Figures 14 and 15.
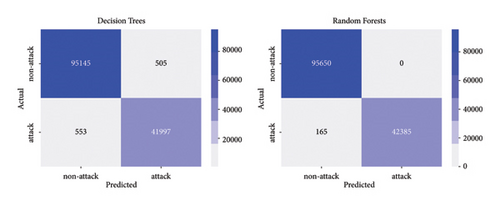
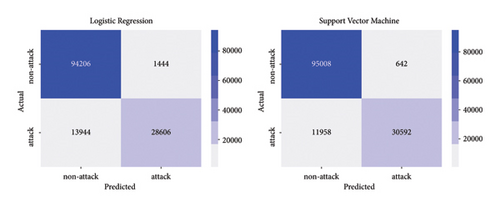
Table 9 shows the performance metrics calculated for the data obtained during real-time attacks using the machine learning models built using the dataset containing traditional DoS attacks. Performance measures such as accuracy, precision associated with each class (0 and 1) and their average precision, sensitivity associated with each class (0 and 1) and their average sensitivity, as well as F1-score associated with each class (0 and 1) and their average F1-score are included. Class 0 represents normal traffic, while class 1 represents anomalous or attack traffic.
| Metric | Decision trees | Random forest | Logistic regression | SVM |
|---|---|---|---|---|
| Accuracy | 0.996276 | 0.990673 | 0.976432 | 0.989142 |
| Precision_1 | 0.996691 | 0.990611 | 0.99282 | 0.99247 |
| Precision_0 | 0.988371 | 0.992031 | 0.730537 | 0.924417 |
| Precision_avg | 0.992531 | 0.991321 | 0.861678 | 0.958444 |
| Recall_1 | 0.999389 | 0.999632 | 0.982233 | 0.996099 |
| Recall_0 | 0.939964 | 0.828574 | 0.871481 | 0.863273 |
| Recall_avg | 0.969677 | 0.914103 | 0.926857 | 0.929686 |
| F1-score_1 | 0.998038 | 0.995101 | 0.987498 | 0.994281 |
| F1-score_0 | 0.963560 | 0.902965 | 0.794809 | 0.892799 |
| F1-score_avg | 0.980799 | 0.949033 | 0.891154 | 0.94354 |
In addition, to visualize and compare the performance metrics of the different machine learning models, a radar chart is used. This type of chart allows for a clear and direct comparison of multiple variables in a two-dimensional representation. Figure 16 presents such a chart, displaying the performance metrics obtained for online detection of traditional DoS attacks. Each axis of the chart represents a specific performance metric, and the extension along each axis indicates the corresponding value of that metric.
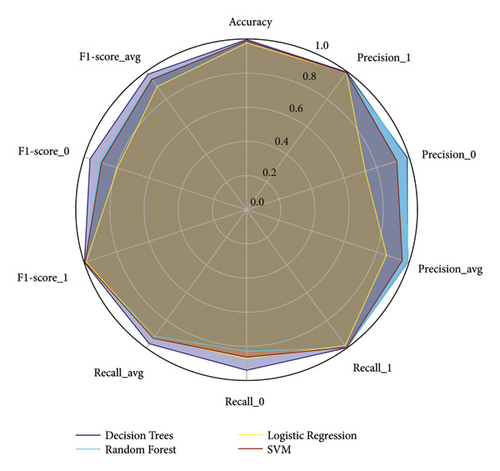
In Figure 16, it is observed that for online detection of traditional DoS attacks, the decision trees model stands out notably with high values in precision (0.996276), recall for class 1 (0.999389), and average F1-score (0.980799), indicating a balanced and robust performance. The random forest model shows competitive performance, especially in precision (0.990673) and recall for class 1 (0.999632), although its recall for class 0 (0.828574) is lower compared to other models. On the other hand, logistic regression exhibits the lowest precision (0.976432) and significantly lower performance in precision (0.730537) and F1-score for class 0 (0.794809), suggesting lower effectiveness in detecting normal traffic. Finally, the SVM model shows good overall performance with high precision (0.989142) and average F1-score (0.94354). However, its recall for class 0 (0.863273) is lower than the decision trees, indicating a specific limitation in normal traffic recovery capability.
In addition, Table 10 displays the models’ performance metrics, which were constructed using the dataset containing slow-rate DoS attacks. These metrics are also graphically represented in Figure 17, providing a visual comparison similar to that in Figure 16.
| Metric | Decision trees | Random forest | Logistic regression | SVM |
|---|---|---|---|---|
| Accuracy | 0.992344 | 0.998806 | 0.888654 | 0.908828 |
| Precision_1 | 0.988118 | 1.0 | 0.951947 | 0.979445 |
| Precision_0 | 0.994221 | 0.998278 | 0.871068 | 0.888207 |
| Precision_avg | 0.99117 | 0.999139 | 0.911507 | 0.933826 |
| Recall_1 | 0.987004 | 0.996122 | 0.672291 | 0.718966 |
| Recall_0 | 0.99472 | 1.0 | 0.984903 | 0.993288 |
| Recall_avg | 0.990862 | 0.998061 | 0.828597 | 0.856127 |
| F1-score_1 | 0.987561 | 0.998057 | 0.788044 | 0.829231 |
| F1-score_0 | 0.994471 | 0.999138 | 0.924495 | 0.937813 |
| F1-score_avg | 0.991016 | 0.998598 | 0.856269 | 0.883522 |
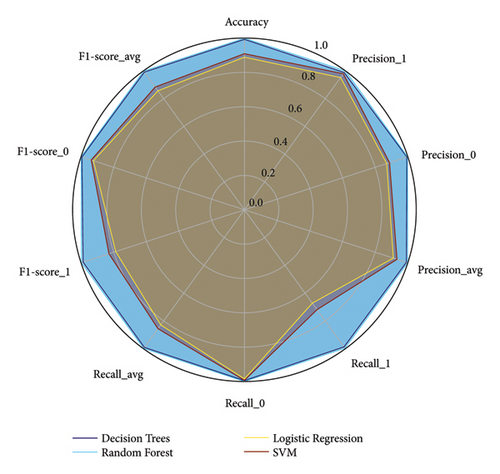
In Figure 17, it is observed that for online detection of slow-rate DoS attacks, decision trees and random forest models exhibit high values in accuracy, precision, recall, and F1-score, highlighting their effectiveness in identifying these attacks while maintaining high precision in normal traffic detection. In contrast, logistic regression shows lower overall performance metrics, particularly in recall for class 1 (0.672291) and F1-score for class 1 (0.788044), suggesting limitations in correctly identifying slow-rate DoS attacks. SVM demonstrates competitive performance in recall for class 0 (0.993288), although with lower overall performance metrics compared to decision trees and random forest models.
The anomaly detector demonstrates high performance in a realistic environment for real-time identification of malicious traffic for traditional and slow-rate DoS attacks. Examining the average F1-score metric, which provides a better understanding of model behavior as it combines sensitivity and precision, it can be noted that for traditional DoS attacks, the decision tree model performs better with a 98.08% performance. In the case of slow-rate attacks, which are challenging to detect due to their slow and steady pace, the system achieves a strong performance rate of 99.85% using the random forest model. Nevertheless, it is worth highlighting the performance of the decision tree model, which achieved 99.01%.
In addition, to estimate the response time for packet predictions, the initial time is taken as the moment when the capture of 100 records begins, and the final time is when the response is received from the anomaly detection microservices. This results in an average time of 0.82 seconds and a minimum time of 0.37 seconds for traditional DoS attacks. When the packet flow on the network decreases, the response time is affected by waiting for the analysis of 100 packets; however, a small data flow may also imply normal network traffic.
On the other hand, in the case of slow-rate attacks, the packet flow is lower, so the calculated time increases, resulting in an average time of 18.74 seconds and a minimum time of 0.2 seconds.
The traffic extractor and the anomaly detector are developed under the microservices paradigm, and this enables the possibility of protecting several nodes inside a distributed application. In this sense, an instance of the traffic extractor must be deployed on each critical node of the infrastructure, and the anomaly detector could be centralized (or distributed at will) in nodes with sufficient computational power to run detection algorithms.
The addition of a flow extractor represents a drawback since, in our case, the application must trace a network interface and group packets to extract features. This process is entirely software-based, and although detection times are within tolerable margins, they could be improved for parts of the network with higher traffic. For this reason, we are currently working on implementing smoother feature extraction techniques that are already developed in software-defined networking (SDN). For example, using OpenFlow, switches that support this protocol could send statistics about flows periodically. By analyzing patterns in this data, attacks could be detected at the controller, a centralized point in charge of the network logic. In addition, Programming Protocol-independent Packet Processors (P4), an open-source, domain-specific programming language, allows programming the data plane to implement better-tailored feature extraction routines. Both alternatives ease the feature extraction process by directly using network devices to gather information about network flows.
Our anomaly detector focuses on discerning two types of DoS attacks, including slow-rate that hold patterns similar to legitimate traffic. DoS attacks constitute an important part of the most relevant network cyberattacks, however, in the search for building robust IDS, two items must be addressed shortly: first, the inclusion of more known attacks in the detection phase, and second the possibility of detecting zero-day attacks. Both issues need the structuring of better datasets, leveraging the training of best-suited algorithms. A multiclass classification enables the possibility of implementing tailored mitigation strategies for each type of attack. Also, the detection of zero-day attacks is an ongoing challenge in IDS design and implementation, one alternative is to tune one-class classification algorithms, and in this case, the trick is to model properly the normal traffic to draw a sufficient border between legitimate and anomalous traffic. Taking these points into consideration, the dataset must be enhanced with data from other well-known attacks and also with normal traffic.
5. Conclusions
In this work, four machine learning models were implemented for detecting anomalous traffic, conducting both traditional and slow-rate DoS attacks, using the fusion of datasets for their training. These models were deployed using microservices that enable data preprocessing and classification of normal or attack traffic.
Real-time detection is crucial for network security, as it allows early identification of potential attacks and the implementation of preventive measures. The high efficacy demonstrated by the decision tree model in detecting traditional DoS attacks and the random forest model in detecting slow-rate DoS attacks is an indicator of their capability to identify malicious traffic in a realistic environment. These models yield good results, achieving a 98.08% F1-score, 99.25% precision, and 96.96% recall for the decision tree model. Meanwhile, the random forest model attains values of 99.85% for F1-score, 99.91% for precision, and 99.80% for recall. This increases confidence in the anomaly detection system, enabling more effective protection against potential attacks and enhancing network security.
In the future, a multiclass model can be integrated into the system, which detects anomalies and specifies the type of attack, strengthening the protection capability against possible intrusions. In addition, the real-time implementation of mitigation strategies will further strengthen the system’s robustness and security.
Conflicts of Interest
The authors declare that they have no conflicts of interest regarding the publication of this paper.
Acknowledgments
The authors would like to thank Engineer David Santiago Guerrero and Ph.D. Luis Germán García for their valuable assistance and support in realizing this research work. This work was supported by the Science, Technology, and Innovation Fund (FCTeI) of the General Royalties System (SGR) under the project identified by the code BPIN (2020000100044).
Open Research
Data Availability
The original dataset used in this work is available from the corresponding author on request.


