Experimental and Numerical Investigation of Cavitation Assessment for Runner Blades in a Francis Turbine
Abstract
Cavitation in hydro turbines causes component deterioration that requires continuous and costly maintenance in the hydroelectric power generation stations. The Tarbela Dam Hydel Project (TDHP) in Pakistan is facing a cavitation problem in the Francis Turbine components, such as the runner and draft tube. Simulation work has been performed to examine and quantify the cavitation rate as a function of the suction head (SH) and flow velocity (FV) by utilizing a homogeneous cavitation model. The result shows that pressure fluctuation is maximum for overcrowded conditions and minimum for rated load conditions. Moreover, a higher cavitation rate is found for the part and overcrowded conditions compared to the rated load condition. Additionally, the cavitation rate becomes 50% higher when the SH increases from 5.54 to 12.34 m. Moreover, SEM results have verified the CFD results that higher FV and SH enhance the cavitation rate. Furthermore, the numerical work is validated by simplified hydrofoil geometry. The computational fluid dynamics results presented a good arrangement with the experimental data.
1. Introduction
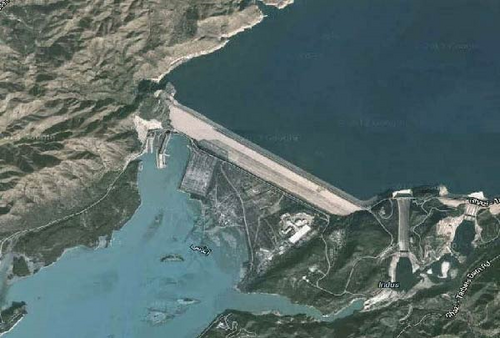
Pakistan has an enormous impending of hydropower and an outstanding presence of many aquatic resources instigated by the regular monsoon rainfall and melting of glaciers of the Himalayan range. It has half a dozen big dams for hydropower generation above 500 MW capacity. The Tarbela Dam Hydel Project (TDHP) generates about 3,500 MW of electricity. It has been built near the Indus River and is located around 90 km from Islamabad, as shown in Figure 1. A total of 14 Francis turbine units are installed, and mutual turbine technology is used in hydroelectric power generation having an efficiency of 93%. However, the turbine components weaken in recital after limited years of processes or operations as they get smashed mainly due to cavitation, sediment erosion, material defects, and fatigue. Due to variations in static pressure, turbine blades get damaged due to cavitation at different locations. Cavitation is the undesirable portent that usually occurs when the local static pressure in a fluid flow reaches below its vapor pressure.
The pressure can be much lower in the high-velocity region or spot of the turbine, which can cause the formation of tiny bubbles. However, in high-velocity regions, these bubbles collapse and burst abruptly. This portent is called cavitation, which leads to various problems like noise and vibration at the trailing edges of turbine blades and in draft tubes, which eventually reduces the life of the components and consequently decreases the plant efficiency [1]. Cavitation can only be minimized within acceptable limits but not eliminated.
Various investigators have tried to identify the wear problems experienced by hydel turbines and put efforts into minimizing the losses in terms of material damage and performance deterioration. Simulations was performed using various patterns of cavitation tribometers to find out the information and the effects caused due to changes in rotational speed, size and shape of cavitation separation, and inducers of the sample over the mass loss. Moreover, the outcomes acquired from the numerical investigation of tribometers were contrasted with simulations of a Francis turbine at the Amaime power plant [2]. Cavitation was examined pitting in which the advancement time of cavitation was assessed through pitting tests driven on three divergent materials, for example, an Al compound or alloy, a Ni, Al–bronze (CuSn) amalgam, and a Duplex SS, in a cavitation burrow or tunnel. The impact of stream speed on two boundaries, inclusion time, and characteristic diameter was broken down and a power law was created for the impact of stream speed on pitting rate for each of the three materials [3]. A CFD study was conducted to examine cavitation as a function of temperature, suction head (SH), and FV in a Francis turbine. Another study found that cavitation in silt flow is more dangerous than in pure water. Correlations have been established for wear rate and efficiency loss as a function of silt parameters [4, 5]. The internal flow characteristics was analyzed near the runner blade and compared the blockage impact by using different blade thicknesses. Additionally, they have investigated the flow behavior in the Francis hydro turbine model with various blade thicknesses in the off-design conditions by using of steady flow analyses [6]. A procedure was proposed and validated to determine the Eigen frequencies and the corresponding Eigen modes of a hydraulic test rig containing a reduced scale model of a Francis turbine operating at off-design conditions by employing 1-D numerical simulations [7]. The cavitation intensity experienced was investigated by various turbines in on-design conditions. The optimal performance of the units has been obtained through graphs at various operating conditions. The test data can be easily applied to all hydroelectric power plants that experience cavitation and safe operating conditions can be identified [8]. Worked was performed on various advancement strategies, for example, the plan of analysis of the factorial type, artificial neural networks, and hereditary calculations with a multipoint approach, which incorporates two activity focuses at the same time considering erosive wear by hard particles and cavitation damage [9].
In the present work, damage due to cavitation erosion to the Francis turbine runner blades at TDHP is assessed and quantified in the form of cavitation rate. Moreover, the conditions at TDHP are quite different and unique compared to the research already performed. Based on the author’s knowledge, no study has been performed on the cavitation assessment of the Francis turbine of the TDHP in Pakistan. Using CFD simulations, the dependance of cavitation rate on the SH and FV has been investigated. Simplified hydrofoil geometry is utilized for the validation of the cavitation model. The CFD results agree well with the experimental data.
| Parameter | Prototype |
|---|---|
| Head (m) | 96 |
| Number of blades | 11 |
| Power (MW) | 180 |
| Number of stay vane | 10 |
| Runner diameter (m) | 4.87 |
| Runner speed (rpm) | 135 |
| Discharge (m3/s) | 980 |
| Number of guide vane | 22 |
2. Numerical Methodology
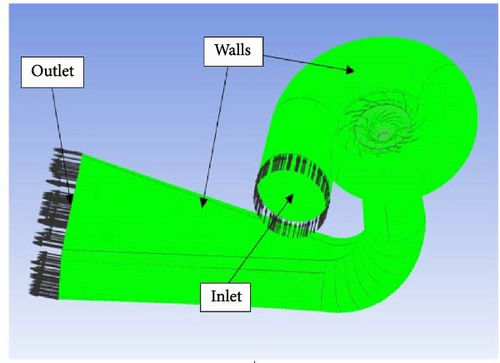
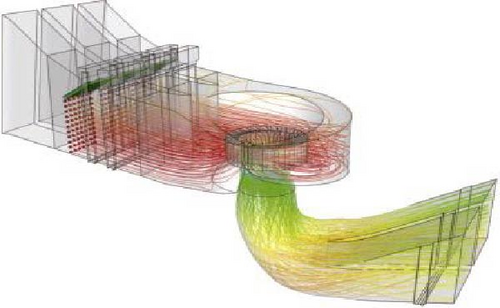
The numerical work has been conducted in four distinct stages. The initial step is the planning and calculation of the CAD model according to display measurements, the second step is the grid generation for each part, the third step gives the boundary conditions according to accessible site information, and the last step is the simulation. The mass flow rate at the inlet, the no-slip at the wall, and the pressure at the outlet are the applied boundary conditions. Fully developed flow is introduced at the volute casing inlet for the slurry flow considering volute casing as a stationary domain and impeller have under rotation speed of 1,500 rpm. Moreover, mass flow rate is taken at inlet boundary at spiral casing and pressure at outlet boundary for the draft tube respectively, however, non-slip flow conditions are used for walls as shown in Figure 2. Spiral casing, stay vanes, guide vanes, and draft tube are stationary components of runner having rotation speed of 136 rpm.
2.1. Model Generation
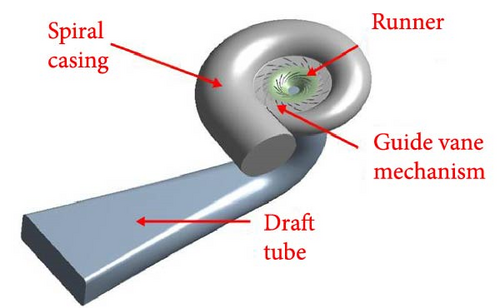
Francis turbine model contains four main components: spiral casing, guide vane system, runner, and draft tube. The ANSYS module, Design Modeler, has been used to develop a 3-D computational model, as shown in Figure 3.
2.2. Mesh Generation
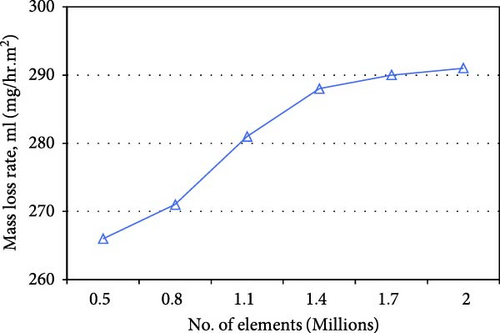
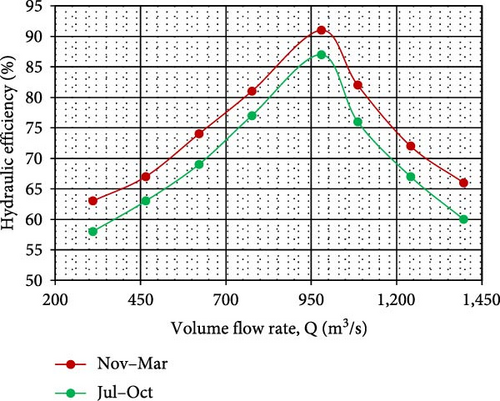
Six different mesh sizes are used to check the mesh sensitivity. 1.7 million elements are utilized in all simulation cases as shown in Figure 4 as it gives the optimum number of elements that will yield reasonably accurate results. The hydraulic efficiency vs volume flow rate is shown in Figure 5. The turbine hydraulic efficiency is defined by the Equation (4).
For the runner, a total of 170 hexahedral mesh blocks were used. In contrast, the draft tube used 45 hexahedral blocks by utilizing the ICEM module of ANSYS, as shown in Figure 6. Relatively fine grids were used around the hub and shroud surfaces and near the draft tube wall surface. In contrast, the grids in other areas were relatively coarse.
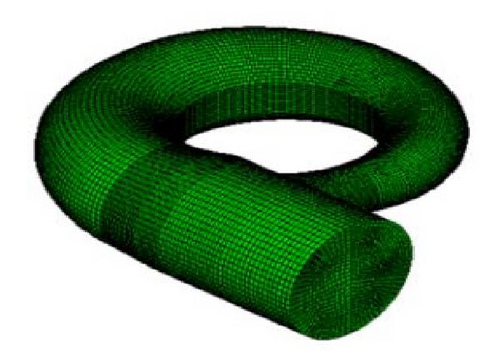
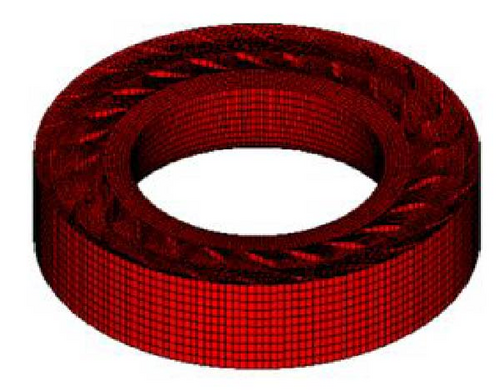
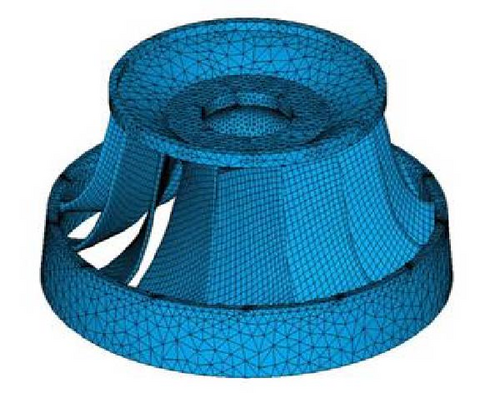
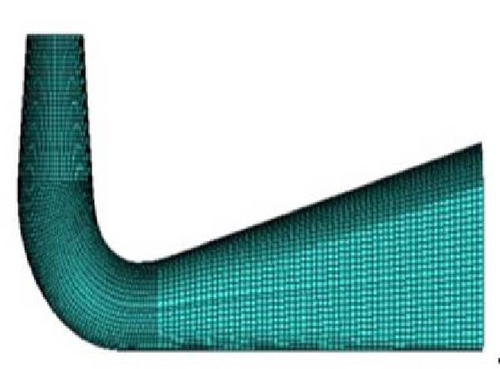
To solve the boundary layer correctly and precisely, the shear stress transport (SST) turbulence model is adopted, which is a combination of k-ω (inside the boundary layer) and k-ε model (outside the boundary layer), and it takes care of the flow separation under adverse pressure gradients [12]. A y+ value of around 1.5 is used to accurately solve the viscous sublayer [10]. For Reynolds number flows up to 107, a y+ value of 50–300 is employed at a volute casing and draft tube exit to save computational cost [13, 14].
The full cavitation model enables an accurate representation of cavitation processes in fluid flow simulations by using intricate mathematical formulas to replicate the starting point, development, and fall of cavitation bubbles. It considers changes in pressure, the dynamics of the bubbles, and how they interact with the surrounding fluid while compared to more extensive cavitation models, the Zwart model in computational fluid dynamics is simpler and uses empirical correlations to estimate cavitation’s start and bubbles’ formation. This method is faster, but it is less detailed.
Mesh independence study and details are given in Tables 2 and 3. The minimum error value is found for the 14.30 million elements mesh as given in Table 2, so this value is used for cavitation simulation cases.
| Cavitation rate (gm/hr.m2) | Mesh in millions |
|---|---|
| 73 | 8.70 |
| 91 | 9.85 |
| 102 | 11.00 |
| 108 | 12.10 |
| 111 | 13.15 |
| 112 | 14.30 |
| 112.5 | 15.50 |
| Parameters | Value |
|---|---|
| Pv | 4,240 Pa |
| Fcond | 0.03 |
| Fe | 300 |
| ρr | 1,000 |
| rnuc | 5 × 10⁻⁴ |
| Rf | 0.25 |
| RB | 1 μm |
ANSYS CFX solver theory deals with the thorough explanation of multiphase models. The simulation model is validated through experimental work on a simple hydrofoil geometry [18]. The hydrofoil is tested in a rectangular section in a water tunnel, whose dimensions are 500 mm in length, 50 mm wide, and 100 mm high available at Darmstadt University of Technology. To obtain 3-D cavitation effects, an asymmetric hydrofoil that is 107.9 mm long, having a span of 50 mm and 16 mm in thickness, with a slant or sweeping angle of 15° and an angle of attack as 5° is employed as presented in Figure 7.
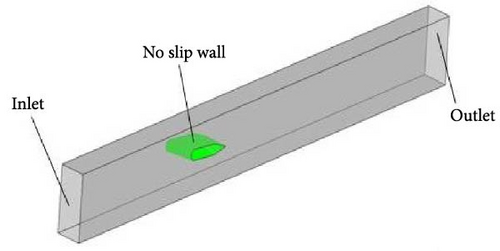
A fixed velocity of 13 m/s upstream of the hydrofoil was applied based on the chord length. Developed cavitating flow was found at cavitation number of 2.3 which is defined as the difference between the free stream and vapor pressure divided by the dynamic pressure. Particle image velocimetry (PIV) has been used to capture the cavitation images. The Rayleigh–Plesset equation is used to derive source terms, functions of local flow conditions (velocity and static pressure), and fluid properties (liquid and vapor phase densities, liquid and vapor phase viscosities, and liquid–vapor surface tension). SST turbulence model is adopted, which takes care of the flow separation under adverse pressure gradients [12]. The properties utilized for liquid and vapor are given in Table 4.
| Properties | Symbol | Value with units |
|---|---|---|
| Density of liquid | ρl | 998.2 kg/m3 |
| Density of vapor | ρv | 0.544 kg/m3 |
| Viscosity of liquid | µl | 10 − 3 Pas |
| Viscosity of vapor | µv | 1.35 × 10⁻⁵ Pas |
| Surface tension | γ | 0.0727 N/m |
| Vapor mass fraction | αv | 5 × 10⁻⁵ |
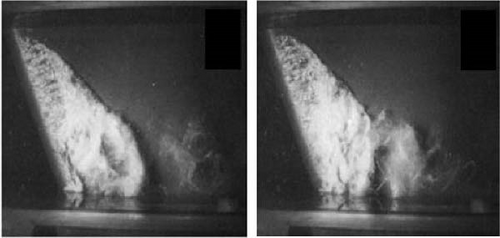
Cavitating stream around the ALE-15 hydrofoil from the top view is introduced in Figure 8(a). Cavitation stays consistent in the area where the hydrofoil is the longest. However, periodically rehashing the partition of cavitation mists in the region where the hydrofoil is the shortest. The full cavitation model (FCM) has a precise forecast for the stream field structure and the shedding attributes of cloud cavitation. FCM predicts the unsteady cavitation along with the separation region accurately, as shown in Figure 8(b).
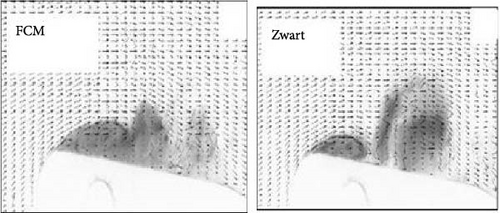
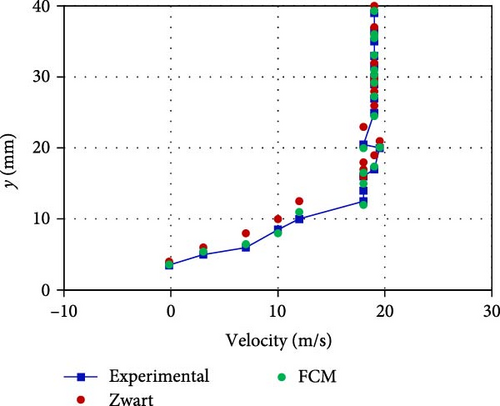
The velocity profile is plotted for both numerical models, and the results are compared with the predicted experimental values, as presented in Figure 9.
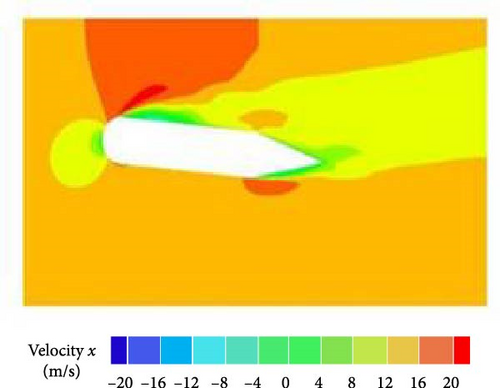
It is because the cavitation structure acts as an obstacle, and the existence of the leftover vortices from the distorted cavitation clouds hinders fluid movement. Both models yield results comparable to the tested results as shown in Figure 10. Only a few discrepancies are observed; the single fluid with no-slip boundary condition between the phases is simulated, and the vapor region provides higher resistance to the flow. The numerical results obtained using the FCM is closer to the experimental ones. It is because the cavity thickness predicted is thinner than the Zwart model, and the cavitation region had higher vapor content. Therefore, FCM is utilized in all the simulation cases.
3. Results and Discussion
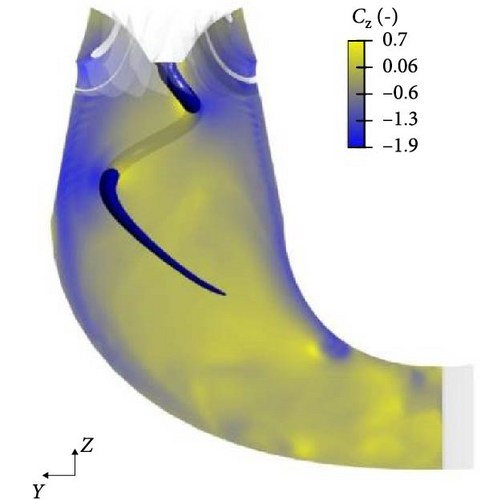
The effect of cavitation on the runner blades and draft tube of the Francis turbine is investigated through a simulation study. Pressure variation through the Francis turbine components is presented in Figure 11. Higher pressure is observed at the spiral casing, which reduces along the runner blades. Furthermore, it decreases at the inlet of the draft tube and increases at the draft tube exit. The abrupt change in pressure causes damage due to cavitation at the runner blades and draft tube shown in the encircled region.
3.1. Vortex Rope Formation and Pressure Pulsation in Draft Tube
Streamlines shown in Figure 12 for the conical part of the draft tube are similar to a fan-type phenomenon due to the rotation of the runner. Swirling flow in an anticlockwise direction is present in the draft tube where due to the geometry, the flow decelerates and the pressure increases. Consequently, the helical vortex rope in the draft tube becomes visible for overload conditions, as shown in Figure 12(a). This steady helical vortex core creates unsteady high-pressure fluctuations on the walls of the draft tube. Numerical results are compared with a similar phenomenon observed in an earlier published experimental work [19] as shown in Figure 12(b). Both result show almost combination of helical and columnar vortex.
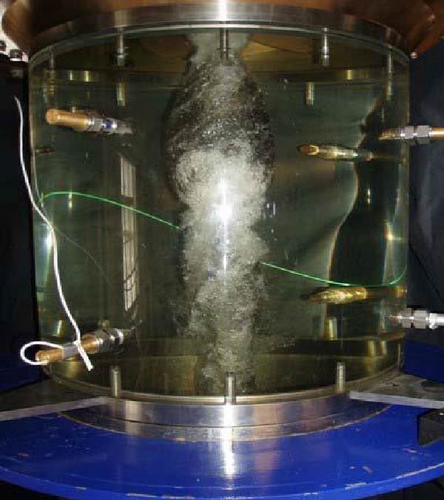
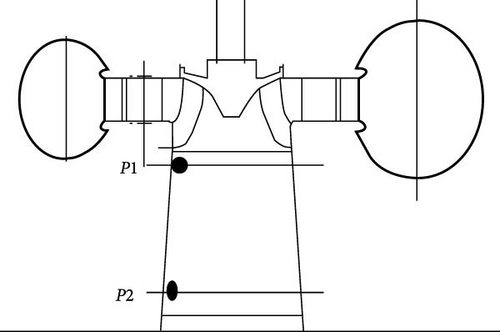
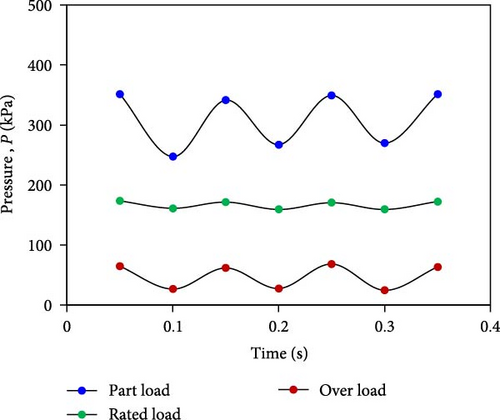
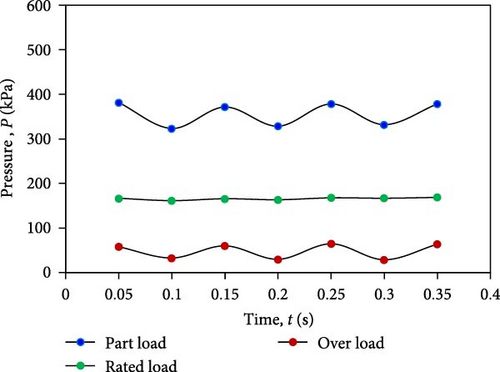
Due to the vortex core formation, the performance of pressure pulsation is observed, which causes hydraulic turbine variability. The runner outlet considers the pressure points P1 and P2 at 0.3∗D and 1∗D, where D is the runner diameter. The pressures have been investigated at points P1 and P2 for all three operating conditions, i.e., at rated load, part load, and overload circumstances, as shown in Figure 13.
At point P1, it has been observed that pressure variation is higher at part load as compared to rated load and over load conditions. It is because a low-pressure zone exists when the water leaves the runner, which causes the water to cavitate. The flow is observed to be unstable, and high-pressure fluctuations are observed. At over load conditions, a minimal pressure pulsation is observed, as shown in Figure 14.
At point P2, it has been found that pressure changes are more significant at part load and load conditions, but there are no random pressure fluctuations under rated load conditions. The magnitude of pressure increases and fluctuations are decreased than point P1 for all three cases because of the deceleration inflow observed at P2, as shown in Figure 15.
3.2. Cavitation Rate vs. the Suction Head
The cavitation rate as a function of the SH for all three flow conditions is plotted in Figure 16. The equation for cavitation rate is shown in Equation (7).
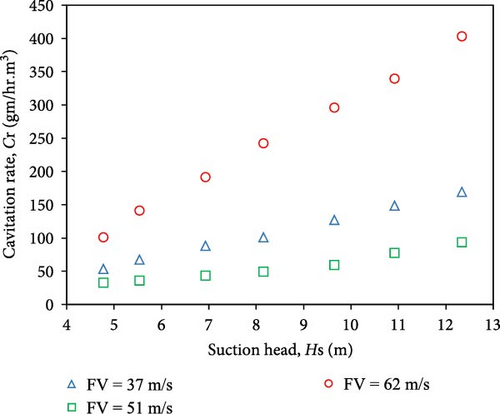
Higher cavitation rate and more considerable variation are found for the overload condition. Moreover, slight variation is found for part load condition and nearly no change for rated load condition. The reason for this trend is the drop in the value of the Thoma plant factor, σp, which approaches the critical cavitation coefficient, σc, and thus increases the cavitation. In overload conditions, the angle of attack of water at the blade’s leading edge is higher, and the swirl inflow is also enhanced due to vortex rope formation. The cavitation rate is three and five times higher for the part and over load conditions, respectively, compared to the over rated condition.
3.3. Cavitation Rate vs. Flow Velocity
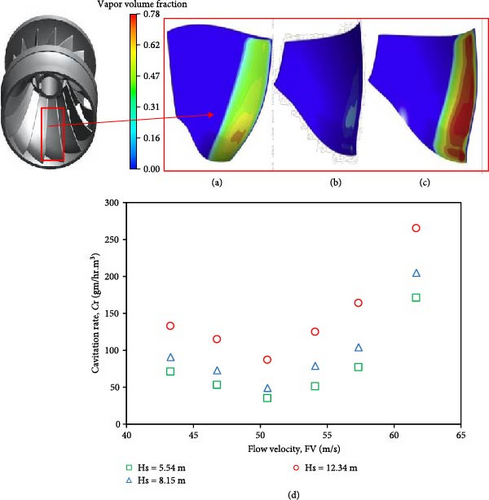
The cavitation rate as a function of FV for three distinct values of SHs is presented in Figure 17(a). Interestingly the cavitation rate first decreases to a minimum value and then increases to a maximum. FVs of 37, 51, and 62 m/s belong to part load, rated load, and overload conditions. The effect of cavitation is minimum for rated load, maximum for overload, and moderate for part load conditions, as shown in Figures 17(b) and 17(c). The cavitation rate is seen to be lowest around 51 m/s because the pressure fluctuations are minimum for the rated load condition, as shown in Figure 17(d). The cavitation rate is 50% higher when the SH increases from 5.54 to 12.34 m.
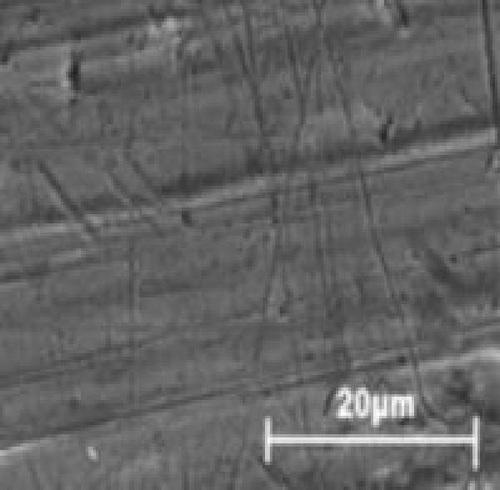
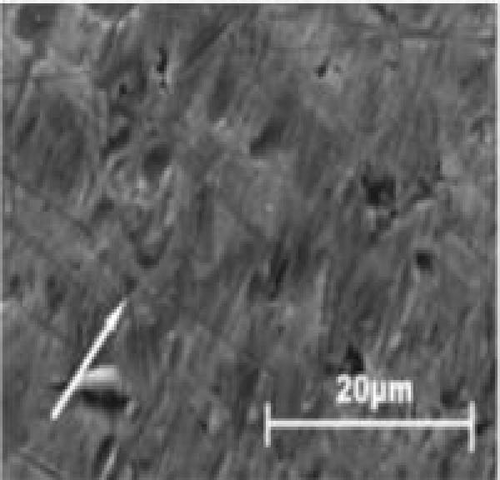
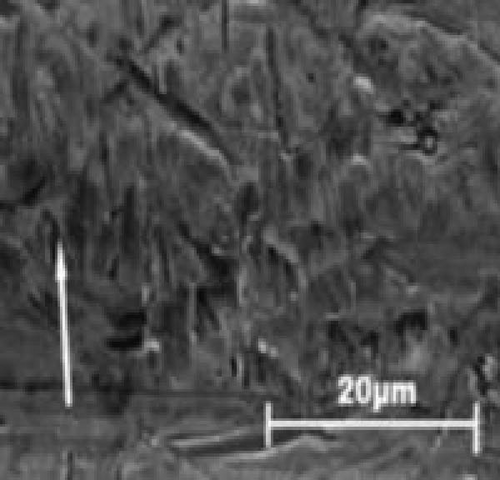
SEM results are presented in Figure 18 to investigate the effect of cavitation on the runner blade surface. Degradation of metal surface increases with higher values of SHs and FVs. Moreover, the dense nature of pits is visible in Figure 18(c).
4. Conclusion
- (1)
A cavitation vortex rope is generated; as a result, pressure pulsation is observed, which is maximum for the overload condition and minimum for the rated load condition.
- (2)
The cavitation rate is three and five times higher for the part and overloads conditions, respectively, compared to the rated load condition.
- (3)
The cavitation rate becomes 50% higher when the SH increases from 5.54 to 12.34 m.
- (4)
SEM results have confirmed the CFD results; higher FV and SH enhance the cavitation rate.
- (5)
The current study will be helpful for hydel power plants to reduce damage caused by the cavitation problem at the Francis turbine components, such as the runner and draft tube.
In the future, the coalescence effect of sediment and cavitation erosion work will be investigated, which is expected to predict the cavitation damage more accurately and precisely.
Conflicts of Interest
Authors declare that there is no conflict of interest for this original research.
Acknowledgments
The article is funded by the authors.
Open Research
Data Availability
All data used in the manuscript will be available up on request.


