Long-Term Multiyear Transmission Expansion Planning in Turkish Power System
Abstract
To sustain the clean energy transition without interruption and to ensure the reliable operation of the transmission system, it is required to have enough additional transmission capacity in the future horizons. The transmission expansion planning (TEP) problem is a core issue in deciding additional transmission capacity in the planning activities. TEP aims to find the best expansion plan while satisfying technical and economic constraints. In this study, a new binary version of the original FBI algorithm called the BFBI (binary forensic-based investigation) algorithm is developed to solve the binary TEP problem. The effectiveness and performance of the developed BFBI are assessed by implementing it in two different test systems: the standard Garver 6-bus test system and the modified 400 kV Turkish grid. Seasonal scenarios are created for 5- and 10-year planning periods to cover all possible generation and load conditions and to assess the impact of the increased share of RES on the grid in the TEP studies conducted for the modified 400 kV Turkish grid created as a bulk realistic grid. The TEP problem is solved by including investment, reliability, and operational costs in two different objective functions for cases while considering the N-1 contingency criterion. The efficacy and robustness of the BFBI algorithm are justified by comparing it with well-known algorithms such as GA and PSO.
1. Introduction
The clean energy transition, broadly defined as the decarbonization of the energy sector and the achievement of net zero emission targets due to environmental concerns, will continue to be the most critical issue for countries worldwide in the coming years. Although renewable energy investments, energy storage systems, electric vehicles, and hydrogen technology, along with the power to x concept, play a crucial role in the transition to clean energy, transmission grids are at the center of all these energy transition issues. Therefore, this transition inevitably creates the need for additional transmission capacity. Especially in the future, the increase in load demand and the share of renewable resources, usually installed in areas far from major load centers, require extra transmission capacity. Appropriate investments in strengthening and expanding transmission grids are required to create additional capacity. From a global perspective, development investments in transmission and distribution grids are projected to reach 600 billion $ a year by 2030. In addition, to meet energy and climate targets, 80 million km of new lines must be added to grids by 2040 [1].
With the transition to clean energy, large-scale investments in transmission grid development again reveal the necessity of efficient and accurate transmission planning studies. Since new investments in the grid will bring more cost per unit of electricity to the end user, transmission planning is a strategic planning process that considers economic, environmental, and technical factors. Transmission planning aims to realize grid development activities with a minimum cost in planning horizons. Recently, transmission planning has been facing new goals and objectives, such as increasing security and reliability, reducing constraints, increasing fair access to the grid for market players, and increasing the competitiveness of the market.
TEP is the process of identifying the additional transmission lines required to meet the increasing demand and generation in future planning periods without any operational constraints on the grid [2]. TEP is a very attractive research area. However, it is also a complicated and challenging task for large and complex transmission grids. The objectives of TEP include enhancing the security of supply, improving security and reliability, minimizing environmental impact, and increasing the total social benefit in the electricity market [3].
1.1. Literature Review and Contributions
TEP is an optimization problem that finds the optimal solutions to problems such as when, where, and how many circuits are needed to build new transmission lines based on different objective functions and constraints [4, 5]. The TEP problem is multiobjective, binary, nonlinear, nonconvex, constrained, and complex by its nature [6]. In traditional transmission planning studies, the main component of the objective function is to minimize the total cost of new transmission lines. However, in recent years, new objective functions and constraints have been included in the TEP with changing grid and electricity market conditions [7]. In [8], the objective function includes loss of load cost (LOLC) as a reliability index in addition to the line cost. In [9], the operation cost due to line congestion is merged into the objective function. In [10, 11], another critical issue, the N-1 security constraint in the system security criterion, is included in the TEP.
TEP studies are conducted for different time horizons. Medium-term TEP is conducted less than 5-year periods, while long-term TEP is implemented for periods of more than 5 and 10 years [12]. Regarding the time slots selected in planning horizons, TEP is traditionally classified as static (single-stage) and dynamic (multistage). If the planner is looking for optimal solutions for a single time slot in the planning horizon, it is defined as static TEP. Here, the planner is not interested in when new transmission lines will be installed since the final solution will be obtained for a single static future state. Dynamic TEP differs from static TEP in which the planning horizon is divided into many time horizons, and optimal solutions are sought for each time horizon. In this case, the planner has to deal with the location of the new transmission line, the number of circuits, and its timing [13].
For the transmission grid, the DC model based on DC load flow equations and the AC model based on AC load flow equations are used in the TEP studies [14]. The AC model allows planners to analyze parameters such as grid loss, reactive power flow, and voltage stability. The DC model is a linearization and simplification of the AC model with some assumptions [15]. The AC model accurately represents the grid, but the DC model is widely used due to the complexity of the TEP problem and the large computational burden [16].
In solving the TEP problem, efficiency is crucial, along with obtaining accurate results. The optimization algorithms to solve the problem should be efficient enough [17]. Although various algorithms are used in modeling and solving the TEP problem, these algorithms are generally categorized as mathematical and metaheuristic. Mathematical algorithms use mathematical techniques to solve the TEP problem and are called conventional methods. Among the mathematical algorithms, there are linear programming (LP) [18], nonlinear programming (NLP) [19], mixed integer linear programming (MILP) [20], mixed integer nonlinear programming (MINLP) [21], hierarchical techniques (HT) [22], benders decomposition (BD) [23], and branch bound (BB) [24]. Mathematical algorithms give good results for small and less complex systems. Considering the complexity of the TEP problem and the size of the search space, the solutions take a long time, which reduces the solution’s efficiency, and the divergence problem might become a current issue. In recent years, metaheuristic algorithms have been gaining popularity as an alternative to overcome the drawbacks of mathematical algorithms in the solution of TEP [20]. The development of metaheuristics generally begins with inspiration from nature, offering better performance and higher quality solutions in a shorter time. In the solution of TEP, novel metaheuristic algorithms such as constructive metaheuristic algorithm (CMA) [25], tree searching heuristic algorithm (TSHA) [26], orthogonal crossover-based differential evolution (OXDE) [27], teaching learning-based optimization (TLBO) [28], shuffled frog leap algorithm (SFLA) [29], and salp swarm algorithm (SSA) [30] have been widely used in recent years. In addition to novel approaches, relatively old metaheuristic algorithms such as particle swarm optimization (PSO) [31], nondominated sorting genetic algorithm-2 (NSGA-2) [32], ant colony optimization (ACO) [33], artificial bee colony (ABC) [34], and grey wolf optimization (GWO) [35] continue to be used in TEP studies.
In the literature, TEP studies are generally classified according to algorithms, objective functions and constraints, network models, planning horizons, and test systems. Table 1 summarizes the classification based on the characteristics of algorithms used in recent years in TEP studies.
| Solution method | Optimization solver/programming environment | Objective function | Security criterion | Planning horizon | Grid model | Test system | |||
|---|---|---|---|---|---|---|---|---|---|
| Investment cost | Operational cost | Loss of load cost | |||||||
| [25] CMA | EB1 | GLPK | ✓ | ✓ | ✓ | N-1 | S5 | DC | Brazilian 242-bus system |
| [26] TSHA | EB | NS4 | ✓ | ✓ | X | N-1 | D6 | DC | Garver’s 6-bus test system and South Brazilian system |
| [27] OXDE | EB | MATLAB | ✓ | ✓ | X | N-1 | S | DC | Garver’s 6-bus test system and IEEE 118-bus test system |
| [28] TLBO | HB2 | MATLAB | ✓ | X | X | N-1 | S | DC | Garver’s 6-bus test system and Brazilian 46-bus system |
| [29] SFLA | EB | NS | ✓ | X | X | N-1 | S | DC | Garver 6-bus test system and IEEE 24-bus test system |
| [30] SSA | SB | MATLAB | ✓ | X | X | N-1 | S | DC | IEEE 24-bus test system, Brazilian 46-bus system, and Columbian 93-bus system |
| [31] PSO | SB | MATLAB | ✓ | ✓ | X | N-1 | D | DC | Garver’s 6-bus test system and IEEE 24-bus test system |
| [32] NSGA-2 | EB | NS | ✓ | X | X | N-1 | S | DC | Garver’s 6-bus test system and IEEE 24-bus test system |
| [33] ACO | SB3 | MATLAB | ✓ | ✓ | X | X | D | DC | Garver’s 6-bus test system and IEEE 118-bus test system |
| [34] ABC | SB | MATLAB | ✓ | ✓ | ✓ | X | S | DC | Modified network of the Azerbaijan region |
| [35] GWO | SB | NS | ✓ | ✓ | ✓ | N-1 | S | AC | Garver’s 6-bus test system |
| [36] AUSTEP | MB7 | GAMS | ✓ | ✓ | X | X | S | DC | Garver’s 6-bus test system and Northwestern Chinese grid |
| [37] PDRTEP | MB7 | CPLEX | ✓ | ✓ | ✓ | ✓ | S | DC | Garver’s 6-bus test system and Northwestern Chinese grid |
| BFBI | HB | Python | ✓ | ✓ | ✓ | N-1 | S | DC | Garver’s 6-bus test system and modified 400 kV Turkish grid |
- 1Evolutionary based; 2human based; 3swarm based; 4not specified; 5static; 6dynamic; 7mathematical based; ✓included; x not included.
The forensic-based investigation (FBI) algorithm is a newly developed efficient optimization algorithm inspired by the suspect investigation, location, and pursuit process in criminal cases, which is being applied to solve continuous optimization problems [38]. The FBI algorithm has been used effectively in solving optimization problems in various fields, such as the optimal design of frequency-constrained dome structures, parameter extractions of solar cell modules, selection of structural design parameters, classification of patched and unpatched potholes, and identification of the ideal parameters for a fractional-order PID-based maximum power point tracking system for proton exchange membrane (PEM) fuel cells [39–43]. The FBI algorithm is effective because it needs a few control parameters to achieve the optimal solution for the problems. Moreover, it is quite capable and accurate in solving large-scale and high-dimensional problems [44].
In this study, a new binary version of the FBI algorithm called the BFBI algorithm is proposed to solve the TEP problem. The original FBI algorithm is not able to solve binary optimization problems. To overcome this drawback and use it in solving the TEP problem, we have developed the BFBI algorithm, which is proposed as a new binary variant of the original FBI algorithm. In addition, GA and PSO algorithms are used as benchmarks to evaluate the performance of the BFBI algorithm in solving the TEP problem. GA and PSO algorithms are relatively old metaheuristic optimization algorithms that perform well and are widely used to solve continuous problems. Many variants of the traditional GA and PSO algorithms have been developed and used to solve binary problems such as TEP [45, 46]. This study aims to achieve robust and efficient transmission expansion for future planning horizons by considering reliability and security criteria in transmission grids.
- (1)
The FBI algorithm is proposed to solve the TEP problem.
- (2)
The binary version of the FBI algorithm called BFBI algorithm is introduced. The BFBI algorithm is developed by integrating the hyperbolic tangent transfer function and position update rule into the original FBI algorithm to solve the binary TEP problem.
- (3)
The TEP problem is solved by including investment, reliability, and operational costs in two objective functions for cases with considering the N-1 contingency criterion. For the first time, seasonal scenarios are created for 5- and 10-year planning periods to cover all possible generation and load conditions and to assess the impact of the increased share of RES on the grid in TEP studies conducted for the modified 400 kV Turkish grid created as a bulk realistic grid.
- (4)
In order to benchmark in solving the TEP problem, the optimization results are compared with well-known algorithms in the literature such as GA and PSO. Quantitative and statistical indicators are analyzed to evaluate the performance of the BFBI algorithm.
- (5)
The results verified that the BFBI algorithm is an accurate, convergent, balanced, and effective metaheuristic optimization algorithm to solve the TEP problem.
The rest of the paper is organized as follows: the TEP problem formulation is presented in Section 2. The BFBI algorithm is described and the general strategy for implementing the algorithms is given in Section 3. The obtained results are discussed in Section 4. Finally, conclusions are given in Section 5.
2. TEP Problem Formulation
TEP is the problem of determining transmission line investments on a cost-effective basis by satisfying economic and technical constraints to ensure the security of supply in future planning horizons. In addition to minimizing line investment costs, various objectives and constraints are also defined in the problem. In this study, two different objective functions are modeled. In the first one, for the Garver-6 bus test system, the minimization of the total cost of new lines to be added to the grid and loss of the load cost is modeled as the objective function widely used in the literature. In the second one, the objective function of the TEP problem has been modified for the real grid. In addition to line investment costs, the additional operational costs incurred as a result of redispatch (bringing generation and load to a new equilibrium point) have also been included in the objective function in order to eliminate line congestions and to prevent the formation of isolated parts that may occur in the grid to maintain system operational security. In addition, the N-1 security criterion is considered in both objective functions.
2.1. Multiobjective Function
The security approach in transmission grids considers the continuation of the operation without any outage in the grid in case one or more elements are out-of-service in a grid with N elements. N-1, N-2, and N-1-1 are system security criteria frequently used in transmission grid studies. In TEP studies, the N-1 security criterion is commonly used, which makes the TEP problem more complex and the solution to the problem more difficult. In the TEP study for the Garver 6-bus test system, the out-of-service of each line in the grid is included in the TEP problem as a security criterion, while in the TEP study for the Turkish grid, the N-1 contingency line list is created according to the reference limits determined depending on the loading of the lines in the grid in the N case and included in the TEP problem.
Lack of capacity of transmission lines in the transmission grid can cause line congestions. When line congestions occur in N or N-1 cases, generation and/or load must be rescheduled to ensure system reliability. Essentially, redispatching causes additional operational costs for TSOs. In addition, the inadequacy of the grid, especially in N-1 cases, may lead to the formation of isolated regions in the grid that are regionally disconnected from the main grid. This is an undesirable operational condition in terms of the system operation and system reliability. Thus, eliminating isolated regions in the grid also incurs new additional operational costs for TSOs.
Two different objective functions are used in this study: the LOL cost and investment cost are considered in equation (7) and the operational cost and investment cost are considered in equation (8). The transmission system planner creates an investment plan according to the result obtained by minimizing the total costs in the objective function in equations (7) and (8).
2.2. Constraints
Equations (11) and (12) denote the power flow constraints between bus i and bus j in the N and N-1 cases, respectively. Maximum limits of the power flow between bus i and bus j are calculated by using thermal capacity of the lines. Equation (13) shows the maximum and minimum generation limits at each bus. Generation limits are calculated by summing the generators connected to each bus. Equation (14) shows the loss of load limits, and equation (15) shows the new line limits that can be added for each right-of-way (corridor).
3. Proposed Algorithms
In this section, original FBI algorithm is described, and then developed BFBI algorithm to solve binary optimization problems is explained. The general flow diagram of the TEP implementation model is also given. However, GA and PSO algorithms used in this study to benchmark the performance of the BFBI algorithm are not described in detail as they are well known and widely used algorithms in the literature.
3.1. Original FBI Algorithm
In recent years, numerous metaheuristic optimization algorithms inspired by natural and human-based processes have been developed. The FBI algorithm was recently proposed by Chou and Nguyen as a human-based metaheuristic optimization algorithm in 2020 [38]. The algorithm is based on the process by which police investigate, pursue, and locate a suspect in criminal cases [42]. FBI is powerful, efficient, stable, and user-friendly than other algorithms to solve continuous nonlinear problems [43].
The FBI process can mainly be divided into six steps: opening a case, interpretation of findings, inquiry direction, actions, extension of actions, and prosecution. The process starts when a criminal event occurs and is reported and ends after the case is solved and the truth comes out. The FBI process has two main phases: the investigation phase and the pursuit phase. In the investigation phase performed by the investigation team, interpretation of findings and direction of investigation are carried out, whereas in the pursuit phase performed by the pursuit team, action-oriented steps are taken, starting with the most promising search direction first and collecting the data about the case. At the end of each action, the investigation team interprets new findings and information gathered, and new investigation directions are determined. The investigation phase corresponds to the exploration phase, and the pursuit phase corresponds to the exploitation phase in the metaheuristic optimization literature.
Figure 1 shows the steps of the FBI process. The middle four steps of the process are seen as a cycle that continues until the truth is revealed. The investigation team performs Step 2 and Step 3, whereas the pursuit team performs Step 4 and Step 5. Step 1 is the occurrence of the incident, the filing of a complaint and the opening of a case file, while Step 6 is the final step, which is the uncovering of the truth and the prosecution of the suspect. Those steps are briefly explained as follows [39, 40, 47]:

3.1.1. Step 2 (A1)
3.1.2. Step 3 (A2)
3.1.3. Step 4 (B1)
3.1.4. Step 5 (B2)
3.2. Binary Transformation of the Original FBI
Optimization problems are divided into two main categories regarding search space: binary and continuous problems. In binary problems, search agents take only 0 or 1 in the search space, while in continuous problems, agents might take fractional values in the search space. The FBI algorithm was initially developed to solve continuous problems. However, numerous binary optimization problems exist, such as TEP, in which decision values take only binary values (1 or 0) since the problem is adding or not adding a new transmission line. Therefore, a transformation is required to move particles to binary space. We have introduced a new binary variant of the FBI algorithm by integrating a transfer function into the original FBI algorithm to solve the binary TEP problem.
Transfer functions are among the most widely used techniques because of their simplicity as an operator in the binary transformation [48]. Various transfer methods have been introduced from continuous search space to binary space, such as v-shaped [49], s-shaped [50], o-shaped [51], z-shaped [52], x-shaped [53], cosine transfer function [54], and hyperbolic tangent transfer function [55]. In this study, the hyperbolic tangent transfer function is used to convert the continuous search space to a binary one since it has some advantages, such as a few control parameters, an effective convergence rate, and the simplicity of implementation.
In the TEP process, the binary value of an individual, which is obtained at the end of the transformation process, contains information about whether a candidate line will be added to the grid and how many lines will be added to the grid in the planning horizons. A representation of the triple binary structure of the individuals can be seen in Figure 2.
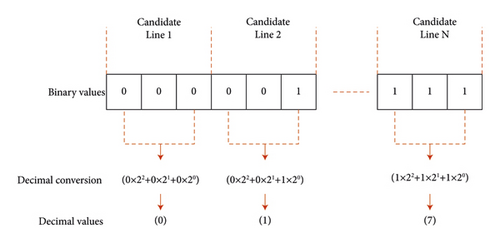
In the TEP study for the Turkish grid, as the new line limit that can be added for each corridor is decided as one, each triple binary value of an individual contains just information about which candidate line in the candidate set will be added to the grid. In the TEP study for the Garver 6-bus test system, as the new line limit for each corridor is decided as seven, each triple binary value of an individual contains both information of which the candidate line in the candidate set will be added into the grid and the number of the related candidate line to be added with their decimal conversion.
3.3. TEP Problem Solving Flowchart
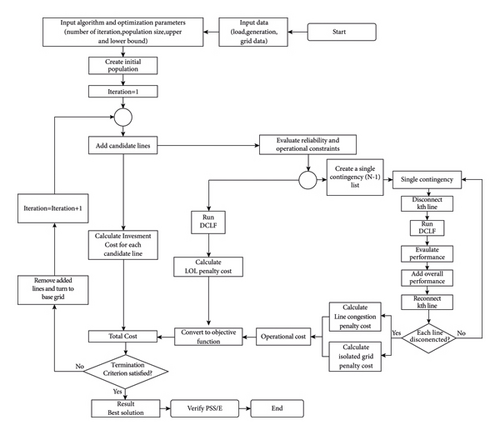
The general flow diagram of the TEP implementation model is shown in Figure 3, which allows the BFBI algorithm to be applied along with other algorithms to solve the TEP problem. The model is initialized by defining the data about the grid (line, bus, load, generation, and so on) and the optimization algorithm parameters to be used (number of iterations, number of populations, upper and lower bounds, and so on) as input to the model. The initial population of the algorithm is generated in a randomized fashion to obtain an initial solution. Then, the iterative iteration loop is started. In the loop, lines from the candidate line set are added to the model one by one and the model is run according to the objective function to be used in the model. If the objective function includes only the investment cost of the new lines to be added to the grid, only investment costs are calculated in the model, and the total cost is taken. If the objective function of the model includes operational costs, loss of load costs, and N-1 in addition to investment costs, the total cost is obtained by calculating the costs separately for these objectives. This iterative process continues until the number of iterations determined at the beginning of the model is completed and the solution set is obtained. After the stopping condition required for the completion of the model is met, the optimal result is found from the solution set. The model is completed by static verification of the optimal result based on DC power flow in the PSS/E power system analysis program.
4. TEP Applications
This section includes the implementation of the BFBI algorithm introduced in Section 3 to solve the TEP problem. First, a preliminary evaluation study is executed on the standard Garver 6-bus test system, one of the well-known and the most commonly used test system, to prove the capability of the BFBI algorithm. The optimization and statistical results, using the BFBI algorithm, are compared to results obtained in previous studies. Then, both algorithms are applied for eight scenarios seasonally created for 5- and 10-year planning periods on the modified 400 kV Turkish grid to find the optimal expansion plan. The findings obtained from BFBI are evaluated in comparison with GA and PSO algorithms. The DC model is employed to model the TEP problem. An open-source Panda Power library of Python is used to create grids as the test system and to carry out power flows. The modeling and solving of the optimization problem are conducted using Python. The studies use a 64 bit, 2.6 GHz computer with 32 GB RAM.
4.1. Application to the Garver 6-Bus Test System
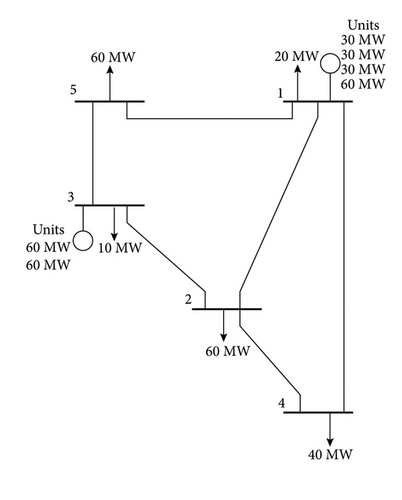
The standard Garver 6-bus test system is used as one of the test systems in implementing the BFBI algorithm. The system, whose base topology is shown in Figure 4(a), consists of five buses and six lines connecting; however, the sixth bus is initially considered disconnected. In the initial configuration, the system’s total installed generation capacity and load are 270 MW and 190 MW, respectively. In the planning horizon, it is planned that the system load will be increased by four times and reach 760 MW, and the total installed capacity will reach 1110 MW by connecting the power plant at the sixth bus to the system. Furthermore, fifteen candidate corridors are identified where a maximum of seven circuits of the line can be installed in each corridor to solve the TEP problem. The dataset and detailed system description can be found in [56]. In the second stage, the results obtained with the BFBI algorithm are compared with results obtained using conventional and metaheuristic algorithms such as MILP, MINLP, BD, tabu search (TS), modified gases Brownian motion optimization (MGBMO), artificial neural network (ANN), linear success history-based differential evolution (LSHADE) in the literature. The statistical results are obtained and analyzed to demonstrate the effectiveness of the BFBI algorithm.
4.1.1. Optimization Results
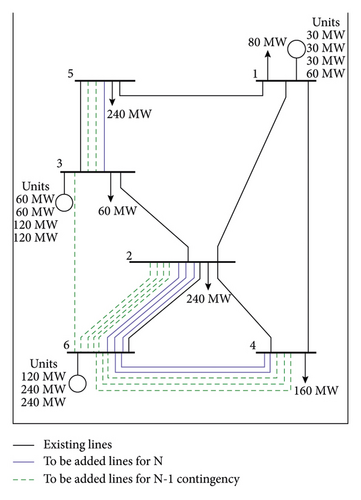
The TEP problem is solved for the case where the generation values of the power plants are predetermined deterministically, and generation resizing is not considered for N and N-1 states. As the optimum solution, the optimal total cost for the N case is 200 M$. After including the N-1 security criterion in the TEP problem, the optimal total cost is found to be 298 M$, increased by 49%. Table 2 presents new lines to be added to the system using the BFBI, GA, and PSO algorithms and gives a comparison to MILP, MINLP, BD, MGBMO, ANN, and LSHADE algorithms. The BFBI algorithm can find better or similar optimal solutions to previous algorithms, where the total cost is 31 M$ less than MINLP and ANN algorithms, which can be deduced from Table 2. The system’s new topology after the TEP is shown in Figure 4(b). In Figure 4(b), the optimal solutions obtained for the N and N-1 cases are shown as solid blue lines and dashed green lines, respectively.
| Algorithm | Installed lines | Max total cost (M$) | Min total cost (M$) | Mean total cost (M$) | Standard deviation | Variance | Average computational time (s) |
|---|---|---|---|---|---|---|---|
| BFBI |
|
220 | 200 | 202 | 6.10 | 37.24 | 4.56 |
| BFBI (N-1 case) |
|
368 | 298 | 316.9 | 17.85 | 318.78 | 35.04 |
| [57] GA |
|
— | 200 | — | — | — | Not reported |
| GA (N-1 case) |
|
546 | 300 | 406.2 | 65.25 | 465.8 | 9.54 |
| [56] PSO |
|
— | 200 | — | — | — | Not reported |
| PSO (N-1 case) |
|
793 | 563 | 673.8 | 49.52 | 245.31 | 19.2 |
| [58] MILP |
|
— | 200 | — | — | — | Not reported |
| [21] MINLP | — | — | 231 | — | — | — | Not reported |
| [59] BD |
|
— | 200 | — | — | — | Not reported |
| [60] MGBMO |
|
270 | 200 | 210.8 | — | — | 34.3 |
| [57] ANN | — | — | 231 | — | — | — | Not reported |
| [13] LSHADE |
|
— | 200 | — | — | — | 6.68 |
4.1.2. Performance Evaluations of Algorithms
Performance indicators including convergence, population diversity, exploration and exploitation are used to evaluate the performance of the BFBI algorithm. In order to understand the trade-off between diversification and intensification, population diversity, exploration, and exploitation behaviors have been examined. In addition, the convergence curve has been analyzed to show how the solution converges to the optimal location. Obtained figures related to these factors are analyzed and interpreted based on the approach offered in [61]. The defined values for the parameters of the BFBI algorithm are given in Table 3.
| Parameter | Value |
|---|---|
| Population of individuals | 50 |
| Number of iterations | 500 |
| Number of runs | 30 |
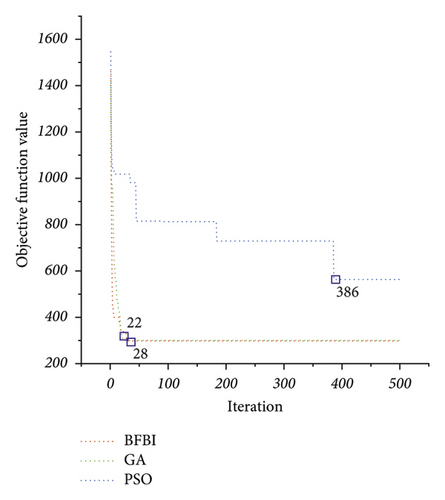
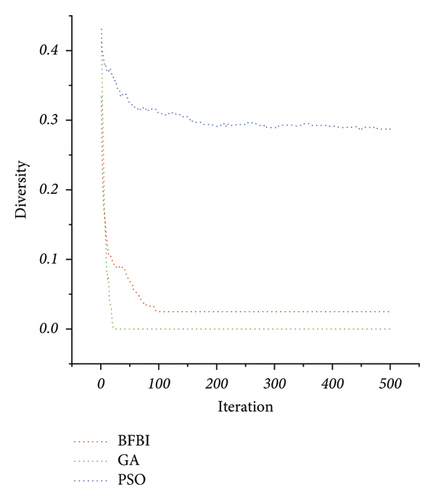
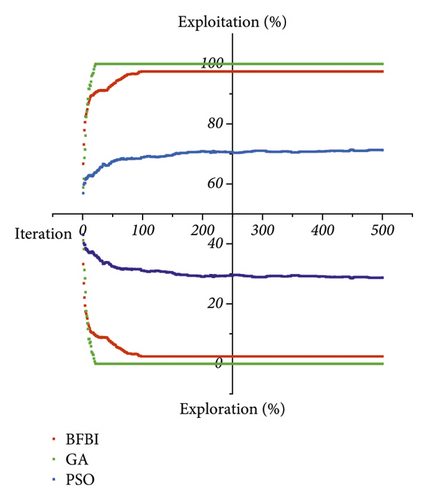
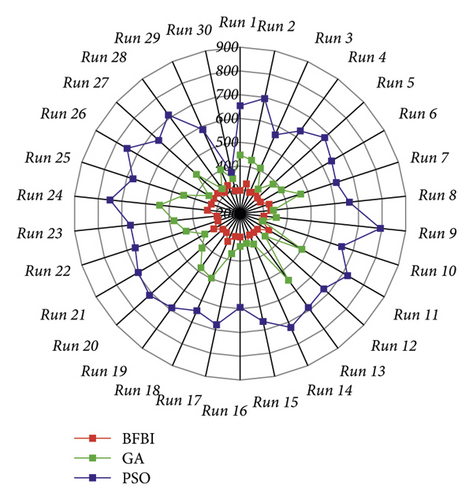
Figure 5 gives a quantitative comparison of algorithm performances by considering the N-1 contingency. The convergence plot of the algorithms for the best run among all runs is presented in Figure 5(a). GA is the fastest algorithm, reaching the optimum solution in the 22nd iteration, while the BFBI algorithm reaches the optimum solution in the 28th iteration. The PSO algorithm is the worst, reaching the optimum solution with the 386th iteration. In Figure 5(b), the population diversity measurements can be seen for the best run among all runs. The diversity approaches zero in GA by finding the most promising search directions. However, for the BFBI algorithm and PSO algorithm, it does not decrease to zero even after all iterations. Furthermore, decreasing the diversity before converging to the optimum solution in the problem-solving process is undesirable. Although the optimum solution is found in the 28th iteration, the BFBI algorithm manages to keep the population diversity high. Figure 5(c) depicts the exploration and exploitation capabilities of the algorithms for the best run among all runs. The BFBI algorithm performs quite a trade-off balance between exploration and exploitation. Figure 5(d) shows the best fitness values obtained from each run.
Average computational times required for solving the TEP problem by BFBI, GA, and PSO algorithms for N-1 contingency are presented in Table 2. It can be observed that the BFBI algorithm needs more computational time than GA and PSO algorithms. However, in the real case, since it takes many years (5, 10 years) for a transmission line to be planned, invested, and installed, the calculation times given in Table 2 for BFBI are acceptable for transmission system planners.
Based on the analyzed results, due to its powerful abilities, the BFBI algorithm can be accepted as an accurate, convergent, balanced, and effective metaheuristic optimization algorithm for solving the TEP problem.
4.2. Application to the Modified 400 kV Turkish Grid
This section includes evaluations of the adequacy of existing transmission lines and the optimal determination of new transmission lines needed to maintain the system balance for a realistic bulk grid in planning horizons. The BFBI, GA, and PSO algorithms are tested on the modified 400 kV Turkish grid for seasonal scenarios. Each season is built based on the actual generation and consumption values representing the entire grid to find optimal investment solutions in the 5- and 10-year planning periods. In the TEP problem, to converge this study to real planning conditions, the N-1 security criterion is taken into consideration. Furthermore, in addition to the investment cost, additional operational costs incurred in redispatching to ensure operational security are included in the objective function. Hence, the objective function includes penalties for both N and N-1 contingency cases to alleviate line congestions and prevent the formation of isolated parts in the grid. Overall results are assessed by comparison.
4.2.1. System Description
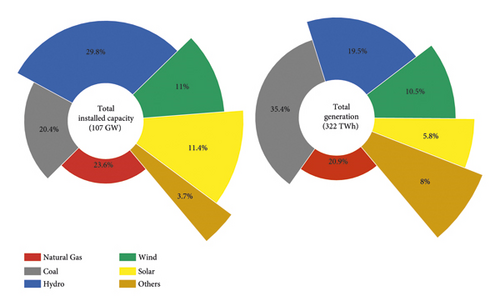
The Turkish transmission grid comprises approximately 75,000 km of transmission lines and 1500 substations at 400 kV and 154 kV. Since 2010, the Turkish grid has been synchronously connected to the CESA (The Continental Europe Synchronous Area) through 400 kV interconnection lines with Bulgaria and Greece. In addition to these connections, there are also interconnections with other neighboring countries at 400 kV and 154 kV. By the end of 2023, Türkiye’s total consumption reached 322 TWh, and the total installed capacity reached 107 GW [62]. Figure 6 shows distribution of total installed capacity and generation by resources in Türkiye by the end of 2023.
TEIAS is the transmission system operator in Türkiye and is responsible for secure and reliable transmission grid operation while maintaining its stability. One of the tasks included in this responsibility is to carry out long-term transmission system planning studies to ensure adequate transmission capacity for the increasing demand and generation of electricity in the future. Long-term transmission system planning studies are carried out within the scope of the Turkish grid code, which includes transmission grid design principles.
In this study, 400 kV line planning is considered as the main backbone of the Turkish transmission grid. Since the realization of 400 kV transmission line investments takes 5 and longer periods, 5- and 10-year planning periods are determined. In this context, the main objective of this study is to determine the optimal line investments in the 400 kV grid for 5- and 10-year planning periods.
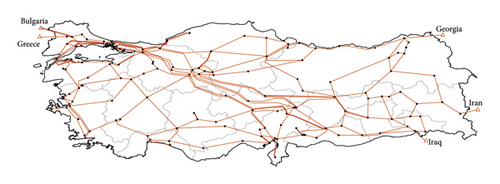
As a first step, the reference grid used as a test system in this study has been created doing some modifications on the 400 kV Turkish grid. These modifications include merging some generation and load buses (substations) to form aggregated buses, and moving generation and load values at the 154 kV and 36 kV grids to the 400 kV grid using the bottom-to-up method. The reference grid topology consists of 187 buses and 319 lines. The reference grid’s total load and installed capacity are 53.2 GW (peak value of the year) and 100.6 GW, respectively. At the end of the 10-year planning period, 23 new generations and load buses will be added to the reference grid in the light of load and generation data for the current and planning periods. The number of candidate lines is 283, including 187 lines selected from existing ones and 96 new corridors. Weather conditions such as strong winds, heavy snowfalls, and ice loads can cause physical damage to transmission lines. Damage and destruction of transmission lines can directly affect system security. In order to increase system security, it is not preferred to install double-circuit transmission lines on a single pole and to install more than one transmission line from the same corridor. Thus, due to system security concerns, it is assumed that a single circuit line can be installed in each right-of-way. Figure 7 shows the corresponding single-line diagram of the reference grid.
Since the capacities (thermal capacity) of the lines in the grid vary seasonally, the values in the Turkish grid code are used in this study and the thermal loading thresholds for each line type are given in Table 4. For planning studies, it is assumed that the new line type to be added to the grid will be 3 bundle pheasant (3P), and its cost will be 1 M$/km.
| Line type | Thermal loading thresholds of the line (A) | |||
|---|---|---|---|---|
| Spring | Summer | Fall | Winter | |
| 2R (rail) | 1436 | 1200 | 1436 | 1962 |
| 2C (cardinal) | 1450 | 1210 | 1450 | 1962 |
| 3C (cardinal) | 2179 | 1830 | 2179 | 2987 |
| 3P (pheasant) | 1634 | 2199 | 1634 | 3579 |
| Underground cable (2000 mm2) | 1500 | 1500 | 1500 | 1500 |
| Submarine cable (1600 mm2) | 1500 | 1500 | 1500 | 1500 |
4.2.2. Seasonal-Based Scenarios
To maintain the secure and stable operation of the grid in future planning horizons, TEP studies should be conducted by creating scenario sets that include generation and load conditions for different operating points in the grid [63]. In this context, eight scenarios have been created seasonally based on generation and load expectations for 5- and 10-year planning horizons. For each scenario, generation and load values are determined based on statistical data to reflect the seasonal characteristics. Thus, the optimum new line requirements are found by stressing the grid for different generation and load conditions. A comprehensive approach has been considered in defining and implementing the scenarios.
(1) Spring Scenario. In this scenario, while the minimum load (lowest condition) occurs in the spring months, hydro-based power plants, located in the north and east of the country, operate intensively. The effects of increasing the energy generation of hydroelectric power plants in the lowest load conditions on the grid are analyzed with this scenario.
(2) Summer Scenario. Since the maximum load (peak condition) in the Turkish grid occurs in the summer months, the summer scenario is created to determine the need for new lines by maximizing the interregional lines in the load flows from the regions with high generation to the regions with increased load. The summer scenario can be considered as the worst-case scenario.
(3) Fall Scenario. In the fall months, the load is higher than that in the spring, hydro generation is lower, and wind and solar generation is higher than that in the spring. The fall scenario determines the line requirements between regions when wind and solar generation and load are at the year’s average.
(4) Winter Scenario. In the winter months, the load is less than that in the summer months. Fossil-fired generation plants operate intensively to meet demands, thanks to the lack of hydro and other renewable generations. This scenario has led to the need for new lines between regions with fossil-based generation and regions with high load.
Possible differences are identified creating the scenarios. In this context, with these scenarios, it is aimed to cover the areas for all possible generation and load conditions of the grid. Table 5 summarizes the impact factors that cause stress to the grid in each scenario.
| Spring scenario | Summer scenario | Fall scenario | Winter scenario | |
|---|---|---|---|---|
| Load | −− | +++ | + | ++ |
| Fossil fired generation | −− | ++ | + | +++ |
| Hydro generation | +++ | + | + | −− |
| Wind generation | + | +++ | +++ | ++ |
| Solar generation | −− | +++ | +++ | − |
- + stands for moderate; ++ stands for high; +++ stands for highest; − stands for low; −− stands for lowest.
In seasonal-based scenarios, it is essential to determine generation and consumption profiles in which generation and consumption balance is achieved. For each scenario, the load value and the generation dispatch to meet this load value are obtained by considering the impact factors given in Table 5.
Figure 8 shows the total load values used for each scenario and it is assumed that the peak load will occur in the summer scenario and the minimum load in the spring scenario.
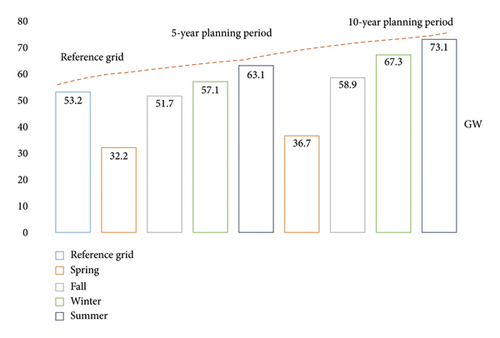
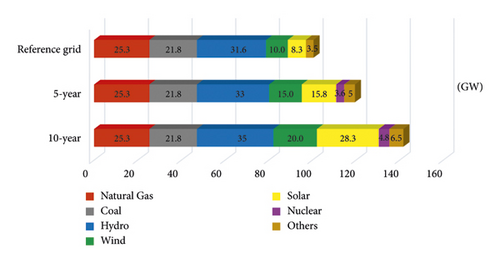
Figure 9 shows total installed capacity development by resources used for generation dispatch in the 5- and 10-year planning periods. At the end of the 10-year planning period, the installed capacity of the grid is assumed to be 141.7 GW. Compared to the reference grid, the installed capacity of fossil fuels (natural gas and coal excluded nuclear) is assumed not to increase, whereas RES (wind and solar) capacity is assumed to reach 48.3 GW. Considering the increase in RES capacity at the end of planning periods and RES generation contribution in each scenario, it is aimed to evaluate the impact of RES on TEP studies.
4.2.3. Optimization Results
The TEP problem is solved using the BFBI, GA, and PSO algorithms for the case where N-1 contingency is considered. Table 6 presents results, including optimal investment cost, operational cost, and total expansion line length to be added to the modified 400 kV Turkish grid. The results in Table 6 indicate that in some scenarios, the BFBI algorithm suggests cheaper solutions than the GA and PSO algorithms; however, in some scenarios, GA algorithm suggests cheaper solutions. The PSO algorithm suggests the most expensive solutions for all scenarios. Furthermore, for some scenarios, GA and PSO algorithms propose solutions with additional operational costs to achieve a less investment cost. This results in a less investment cost and shorter transmission lines, while the additional operational cost increases the total cost. The risk to system security is significantly increased when lines are overloaded and congested, which is an undesirable operational state for TSOs. In addition, forming isolated parts separated from the main grid is also undesirable for the system operation. These two crucial operational states cause additional operational costs incurred by TSOs in redispatch to ensure operational security, eliminate the line congestions, and prevent the formation of isolated parts in the grid. As an important output, it can be deduced that the results obtained with the BFBI and GA algorithms converge to the real states in real and large grids, while the PSO algorithm does not.
| Scenario | Planning period | Investment cost (M$) | Operational cost (M$) | Total expansion (km) | ||||||
|---|---|---|---|---|---|---|---|---|---|---|
| BFBI | GA | PSO | BFBI | GA | PSO | BFBI | GA | PSO | ||
| Spring | 5 year | 2777.17 | 2727 | 10170.93 | 0 | 0 | 0 | 2777.17 | 2727 | 10170.93 |
| 10 year | 4440.71 | 4648.46 | 10652.32 | 0 | 0 | 0 | 4440.71 | 4648.46 | 10652.32 | |
| Summer | 5 year | 2646.45 | 2573 | 4205.8 | 0 | 1010.36 | 2020.72 | 2646.45 | 2573 | 4205.8 |
| 10 year | 5112.64 | 4205.8 | 12693.27 | 0 | 0 | 0 | 5112.64 | 4205.8 | 12693.27 | |
| Fall | 5 year | 1909.54 | 2069.25 | 2008.45 | 0 | 0 | 2000 | 1909.54 | 2069.25 | 2008.45 |
| 10 year | 3752.65 | 3787.5 | 9606.06 | 0 | 0 | 0 | 3752.65 | 3787.5 | 9606.06 | |
| Winter | 5 year | 1844.8 | 1843.9 | 3446.21 | 0 | 0 | 2000 | 1844.8 | 1843.9 | 3446.21 |
| 10 year | 4386.52 | 4098.66 | 11640.05 | 0 | 0 | 0 | 4386.52 | 4098.66 | 11640.05 | |
Among the global optimal expansion solutions considering N-1 security for the Turkish case in the 10-year planning period, the fall scenario solved with the BFBI algorithm has the minimum total cost with 3752.65 M$; in contrast to this, the summer scenario solved with the BFBI algorithm has the maximum total cost with 5112.64 M$.
The solutions relevant to different seasons might include the same expansion investments. Therefore, it is necessary to list the same transmission lines available in different scenarios. Then, only different investments obtained for particular scenarios should be added to the base list. In this way, the total investment cost covering all possible seasons can be determined. Hence, at the end of the 5- and 10-year planning periods, to ensure the reliable and secure operation of the system for all scenarios, the total cost and length of new transmission lines required are 3132.31 km-M$ and 6436.9 km-M$, respectively. These results are offered by the BFBI algorithm as the best expansion plans for the modified Turkish grid. Figure 10 depicts the new grid with the optimum expansion plan for 5- and 10-year planning periods.
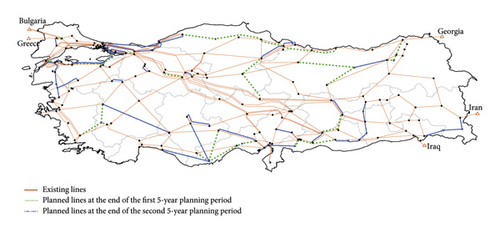
This study is significant in the sense of revealing the necessity of determining the optimum expansion plans for grid investments by considering various generation and consumption scenarios depending on the changes in electricity generation and consumption in line with national energy policies. In this context, it is evaluated that the results obtained for the Turkish grid can meet the adequate capacity requirements of the grid by covering necessary grid investments to meet the expected changes in generation and consumption for future planning periods.
5. Conclusion
Additional transmission capacity is needed to achieve the targets set for realizing the clean energy transition. In order to provide this capacity, large-scale grid investments for the expansion of transmission grids are required. In this study, multiyear long-term transmission expansion planning is carried out in order to obtain optimal solutions that balance these two critical situations by preventing over- or underinvestment in determining cost-effective transmission line investments for planning periods. In addition, the model presented in this study is intended to assist planners in transmission system planning studies for real large transmission grids.
In this study, the BFBI algorithm is developed by modifying the original FBI algorithm to solve the binary TEP problem. The effectiveness and performance of the developed BFBI are assessed by implementing two different test systems: the standard Garver 6-bus test system and the modified 400 kV Turkish grid. Moreover, the TEP problem is solved for comparison purposes using GA and PSO algorithms widely used in the literature. The main advantages of the developed BFBI algorithm are its simplicity due to the few numbers of control parameters, high accuracy, and the ability to converge to the fitness function, while its weaknesses include proposing not better results than the GA algorithm for some scenarios in the real grid and the need for more function evaluation in the algorithm structure than similar metaheuristic algorithms. Therefore, the BFBI algorithm needs more computational time.
The obtained numerical results indicate that the developed BFBI algorithm presents competitive results compared with other algorithms for the TEP problem. In particular, it is concluded that the developed BFBI algorithm can be adequately applied for optimal transmission system planning for different objective functions in bulk and complex real grids.
In future studies, it is aimed to incorporate the variable and intermittent nature of RESs and the stochastic behavior of the transmission grids into the TEP problem. In addition, new flexibility tools such as ESS, EV, HP, and electrolyzer in power system transformation will be included in the TEP problem, and their impact on the optimal transmission system planning with a minimum cost will be realized while maintaining the secure and stable operation of the transmission system.
Symbols
-
- ai:
-
- Loss of load penalty cost at bus i
-
- B:
-
- Susceptance vector
-
- bij:
-
- Susceptance of the line in corridor ij
-
- CINV:
-
- Total investment cost
-
- CLOL:
-
- Total loss of load cost
-
- CO:
-
- Total operational cost
-
- cij:
-
- Investment cost of a line added in corridor ij
-
- d:
-
- Load vector at each bus
-
- f:
-
- Active power flow vector at each bus
-
- fij:
-
- Active power flow in corridor ij
-
- :
-
- Maximum active power flow in corridor ij
-
- :
-
- Active power flow in corridor ij in the c th N-1 contingency case
-
- g:
-
- Generation vector at each bus
-
- gmin:
-
- Minimum active power generation at each bus
-
- gmax:
-
- Maximum active power generation at each bus
-
- Nc:
-
- Number of overloading lines in the cth N-1 contingency
-
- Nr:
-
- Number of isolated lines
-
- nij:
-
- Number of lines added in corridor ij
-
- :
-
- Number of initial lines in corridor ij
-
- :
-
- Maximum number of lines to be added in corridor ij
-
- r:
-
- Loss of load vector (for dummy generation) at each vector
-
- ri:
-
- Dummy generation at bus i
-
- ω1:
-
- Coefficient of penalty for overloaded lines in the N case
-
- ω2:
-
- Coefficient of penalty for overloaded lines in the N-1 contingency case
-
- ω3:
-
- Coefficient of penalty for isolated grids
-
- θi:
-
- Voltage angle of bus I
-
- Ωbus:
-
- Set of buses
-
- :
-
- Set of candidate lines
-
- :
-
- Set of contingency lines
-
- πb:
-
- Thermal overloading penalty cost in the N case
-
- πc:
-
- Thermal overloading penalty cost in the cth N-1 contingency case
-
- πr:
-
- Penalty cost of the formation of the isolated grids
Abbreviations
-
- CESA:
-
- The Continental Europe Synchronous Area
-
- FBI:
-
- Forensic-based investigation
-
- BFBI:
-
- Binary forensic-based investigation
-
- ESS:
-
- Energy storage system
-
- EV:
-
- Electric vehicle
-
- GA:
-
- Genetic algorithm
-
- HP:
-
- Heat pump
-
- LOLC:
-
- Loss of load Cost
-
- OF:
-
- Objective function
-
- PSO:
-
- Particle swarm optimization
-
- PSS/E:
-
- Power system simulation for engineers
-
- RES:
-
- Renewable energy Source
-
- TEP:
-
- Transmission expansion planning
-
- TF:
-
- Transfer function
-
- TSO:
-
- Transmission system operator.
Conflicts of Interest
The authors declare that they have no conflicts of interest.
Acknowledgments
The study is funded by the authors.
Open Research
Data Availability
The data that support the findings of this study are available on request from the authors with the permission of the Turkish Electricity Transmission Corporation. The data are not publicly available due to privacy restrictions.


