The Frequency Regulation Strategy for Grid-Forming Wind Turbine Generator and Energy Storage System Hybrid System in Grid-Connected and Stand-Alone Modes
Abstract
This paper proposes a coordinated frequency regulation strategy for grid-forming (GFM) type-4 wind turbine (WT) and energy storage system (ESS) controlled by DC voltage synchronous control (DVSC), where the ESS consists of a battery array, enabling the power balance of WT and ESS hybrid system in both grid-connected (GC) and stand-alone (SA) modes. The newly developed GFM framework, i.e., DVSC, is adopted in both WT and ESS, which utilizes DC voltage dynamics for synchronization purposes. In this paper, the GC mode and SA mode are transferred by changing the status of the series-connected switch, and it is necessary to meet the grid connection conditions when the system is transferred to the GC mode, namely, voltage, frequency, and phase sequence. For the GC mode, the inertia response from WT can be realized using the reserved energy of the DC capacitor, while the ESS serves to eliminate the steady-state frequency deviation and reduce the DC voltage fluctuation of WT using the designed secondary frequency regulation scheme. For the SA mode, the proposed strategy can keep the power balance without external power sources. The small-signal model of the WT and ESS hybrid system is derived. The stability analysis in both GC and SA modes is fully conducted utilizing the modal analysis method, where the impacts of control parameters on stability are assessed. The performance of the proposed strategy in a weak system is evaluated. Simulation studies are carried out under various power system contingencies to verify the effectiveness of the proposed strategy and validate the correctness of the theoretical analysis.
1. Introduction
The increase of greenhouse gas emissions together with the pressure of fossil fuels has encouraged the penetration of variable speed wind turbine generation (VSWTG) systems to extract the use of renewable wind power. However, the wind power plants (WPPs) are connected to the power grid via electronic devices, which decouples the operation of VSWTG and grid frequency. Therefore, the converter-based power plants hardly contribute to the system frequency regulation and inertial response. Besides, the intermittent wind power caused by unpredictable weather changes leads to the fluctuation of the output of the wind turbine generator (WTG). To cope with the increasingly strict grid codes, how to maintain the frequency stability in a renewable energy employed system deserves consideration.
In most of the existing literature, inertial response functions are added to the connected VSWTG [1–5]. In [1, 2], the authors introduce additional control to the wind farm so as to provide virtual inertia; hence, supplementary frequency regulation service is obtained. Supplementary control loops are utilized with a user-defined doubly fed induction generator (DFIG) electrical control model for frequency regulation capability and oscillation damping in [3]. In [4], an improved deloading method is proposed to improve the regulation capabilities of a type-4 wind turbine (WT) in different rotor speed sections. The authors in [5] aim to sustain the frequency in a specified period of time by extracting a certain amount of active power from the stored kinetic energy. Except for the inertia control, the typical frequency regulation strategies of VSWTG consist of rotor speed control [6], pitch angle control [7], and frequency droop control [8]. In [6], an extra rotor speed closed loop is added, which can effectively reduce the secondary frequency drop. In [7], the authors proposed a synergistic frequency regulation control mechanism (SFRCM) to optimize pitch dynamics with revised-pitch angle control (R-PAC), and in [8], the authors proposed an adaptive dual droop control scheme to detect the disturbed and undisturbed systems while ensuring safe operation by settling the support power limitation and regulating the droop coefficients, whereas the regulation stability of VSWTG is limited due to the limited kinetic energy stored in the rotor. The above methods have difficulties in responding to large disturbance events. Moreover, these strategies may lead to a secondary frequency drop (SFD) when the rotor speed begins to be restored to its predisturbance value [5].
To solve the above problems, an auxiliary energy storage system (ESS) has been widely used to provide frequency support with the rapid development of energy storage equipment. In [9, 10], the authors applied ESS to restrict the frequency excursion caused by an uncertain disturbance in the wind integrated systems. In addition, ESS also helps in suppressing wind power fluctuations and enhancing the system ability of low-voltage ride-through [11, 12]. Furthermore, a coordinated control strategy of WTG and ESS integrated system is proposed for better performance of temporary frequency support, and its capability of overcoming SFD is verified effectively [13]. Nevertheless, the coordinated strategy should follow a complex algorithm, and simpler control strategies are worth further research.
Generally, the grid synchronization methods of converter-based resources can be classified into two categories, and they are grid-following (GFL) control and grid-forming (GFM) control, respectively. For the GFL control, the detected phase of the voltage at the point of common coupling (PCC) with phase-lock loop (PLL) is used with vector current control [14] or the direct power control for the regulation of the active and reactive power exchanged with the grid [15]. While the GFM control generally utilizes the power-frequency (P – ω) droop control to synchronize converters [15]. The above two grids’ synchronization methods are applied to the renewable integrated system, and they are the distribution networks [16], microgrids [17], and ship systems [17]. In [16], the authors provide some guiding principles to prevent slow-interaction converter-driven stability issues in medium-voltage distribution grids by performing small-signal stability analysis and selecting a set of key parameters from state-of-the-art GFL and GFM models. In [16], a decentralized grid-forming control strategy of high-penetration wind power MG is presented, which can effectively provide frequency regulation and robust control performance.
The GFL synchronized system would suffer from instability problem once connected to the weak AC system [18], whereas the abovementioned GFM control will inevitably affect the maximum power point tracking (MPPT) of renewable sources [19]. To improve the energy efficiency, another GFM control, i.e., the DC voltage synchronization control (DVSC), has been proposed recently in [20]. It utilizes the analogy between the rotor dynamics and the DC-link capacitor dynamics of type-4 WT to synchronize the grid-side converter (GSC) with the AC networks, and the MPPT algorithm of the rotor-side converter (RSC) is retained. Whereas, there is a problem that deserves concern, that is, the DVSC applied system suffers from a large fluctuation of DC-link voltage [20, 21], for the stored energy in DC capacitor is usually activated for frequency support, leading the DC-link voltage of the capacitor to begin to fluctuate. Besides, with the extensive penetration of VSWTG on various occasions such as distribution networks, microgrids, and ship systems, it is of great use to propose a universal control strategy to hold the frequency stability in stand-alone (SA) and grid-connected (GC) systems under DVSC.
2. Problem Statement
With the popularity of renewable energy and the diversification of their application scenarios, the proportion of traditional frequency regulation resources in modern power systems gradually decreases, leading to the inertia of the power system decreasing and deteriorating the frequency regulation capability of the system. Thus, the stable operation of the power system will be threatened. To ensure the safety of the power system, currently, the frequency stability of the system is an urgent issue to be addressed.
Based on the discussion in Section 1, the following observations that need to be filled can be concluded. First, most of the existing literature only relies on VSWTG itself to provide frequency support. For one thing, the power regulation margin of WT is limited. For another, enabling WT to participate in frequency regulation will inevitably force WT to deviate from MPPT status, wasting energy that can be utilized. Second, the recently developed DVSC method can maintain the MPPT property of GFM WT and avoid instability problems caused by PLL in weak grids. However, large DC voltage deviations may be required under system disturbances, threatening the stable operation of PMSGs. Therefore, a combination of ESS and VSWTG is more preferred to improve the ability of frequency regulation, where the introduced ESS can not only provide the system with additional power support but also mitigate the DC voltage deviation. Third, with the development of the distribution network, universal control strategies are urgently needed to ensure frequency regulation ability in both SA and GC modes.
To cope with the abovementioned problems, this paper proposed a coordinated frequency regulation strategy for the GFM type-4 WT and ESS hybrid system using the DVSC method, enabling the stable operation in both SA and GC modes. In the following sections, the stability analysis of the controller is conducted in SA and GC modes using eigen analysis, and the frequency recovery capability of the system in both GC and SA modes is investigated, where the disturbance is set by increasing the connected load. The GC mode and SA mode here are transferred by changing the status of the series-connected switch, and the grid connection conditions should be satisfied when the switch is going to be closed, namely, voltage, frequency, and phase sequence.
For a system adopted with the proposed frequency control strategy, when the active power is unbalanced, there is a frequency deviation. In the frequency recovery process, the output of ESS is regulated according to the system frequency deviation, namely, when the system frequency is lower than the nominal value, the ESS output power increases, and vice versa, the ESS output power decreases. Therefore, the introduction of ESS can provide the system with power support and favor the system frequency recovery. Moreover, with the adoption of DVSC, the PMSG can not only operate in the MPPT status but also, without the need for PLL, the potential instability problems in weak grid scenarios are avoided. Besides, the fluctuation of the DC-link voltage of PMSG is mitigated due to the application of ESS, which provides the system with additional power support, mitigating the fluctuation of the output of wind turbines. The proposed control strategy can work both in GC and SA modes, maintaining the stable operation of the system.
- (1)
The proposed strategy utilizes the GFM control framework, i.e., DVSC, in both type-4 WT and ESS, maintaining the MPPT status of WT. Most importantly, the proposed strategy uses ESS to reduce the DC voltage fluctuation of WT induced by DVSC.
- (2)
The proposed strategy is a universal controller for both GC and SA modes. For the GC mode, the virtual inertial support from WT can enhance the frequency nadir, while the steady-state deviation of frequency could be eliminated using the designed frequency regulation scheme of ESS. For SA mode, the proposed strategy can well maintain the power balance without the aid of PLL and external power sources. The stability analysis of the controller is conducted in SA and GC modes using eigen analysis, where the impacts of control parameters of WT and ESS on system stability are fully evaluated.
- (3)
The proposed strategy utilizes the GFM method to realize synchronized function, which eliminates the risk of instability related to introduced PLL in a weak AC system, maintaining the stable operation of the power system connected to a weak grid.
3. Modelling of the Grid-Forming WTG and ESS Hybrid System
3.1. Configuration of the WTG and ESS Hybrid System
Figure 1 shows the diagram of the studied WT and ESS hybrid system, where a switching block is adopted to determine whether the system is operated at GC mode or SA mode. If the switching block is closed, the system operates in GC mode, while the system operates in SA mode if the switching block is turned off. Lm1 and Lm2 represent the electrical distance from WTG to PCC and from ESS to PCC, respectively. The line inductance is represented by Lm.
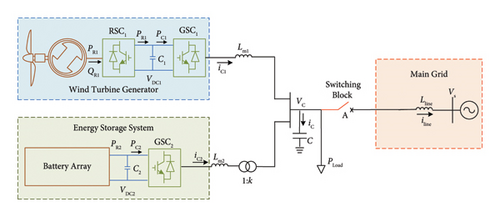
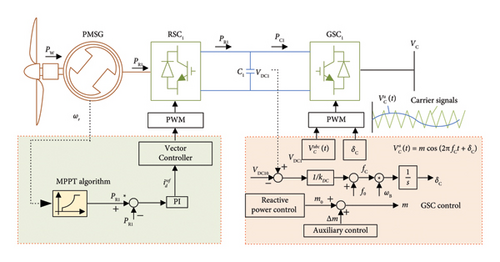
The newly developed GFM control, i.e., DVSC is adopted in WT, as shown in Figure 2. It utilizes internal DC voltage signals for the grid-synchronization purpose of PLL-free WT, while partial reserved DC capacitor energy can be provisionally utilized for inertial support. The DVSC method enables WT to operate well both in the GC mode and SA mode, while the MPPT property of WT can be retained. However, reliance only on DC capacitor energy for system support may cause large DC voltage deviations. Thus, this paper utilizes ESS to enhance the frequency regulation ability of DVSC-controlled WTG and to reduce the DC voltage deviations of WT converter.
3.2. Modelling of the WTG Controlled by DVSC
Figure 2 shows the control diagram of WT controlled by DVSC, where the GSC serves to achieve GFM functions and inertia response using DC voltage dynamics, while RSC aims to realize the MPPT algorithm.
The parameters of WTG in this paper are presented in Table 1.
| Symbol | Item | Value |
|---|---|---|
| VDC0 | The DC-link voltage | 6 kV |
| C1 | The capacitance of DC link | 4000 μF |
| PR1 | Input power from RSCi | 1.4 MW |
| PWTG | Rating of the WTG | 1.5 MW |
| Vwind | The speed of wind | 11 m/s |
3.3. Modelling of the Battery-Based ESS
In this paper, the characteristics of the charge and the discharge cycles of the adopted battery are deemed the same, and the adopted battery model is shown in Figure 3 [22], which consists of a controlled voltage source and a constant internal resistance.
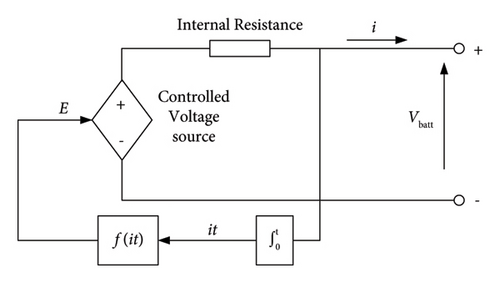
The lithium-ion batteries are selected for analysis in this paper, and the corresponding parameters of ESS are presented in Table 2.
| Parameter | Value |
|---|---|
| E0 (V) | 3.7348 |
| K (V) | 0.00876 |
| A (V) | 0.468 |
| B (Ah)−1 | 3.5294 |
| Vnom | 3.6 V |
| Qnom | 1 Ah |

The principle of this control strategy can be explained as follows. The fluctuation of the output frequency of the GSC2 is utilized to regulate the voltage reference. If the detected output frequency is lower than the nominal value, the voltage reference is decreased to extract more energy from ESS, and the voltage reference is enlarged to suppress the extracted energy from ESS when the output frequency is higher than the normal value. In this way, the system frequency is maintained at the nominal value. It can also be derived that the applied ESS is of good use to suppress the DC-link voltage fluctuation. As the output of ESS is designed to compensate for the power shortage or absorb the power surplus of the studied system, the variation of the output active power of WTG is mitigated. From (2), the fluctuation of DC-link voltage could be reduced.
3.4. Modelling of the Transmission Line Connecting Main Grid
For simplification, the main grid is equivalent to a synchronous generator (SG). The SG classical model is adopted here for analysis, and the armature resistance is ignored. Besides, the connected load is omitted in the GC mode. Therefore, the equivalent circuit of the transmission line connected to the SG is described in Figure 5.


4. Small Signal Analysis
4.1. System Modelling in GC Mode
The abc three-phase voltage and current signals can be projected to the dq rotating system by Park Transformation.
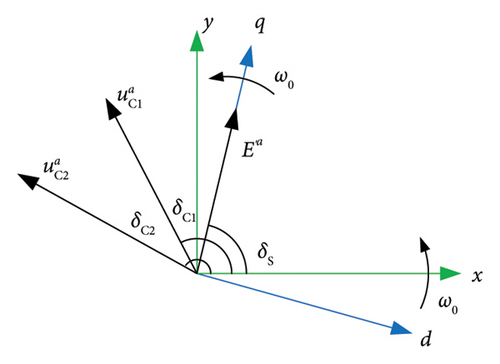
Figure 7 shows the Park Transformation adopted in the GC mode, where the SG voltage is projected onto the q-axis, and the angle between q-axis and x-axis is δS, equal to the phase angle of . The angle between the WTG voltage and the x-axis is δC1, and the angle between the ESS voltage and the x-axis is δC2.
4.2. System Modelling in SA Mode
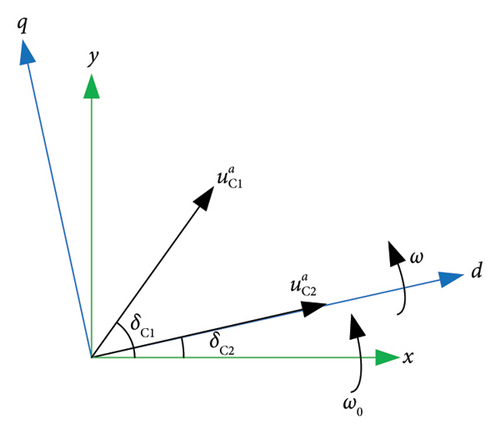
Accordingly, the output active power of GSC1 and GSC2 can be represented by (37) and (38).
Moreover, the output active of ESS is deemed as 0 and the equivalent point can be solved out, and the following small signal analysis could be conducted.
4.3. Stability Analysis Using Eigenvalue Computation
In order to identify the variables participating most in the unstable state, the key variables are derived by conducting eigenvalue analysis and using the participation factor analysis. In this scenario, kDC1 = kDC2 = 40, Tm = 5, the detail of other parameters is shown in Table 3.
| Symbol | Item | Value |
|---|---|---|
| VDC20 | Nominal DC-link voltage of ESS | 3.7974 kV |
| C2 | DC-link capacitance of ESS | 4000 μF |
| Lm1 | The reactance of filter inductor of GSC1 | 0.005 H |
| Lm2 | The reactance of filter inductor of GSC2 | 0.005 H |
| C | The capacitance of the shunt capacitor | 220 μF |
| Lline | Reactance of transmission line | 0.0005 H |
| The subtransient reactance of SG | 0.257 Ω | |
| The subtransient electromotive force of SG | 2.45 kV | |
| k | The transformer ratio of the step-up transformer | 1.5 |
By conducting eigenvalue analysis, the eigenvalue is shown in Table 4, where an unstable mode exists, and its damping is negative, leading to the system loses its stability.
| Mode | Eigenvalue | Damping |
|---|---|---|
| λ1,2 | −0.26 ± j2496.9 | 1.04e − 4 |
| λ3 | −2757.3 | 1 |
| λ4,5 | −0.36 ± j1869.4 | 1.93e − 4 |
| λ6,7 | 1 ± j310.5 | −0.0032 |
| λ8,9 | −8.4 ± j315 | 0.0267 |
| λ10,11 | −23.6 ± j218.1 | 0.108 |
| λ12 | −52.9 | 1 |
| λ13,14 | −0.005 ± j3.24 | 0.0015 |
| λ15 | −0.2 | 1 |
- Bold values means the unstable state of the system using the eigenvalue analysis.
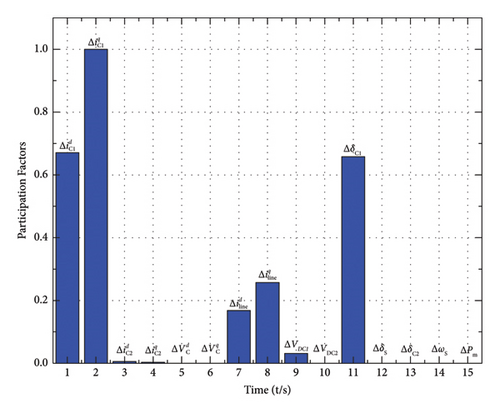
Figure 9 shows the participation factors of the unstable mode in this scenario. It can be observed that the variables participating most in this unstable mode are related to the PMSG (, , , , ΔVDC1, and ΔδC1); therefore, it is necessary to reveal the influence of PMSG on the system stability, while the output of PMSG is mainly influenced by the control parameters kDC1, thus, the influence of kDC1 on system stability is investigated in this paper.
The control parameter kDC2 is also considered here to investigate its influence on the system stability, for this control parameter dominate the output of ESS, which has a significant impact on the performance of the system. Another parameter considered here is the time constant of SG, namely, Tm. The reason for considering the influence of Tmon the system stability is that the synchronous generator can be involved in the frequency regulation of the system. Besides, the output of SG is dependent on the time constant Tm, Figure 7 shows the governor system of the connected SG, and a smaller time constants Tm allow the prime mover to deliver the required power to the system in a short time period. Therefore, in the manuscript, the time constant of SG is considered so as to derive the impact of variation of Tm on the frequency stability of the system.
Therefore, in this section, the impacts of kDC1, kDC2, and the time constant of SG governor Tm on the stability of the system shown in Figure 1 are studied. The following five parts are carried out, and among them, the first three parts are analysed when the system is operated in the GC mode, where switch A closed. The following two parts are analysed in the SA mode, where switch A remains open.
4.3.1. Impacts of kDC1 on System Stability in GC Mode
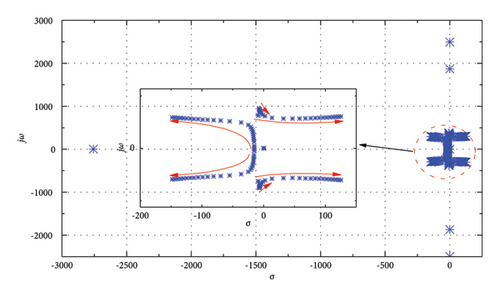
The influence of kDC1 on system stability is studied here. In this process, kDC2 = 0.333, Tm = 5 s, the value of kDC1 is decreased from 1 to 0.01. By conducting eigenvalue analysis, the root locus is shown in Figure 10. It can be seen from Figure 10 that there is a mixed movement of the poles—some toward further left and some toward right. It is important to find that one mode has moved to the right half of the s-plane, making the system unstable. In this way, it can be concluded that the decrease in control parameters kDC1 can reduce system stability.
4.3.2. Impacts of kDC2 on System Stability in GC Mode
In this part, kDC1 = 0.333, Tm = 5 s, and the value of kDC2 is decreased from 1 to 0.01. By conducting eigenvalue analysis, the root locus is shown in Figure 11. Different from part 1, there is a pair of poles moving toward the right. However, it is observed that all the modes remain in the left half of the s-plane, indicating that the system still remains stable in this process. Therefore, it can be concluded that the decrease in control parameters kDC2 would not destroy the system stability, and the system keeps stable.
4.3.3. Impacts of Tm on System Stability in GC Mode
To reveal the impact of Tm on the stability of the system, the time constant of the governor is changed from 1 s to 100 s, while the value of kDC1 and kDC2 remains 0.333. The root locus of the eigenvalues is shown in Figure 12. It can be observed that there is one mode moving towards the right half of the s-plane; however, this mode would not reach the right half of the s-plane. It reveals that the system still remains stable. Hence, the variation of Tm influences the poles of the system slightly, and the system remains stable whatever the value of Tm is.
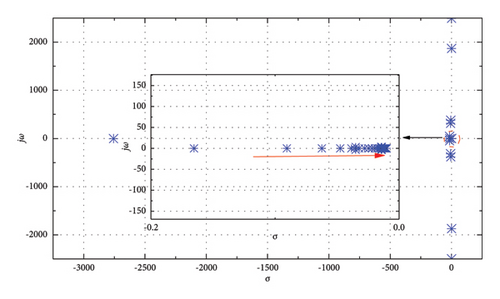
4.3.4. Impacts of kDC1 on System Stability in SA Mode
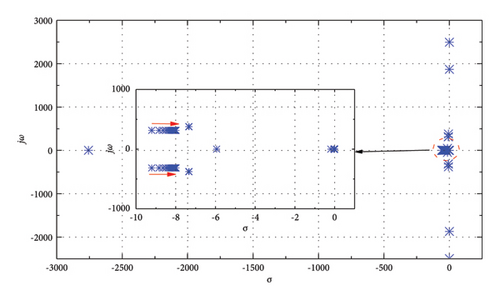
The impact of kDC1 on the stability of the system in the SA mode is carried out with the kDC1 changes from 1 to 0.01. In this process, kDC2 remains 0.333. The active power absorbed by the connected constant power load at PCC is 1.4 MW, while the absorbed reactive power is 0 MW. Based on the eigenvalue analysis, the root locus is shown in Figure 13. Similar to that of the GC mode, the system turns unstable with the decrease of kDC1, for there is a pair of poles reaching the right half of the s-plane. Therefore, the decrease in control parameters kDC1 can threat the system stability.
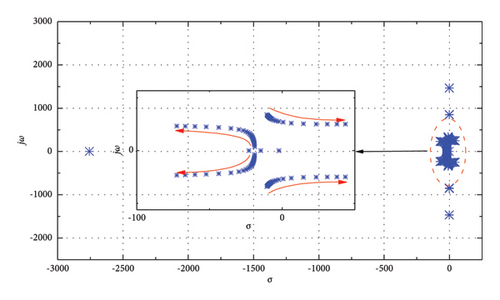
4.3.5. Impacts of kDC2 on System Stability in SA Mode
To study the influence of kDC2 on the stability of the system in the SA mode, the value of kDC2 is decreased from 1 to 0.01, while kDC1 remains 0.333. The root locus in this process is shown in Figure 14. It can be revealed that the root locus remained in the stable area regardless of what value kDC2 is. Therefore, the conclusions derived in the SA mode are consistent with those of the GC mode with regard to the variation of parameters kDC1 and kDC2.
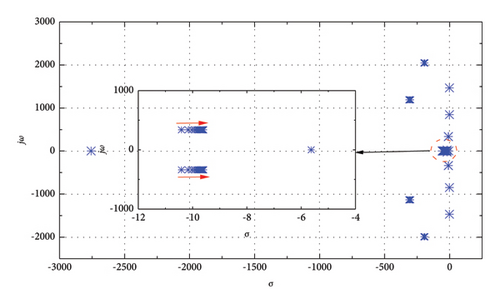
Besides, since the changes of kDC2 and Tm do not destabilise the system, the root locus obtained above reveals that the decrease in the ESS control parameter and the increase in the Tm have very little involvement in the unstable mode.
5. Case Study
To validate the effectiveness of the proposed frequency regulation scheme in GC and SA modes, the time-domain simulation of the studied system in Figure 1 is conducted in PSCAD/EMTDC. The first case aims to reveal the impact of the inappropriate setting of kDC1 on the system stability. The second and the third cases are built to study the frequency regulation capability of the proposed control strategy in both the GC and SA modes. The fourth part is designed to determine the energy loss and power factor of the studied system. In each case, the perturbation is conducted by adding a connected local load, and the detailed parameters for the first 4 cases are shown in Tables 1 and 3. The fifth case is constructed to compare the dynamic response of the typical PLL-based GFL-controlled system and the proposed strategy-controlled system.
5.1. Instability Caused by Inappropriate Setting of kDC1 in GC Mode
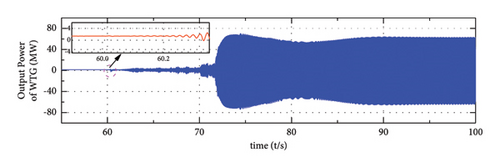
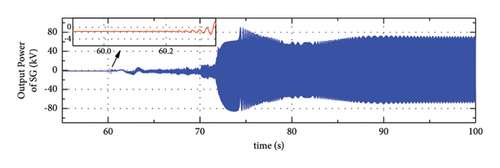
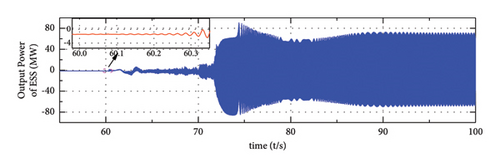
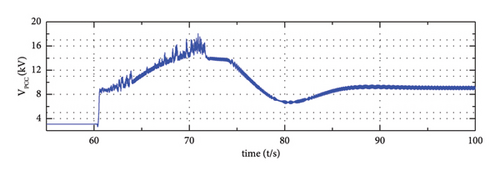
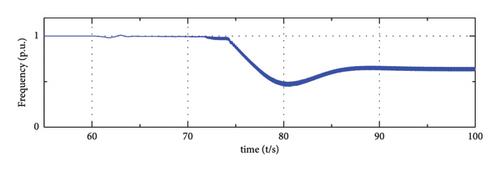
From the analysis in Section 3, the inappropriate setting of control parameter kDC1 could destroy the system stability. In this section, the decrease in the control parameter kDC1 is applied to verify the modal analysis results. In this process, kDC1 is decreased from 0.333 to 0.02 at t = 60 s. Figure 15 shows the system dynamic in the GC mode, and the case in the SA mode is omitted for simplification. It can be clearly observed that the system lost its stability after the decrease of kDC1. Figures 15(a)–15(c) show the output of WTG, SG, and ESS, where the output power of the three sources starts to oscillate at t = 60 s and then oscillates continuously. Besides, the system frequency and VPCC start to diverge in the meanwhile, which is reflected in Figures 15(d) and 15(e). Therefore, the decrease of control parameters kDC1 brings out the instability of the system, and this conclusion is also suitable for the SA mode operated system. In this way, the small signal models and modal analysis results obtained in Section 3 are verified correctly and can be used to direct the designing of the control parameters.
5.2. Frequency Regulation in GC Mode
In this part, the effectiveness of the proposed strategy is comprehensively investigated based on the simulation results of the studied system in the GC mode.
Figure 16 shows the frequency response of the system in the GC mode, where the solid red line represents the results when ESS participates in frequency regulation while the solid blue line denotes the results when ESS does not participate in frequency regulation. At first, there is no connected load and the system frequency is 50 Hz. The active power of the load is increased by connecting a fixed load marked as PL = 0.15 MW at t = 60.0 s to mimic the system disturbances. It can be observed from Figure 16.

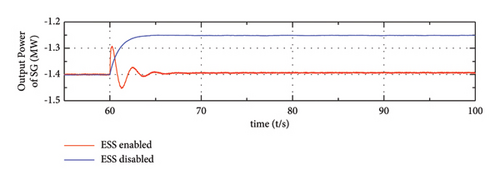
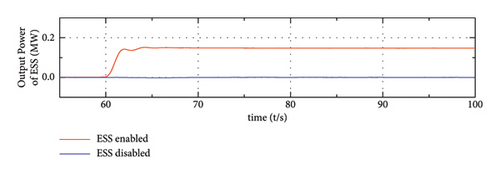
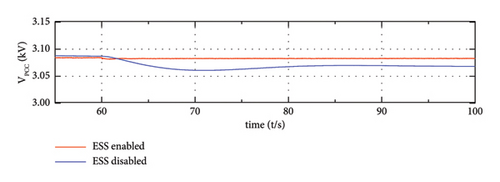
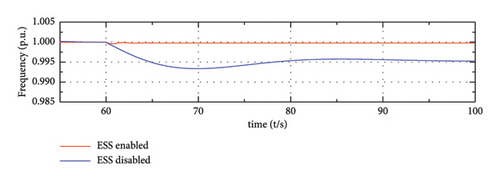
(a), (b), and (c) show that the output power of WTG barely changes in this process, while the output of SG or ESS experienced a large variation at t = 60 s due to their frequency regulation ability. Moreover, due to the fast regulation characteristics of energy storage, the participation of ESS enables the system to respond faster than the system where only SG is activated for frequency regulation. The corresponding frequency nadir is improved and the steady-state frequency deviation is eliminated when the proposed strategy is applied, which is shown in Figure 16(e).
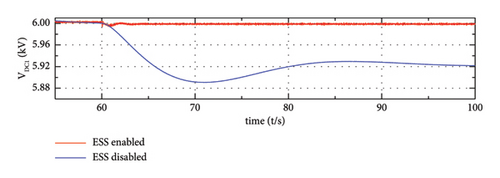
From (1), there exists a proportional relationship between the DC-link voltage of PMSG and the output frequency of its GSC (grid-side converter); therefore, the fluctuation of the DC voltage is consistent with the frequency deviation of the output frequency. Besides, in the steady state condition, the output frequency of GSC of PMSG is equivalent to the system frequency, at this time, the DC voltage deviation is proportional to the system frequency. From Figure 16(f), when the ESS is enabled, there is nearly no DC voltage deviation, while when ESS is not enabled, there is an obvious voltage deviation, which is consistent with the variation of the system frequency (as shown in Figure 16(e)).
On the other side, the reduction of the fluctuation of DC-link voltage of the turbine can also be explained in a dynamic process, when the load changes, the introduction of ESS provides the system with power support, as a result of which the output power fluctuation of the wind turbine is reduced, and further, the voltage fluctuation of the DC capacitor of the turbine is reduced.
Moreover, as shown in Figure 16(d), the voltage at PCC is maintained after disturbance when the proposed strategy is applied in the meantime. As for the ESS disabled system, the system frequency and DC voltage experience large variations.
Simulation results in this part proved the superiority of the proposed power-sharing strategy, namely, it can not only enhance the system dynamic behaviours but also the steady-state performance. Meanwhile, the DC voltage fluctuation is suppressed.
5.3. Frequency Regulation in SA Mode
Here, the studied system is operated in the SA mode, and the power balance capability of the proposed strategy is investigated. At first, there is a connected fixed load marked as R = 9.5 Ω, and the system frequency remains 50 Hz. As the same in the second case, the absorbed active power of the load is increased by 0.15 MW at t = 60 s to mimic the system disturbances.
Figure 17 shows the simulation results of the system in the SA mode under the load increase situations. After the system load increases suddenly, the output of ESS starts to increase when the ESS is activated for frequency regulation, which is represented by the solid red line in Figure 17(b). In this way, the participation of ESS could not only improve the frequency nadir but also eliminate the steady state deviation, which is reflected in Figure 17(d). On the contrary, the system that ESS is disabled would experience large frequency fluctuation. Similarly, from Figure 17(e), the fluctuation of the DC-link voltage of type-4 wind farm is mitigated with the participation of ESS. This phenomenon can be explained in the same way, the DC-link voltage of PMSG is proportional to the output frequency of GSC; in the steady operation status, the deviation of the DC voltage is consistent with the system frequency deviation. This means when the ESS is enabled, there is nearly no DC voltage deviation, while when ESS is not enabled, there is an obvious voltage deviation. Similarly, the variation of voltage here is consistent with the variation of frequency (as shown in Figure 17(d)).
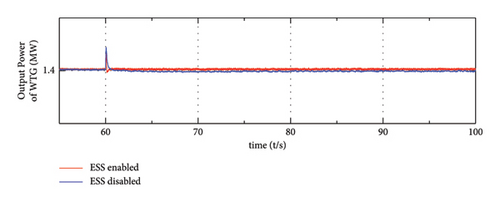
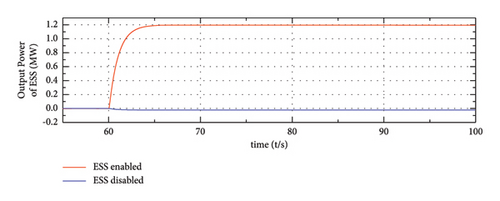
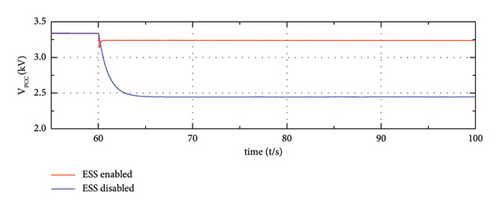
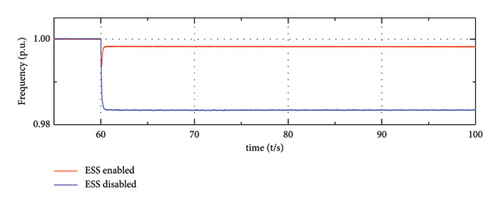
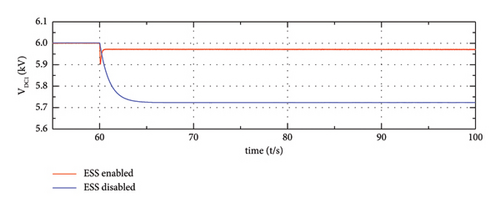
In the SA mode, the reduction of the variation of DC-link voltage can also be explained in a dynamic process, when the load fluctuates, the introduction of ESS provides the system with additional power support; furthermore, the fluctuation of the output of the wind turbine is reduced, and correspondently, the DC-link voltage is reduced.
As for the voltage stability at PCC, the introduction of the proposed strategy could sustain the magnitude of VPCC, while the magnitude of VPCC would drop dramatically without the support of ESS.
The above conclusions are inspiring for the proposed frequency regulation strategy which is adaptable not only in the GC mode but also in the SA mode, and the system stability is reserved without the support from other additional sources. Therefore, the proposed method can be used to guide the design of the SA systems.
5.4. Efficiency and Power Factor Analysis
In this part, the efficiency and power factor of the studied system is analysed to evaluate the performance of the proposed control strategy. Since the output of ESS is utilized for frequency regulation purposes when the load fluctuates, the loss of ESS is brought up by its internal resistance and converter resistance, which is dependent on its output. Therefore, the loss of ESS can be ignored in normal status and the performance of PMSG is considered.
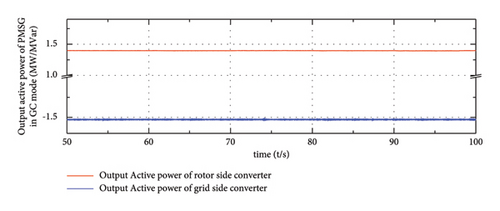
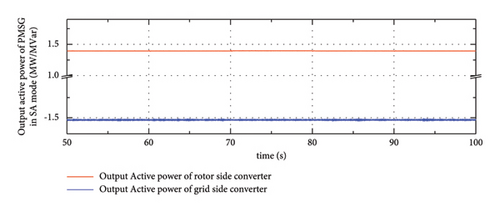
In this part, the load is increased by 0.15 MW at t = 60 s and t = 70 s and decreased by 0.15 MW at t = 80 s and t = 90 s to represent situations when the load fluctuates. In Figure 18, the solid red line represents the output active power of the grid side converter in PMSG and the solid blue line represents the output active power of the rotor side converter. It can be inferred that there exists power loss in PMSG between the rotor side converter and grid side converter. In this paper, the energy loss of PMSG in both GC mode and SA mode is 0.1 MW; therefore, this value is relatively high and most of the input power can be utilized.
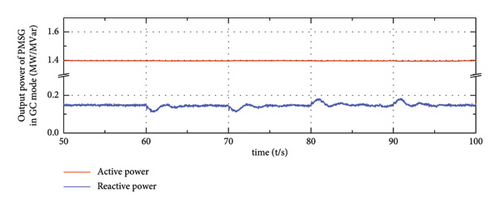
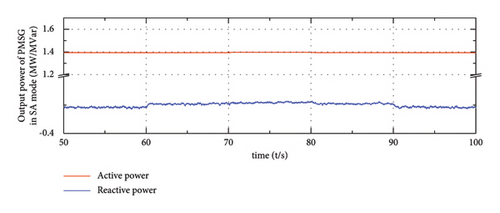
To figure out the power factor of PMSG, the output active and reactive power of the grid side converter is illustrated in Figure 19, where the solid red line represents the output active power of PMSG and the solid blue line represents the output reactive power. It can be observed that the reactive power output of PMSG in different scenarios only accounts for a small part of its output. In the GC mode, the power factor of PMSG is about 99.5%, and the power factor is slightly influenced by the connected load. This power factor value is relatively high and the connected converter can be effectively utilized for outputting active power. Similarly, in the SA mode, the corresponding power factor is approximately 97.8%; also, this value is high enough for transmitting active power.
5.5. The Effectiveness of the Proposed Control Strategy in Weak AC System
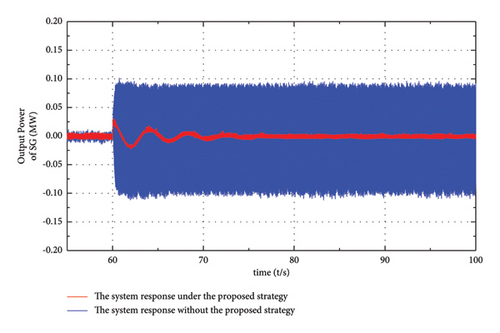
It is recently found that the GFL synchronized system would experience a risk of subsynchronous oscillation (SSO) once connected to the weak AC system. The proposed strategy utilizes the recently proposed GFM for grid-forming purposes, namely, the DVSC. In this way, the SSO problem can be avoided. For simplification, the integration of the type-4 wind farm is omitted, and the ESS embedded system is studied. The detailed parameters are shown in Table 5. The dynamics of the system with the proposed strategy and the GFL control strategy are compared, and the disturbance is realized by changing the inductance of the transmission line from 0.001 H to 0.01 H at t = 60 s.
| Symbol | Item | Value |
|---|---|---|
| C2 | DC-link capacitance of ESS | 4000 μF |
| Lm2 | The reactance of filter inductor of GSC2 | 0.005 H |
| k | The transformer ratio of step-up transformer | 1.5 |
| C | The capacitance of the shunt capacitor | 20 μF |
| Lline | Reactance of transmission line | 0.001 H |
| The subtransient reactance of SG | 0.257 Ω | |
| The subtransient electromotive force of SG | 2.45 kV |
Figure 20 shows the outputs of SG in this process. The solid blue line represents the response of the GFL strategy applied system, and the solid red line represents the response of the proposed strategy applied system. When the GFL control strategy is applied, it can be clearly observed in Figure 20 that the output of SG begins to diverge when the electrical distance is enlarged, and then the output power exhibits continuously unstable oscillation, whereas the output of SG in the proposed strategy applied system tends to be stable after a short period. The oscillation of the GFL control strategy applied system is caused by the decrease of the short circuit ratio (SCR), namely, the weak system. The findings in this part support the capability of the proposed power-sharing control strategy in frequency regulation and system stability in a weak AC system.
5.6. The Privilege of the Proposed Control Strategy
With the aforementioned analysis and combining the latest research studies, the overall contributions and new observations are summarized in this part.
First of all, in most literature, the MPPT status of WTGs is deteriorated for frequency regulation purposes, sacrificing the available wind energy [19, 22–24], and damaging the economy of wind turbines. This paper utilizes the DVSC control method to reduce energy loss by maintaining the MPPT status of PMSG in the frequency regulation process. Moreover, the previous studies on the frequency regulation of PMSGs embedded systems lead to DC-link voltage fluctuation, and the variation of DC-link voltage exceeds 0.1 p.u. In [20, 25, 26], the DC-link voltage deviation limit is determined by the insulation requirement and the PWM pattern of the VSC station, and it is important to control the DC-link voltage within the acceptable range. The added ESS system stabilizes the DC-link voltage of PMSG, relieving the fluctuation of DC-link voltage greatly. In Sections 4.2 and 4.3, the case studies shown in Figure 15(f) and Figure 16(e) reveal the variation of DC-link voltage of PMSG in the GC mode and SA mode, it can be observed that the fluctuation of DC-link voltage is less than 1.67%, improving the quality of DC-link voltage. Secondly, the existing studies mainly focus on frequency regulation methods in GC systems or a single isolated grid [1, 3–5, 27], a coordinated frequency regulation strategy for both GC and SA modes regulation is needed. The proposed strategy is applicable not only to the GC mode but also to the SA mode, which can also be seen in Figures 15(e) and 16(d). It can be seen that the frequency offset of the system does not exceed 0.01 p.u., providing strong frequency support for the studied system. Thirdly, the phenomenon of SSO has been revealed in GFL-controlled PMSGs and DFIGs embedded in weak grids [18, 28], influencing the safe and stable operation of power systems. The GFM adopted in this paper has a significant effect on SSO suppression, which is reflected in Figure 9, stabilizing the studied system.
6. Conclusion
- (1)
The proposed strategy is robust and can provide strong frequency support for the AC grid or the stand-alone load using the DC capacitor energy of WT and the reserved energy in battery. More importantly, the participation of ESS significantly improves the virtual inertial support and the frequency regulation ability of WT, while the DC voltage deviations of WT converter can be mitigated.
- (2)
The modal analysis is fully conducted in both GC and SA modes to evaluate the impact of the correlated control parameters on system stability. It is revealed that, if the DC voltage droop coefficient of DVSC-controlled WT is lower than the critical value, the system may be unstable, providing theoretical guidance for the controller designing and parameter optimization.
- (3)
The simulation result of the comparison between the GFL and the proposed strategy-controlled system reveals that possible instability issues induced by PLL in a weak AC system are eliminated with the newly proposed method. Hence, the frequency regulation provides strong support when connected to a weak system.
Abbreviations
-
- WTG:
-
- Wind turbine generator
-
- ESS:
-
- Energy storage system
-
- PCC:
-
- Point of common coupling
-
- SG:
-
- Synchronous generator
-
- RSCi:
-
- Rotor side converter
-
- GSCi:
-
- Grid side converter
-
- PMSG:
-
- Permanent magnet synchronous generator
Subscripts “0” steady-state value of variables
-
- Hi:
-
- Inertia time constant of the PMSG
-
- fCi:
-
- Output frequency of GSCi
-
- PRi:
-
- Generated active power of WTG/ESS
-
- QRi:
-
- Generated reactive power of WTG/ESS
-
- PCi:
-
- Active power outputs of WTG/ESS
-
- Ci:
-
- DC link capacitor of WTG/ESS
-
- VDCi:
-
- DC link voltage of WTG/ESS
-
- iCi:
-
- Current outputs of GSCi
-
- uCi:
-
- Voltage outputs of GSCi
-
- Lmi:
-
- Inductor from WTG/ESS to PCC
-
- VC:
-
- Voltage of PCC
-
- k:
-
- Transformer ratio
-
- C:
-
- Shunt capacitor of transmission line
-
- iC:
-
- Current of shunt capacitor
-
- PLoad:
-
- Connected active load of transmission line
-
- QLoad:
-
- Connected reactive load of transmission line
-
- Lline:
-
- Inductance of transmission line
-
- iline:
-
- Current of transmission line
-
- VS:
-
- Terminal voltage of SG
-
- ωr:
-
- Rotor speed of WTGi
-
- ωB:
-
- Angular base of WTGi
-
- δCi:
-
- Angle reference of WTGi
-
- kDCi:
-
- Control parameter of WTGi
-
- mi:
-
- Modulation of GSCi
-
- E:
-
- Open-circuit voltage of battery
-
- K:
-
- The polarization voltage
-
- Qnom:
-
- The battery capacity
-
- A:
-
- The exponential zone amplitude
-
- B:
-
- The exponential zone time constant inverse
-
- R:
-
- Internal resistance of battery unit
-
- Vnom:
-
- The nominal voltage of battery unit
-
- Qnom:
-
- The rated capacity of battery unit
-
- SOC:
-
- State of charge of battery unit
-
- η:
-
- The charge and the discharge efficiency of battery unit
-
- EArray:
-
- The open-circuit voltage of the battery array
-
- RArray:
-
- The equivalent resistance of the battery array
-
- SOCArray:
-
- SOC of the battery array
-
- Vref:
-
- The voltage reference of the internal DC voltage of ESS
-
- kP:
-
- The proportional coefficient of ESS controller
-
- kI:
-
- The integral coefficient of ESS controller
-
- xi:
-
- The introduced state variables
-
- :
-
- The transient reactance of the equivalent SG
-
- :
-
- The column vector of the transient electromotive force of SG
-
- Δδs:
-
- The rotor angle of SG
-
- ωs:
-
- The angular frequency of SG in per unit
-
- TJ:
-
- The rotational inertia of SG
-
- Pm:
-
- The input mechanical power of SG
-
- Pe:
-
- The output electromagnet power of SG
-
- Tm:
-
- The time constants of the governor system
-
- G:
-
- The gain of the governor system
-
- kG:
-
- The droop coefficient of the governor
-
- ∆:
-
- Incremental operator.
Conflicts of Interest
The authors declare that they have no conflicts of interest.
Acknowledgments
This work was supported by the National Key Research and Development Program of China (2022YFB2402705) and Science and Technology Program of State Grid (52272222001J).
Open Research
Data Availability
The data used to support the findings of this study are available from the corresponding author upon reasonable request.


