Buckling Knockdown Factors for Hemispherical Foam Core Sandwich Shells With Single Dimple
Abstract
In this study, nonlinear postbuckling analyses are performed using ABAQUS to derive the buckling knockdown factors (KDFs) for hemispherical foam core sandwich shells under external pressure. Two hemispherical foam core sandwich shells (dimple and flat models) with different inner sheet thicknesses are considered. The crushable foam modeling technique is used to represent the nonlinear compressive behavior of the foam material. The geometric initial imperfection modeling technique, the single dimple imperfection approach, is established to represent the geometric initial imperfection of the hemispherical foam core sandwich shells. The postbuckling analyses using the Riks method are carried out to predict the buckling behaviors of shells with geometric initial imperfections. The KDFs of the dimple and flat models are derived to be 0.20 and 0.22, respectively, which are up to 11.11% and 22.22% higher, respectively, than the previous NASA buckling design criteria. Therefore, the present KDFs provide a lightweight design for hemispherical foam core sandwich shells.
1. Introduction
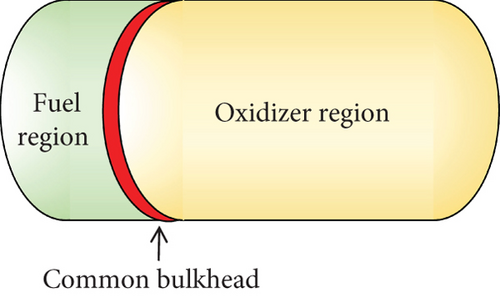
A lightweight design is required to develop space launch vehicles, and reducing the structural weight of the propellant tank is particularly important as it is the heaviest component in a launch vehicle. Several attempts have been made to reduce the structural weight of propellant tanks. One of these attempts is the use of a common bulkhead tank, as shown in Figure 1(a). A conventional propellant tank consists of an oxidizer tank, an interstage, and a fuel tank (Figure 1(b)). In contrast, a common bulkhead propellant tank uses a single tank with a common bulkhead designed as a hemispherical or elliptical shell. Due to this structural simplification, the common bulkhead propellant tank is lighter and shorter than conventional propellant tanks. However, the oxidizer and fuel regions of the common bulkhead tank are in close proximity, making the common bulkhead tank susceptible to thermal insulation and buckling due to the thermal and pressure differences between the two regions. Therefore, a foam core sandwich shell is used for the hemispherical- or elliptical-shaped common bulkhead structures. The foam core sandwich shell provides excellent thermal insulation performance and a high structural stiffness-to-weight ratio. However, foam materials exhibit highly nonlinear compressive behavior, which makes it difficult to predict the buckling behavior of foam core sandwich shells. In addition, the actual thin-walled shell structure contains initial imperfections that further complicate the prediction of the buckling behavior.

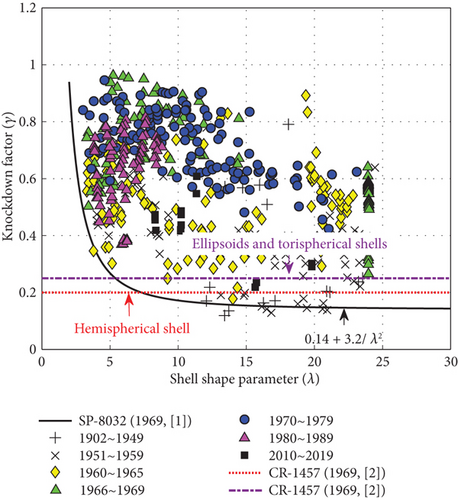
The experimental and numerical studies were performed to update the KDFs of hemispherical shells under external pressure [3–6], where the global buckling loads of metallic hemispherical shells were measured and the test results were compared with the numerical analysis results. The finite element models in the previous studies [3–6] used the measured geometric data from test articles to represent the geometric initial imperfection of hemispherical shells. However, it is impossible to use the measured initial imperfections in the preliminary structural design phase. Therefore, numerical studies were performed to establish and validate numerical initial imperfection modeling techniques for metallic dome structures [7–9]. Different initial imperfection techniques were utilized, considering cutout [7], mode shape imperfection [7], localized reduced stiffness method [8, 9], and dimple imperfection [9]. These imperfection modeling techniques were applied to metallic dome structures with different shapes: hemispherical [7, 9–14], spherical [8], elliptical [7–9], and torispherical shells [7–9, 15–17]. The previous studies [3–9] conducted in-depth investigations on metallic dome structures. However, the research to derive the KDFs of foam core sandwich shells under external pressure has not been reported.
In this study, numerical analyses are performed using the commercial nonlinear finite element analysis code, ABAQUS, to derive the KDF for hemispherical foam core sandwich shells under external pressure. The crushable foam modeling technique in ABAQUS is used to represent the nonlinear compressive behavior of the foam material. The present modeling and analysis techniques are validated against test results for hemispherical foam core sandwich shells in the reference [18]. In addition, a numerical initial imperfection modeling technique using a hemispherical rigid shell is introduced to represent the geometric initial imperfection of a hemispherical foam core sandwich shell. Subsequently, a postbuckling analysis for the hemispherical foam core sandwich shell under external pressure is performed using the Riks method. Finally, the KDFs are derived from the postbuckling analysis results with and without initial imperfections. The derived KDFs are compared with previous NASA buckling design criteria for dome structures [1, 2].
2. Numerical Methods
2.1. Models and Finite Element Modeling Techniques
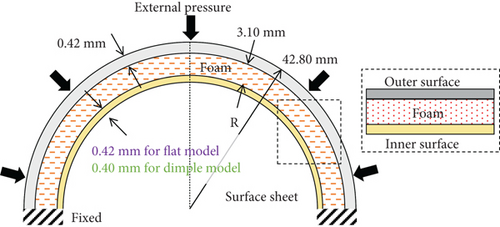
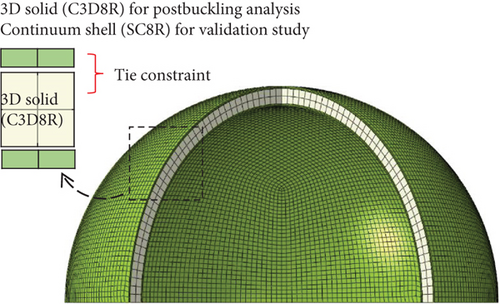
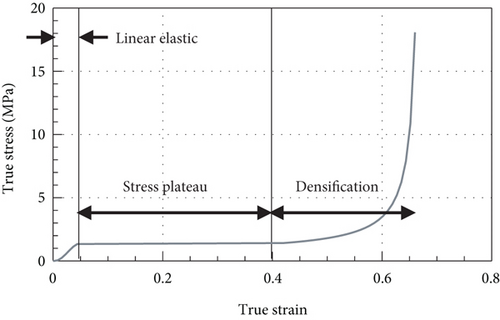
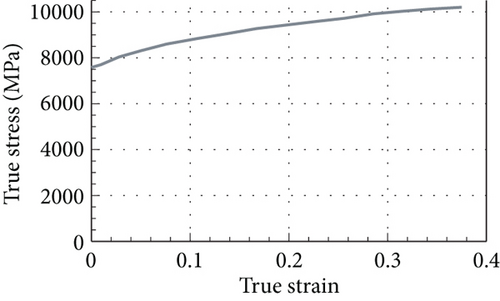
Two test articles of hemispherical foam core sandwich shells from a previous study [18] are used as the present analysis models. As shown in Figure 3(a), the two test articles represent the structural configuration of the common bulkhead structures using foam core sandwich shells. Since the outer radii (R) of the test articles are 42.80 mm each, therefore, the two test articles are small-scale models compared with actual launch vehicle structures. As shown in the figure, the dimple and flat models feature inner sheet thicknesses of 0.40 mm and 0.42 mm, respectively. Except for the inner sheet thickness, all the other geometric dimensions are the same. Owing to the difference in the inner sheet thickness, the deformed shape of the flat model is flatter than that of the dimple model. These deformed shape results are described in Section 3.1. The surface sheets and foam core are fabricated using 201 stainless steel and PVC80 foam, respectively. The material properties for the plasticity of the stainless steel and PVC80 foam are obtained from a previous study [18] and are described in Table 1 and Figure 4. The bottom edges of the two present shell models are clamped. The external pressure is represented by a uniformly distributed load. The foam core is modeled using the three-dimensional (3D) solid elements (C3D8R) with an element size of 1.54 mm to account for the large volume change resulting from the nonlinear compressive behavior of the foam material (Figure 3(b)). The surface sheets are modeled using the 3D solid elements (C3D8R) with an element size of 1.04 mm. The element sizes of the foam core and surface sheets are determined based on a previous study [18]. The elements of the surface sheets and the foam core are connected using tie constraints in ABAQUS.
| PVC80 foam | Stainless steel | |
|---|---|---|
| Elastic modulus (GPa) | 0.04 | 210 |
| Poisson’s ratio | 0.00 | 0.33 |
| Density (kg/m3) | 80 | 7850 |
2.2. Material Nonlinearity Modeling Techniques
2.3. Single Dimple Imperfection Approach (SDIA)

2.4. Analysis Procedure
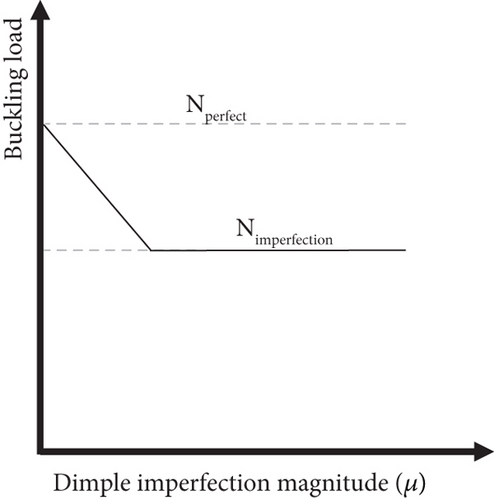
A postbuckling analysis is performed to obtain the global buckling loads and to derive the KDFs of the dimple and flat models. The analysis procedure consists of an initial imperfection modeling step and a nonlinear postbuckling analysis step. In the first step, the geometric initial imperfection is modeled using the SDIA described in the previous section. The deformed foam core sandwich shell resulting from the imperfection modeling is passed on to the postbuckling analysis step without prestresses. In the second step, a nonlinear postbuckling analysis is conducted using the Riks method without the application of the stabilization technique. The external pressure is applied to the deformed hemispherical foam core sandwich shells, and the buckling behaviors are predicted. The procedure of the postbuckling analysis is repeated by increasing μ until Nimperfect converges.
3. Results and Discussion
The results of the validation study and postbuckling analyses are presented in Sections 3.1 and 3.2, respectively. The dimple and flat models described in Section 2.1 are used in both the validation (Section 3.1) and postbuckling analyses (Section 3.2); however, the analysis methods and modeling techniques used in the two sections are slightly different. In the validation study (Section 3.1), axial compression by a rigid plate is applied to both models to represent the loading condition of the compression test [18]. In the compression test [18], the dimple and flat models are compressed using a rigid plate of a universal testing machine. However, the buckling design criteria are derived for the uniformly compressed shells [1, 2]; thus, the uniformly external pressure is used in the postbuckling analyses (Section 3.2) to derive the KDFs of the dimple and flat models. The approaches and results of the validation study and postbuckling analysis are described in detail in each section.
3.1. Validation for Finite Element Modeling Techniques
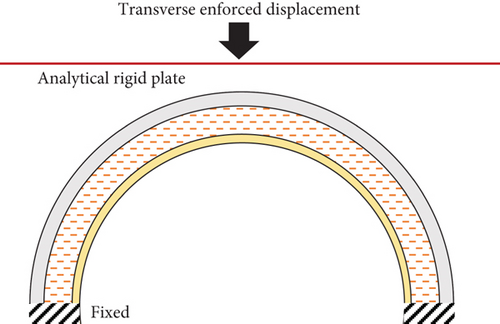
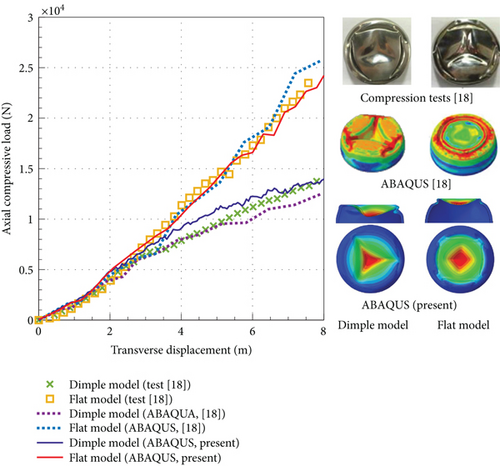
A validation study is performed to establish a finite element modeling technique for hemispherical foam core sandwich shells. The dimple and flat models in the validation study are regarded as perfect models without initial imperfections. Figure 8 shows the method and results of the validation study. The axial compressive load in the compression test [18] is replaced with an analytical rigid plate subjected to an axial enforced displacement (Figure 8(a)). Therefore, in this validation study, the surface sheets of hemispherical foam core sandwich shells are modeled using (3D) continuum shell elements (SC8R) instead of solid elements (C3D8R) to consider the contact between the surface sheet and an analytical rigid plate. A validation analysis is conducted using an explicit scheme with a surface-to-surface contact method. As shown in Figure 8(b), for the dimple and flat models, the present load–displacement curves are similar to those of previous results obtained from compression tests and ABAQUS analyses [18]. In the present analysis, the axial compression by a rigid plate causes transverse deformation with a significant volume change of the foam core (Figure 8(b)). The deformed shape of the flat model obtained from a compression test [18] has three wrinkles. However, four wrinkles and one circular wrinkle are observed in the present and previous ABAQUS [18] results, respectively. This difference in the deformed shape of the flat model may be caused by the uncertainty of the compression test [18], such as the imperfect bond area of the foam core sandwich or boundary imperfections. The initial imperfections of the dimple and flat models are not considered in the ABAQUS analyses of the present and previous studies [18]. However, differences in the deformed shapes of the dimple and flat models are clearly observed in both the present and previous studies [18]. In addition, the load–displacement curves obtained from the present and previous studies [18] show good agreement. Therefore, the finite element modeling technique, which considers the nonlinear compressive behavior of the foam material, is validated.
3.2. Postbuckling Analysis Results
In the postbuckling analysis, the foam core sandwich shells are buckled by uniform external pressure. Therefore, the surface sheets of the foam core sandwich shells are constructed using solid elements (C3D8R), as described in Section 2.1. Furthermore, in this section, not only perfect models are considered, but also imperfect models with various dimple imperfection magnitudes (μ) are considered in order to derive the KDFs of the dimple and flat models.
3.2.1. Dimple Model
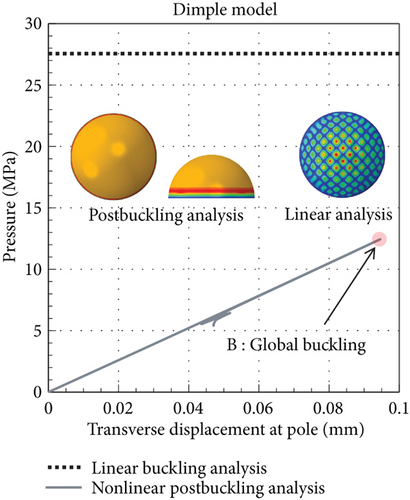
This section describes the buckling analysis results of a dimple model with an inner sheet thickness of 0.40 mm. Figure 9 shows the buckling analysis results for a perfect dimple model without initial imperfections when external pressure is applied. The transverse displacement shown in the figure is calculated at the pole of the hemispherical shell. The global buckling load obtained from linear buckling analysis is 27.56 MPa. However, the global buckling load obtained from the nonlinear postbuckling analysis is predicted to be 12.44 MPa, which is 54.68% lower than that of the linear buckling load. In general, the global buckling loads obtained from linear buckling and nonlinear postbuckling analyses for thin-walled shell structures are similar; thus, geometric nonlinearity may not significantly affect the global buckling load. Therefore, the difference in the global buckling loads between the linear and nonlinear analyses in this study may be caused by material nonlinearities, such as plasticity. As shown in the figure, the buckling shapes are different between the two analysis results. In the linear buckling analysis results, global buckling presents a checkerboard shape; however, in the nonlinear postbuckling analysis, the global buckling presents a ring shape near the bottom edge. These results indicate that material nonlinearity affects the global buckling loads and buckling shapes of hemispherical foam core sandwich shells. It is difficult to predict the reduction in global buckling loads due to material nonlinearity at the preliminary design phase without actual structures. Therefore, in this study, the linear buckling load (Nperfect) is used as the global buckling load for the perfect model without initial imperfections when the KDF is derived using Equation (1).
The load–displacement curves of the dimple models with different dimple imperfection magnitudes (μ) are illustrated in Figure 10. The transverse displacements of these curves are shifted in the positive direction by the dimple imperfection magnitudes. As μ increases, the global buckling loads considering the initial imperfection (Nimperfect) decrease. However, Nimperfect converges to 5.63 MPa when the μ exceeds 0.75. Local buckling (a) is clearly observed at μ = 0.25 and 0.50. As μ increases to 0.75, local buckling disappears. Figure 11 presents the deformed shapes of the dimple models at μ = 0.25. As shown in Figure 11(a), at the local buckling (a), only the outer sheet of the hemispherical foam core sandwich shell is buckled. However, at the global buckling (b), the entire shell structure, including the outer/inner sheets and foam core, is buckled (Figure 11(b)). The postbuckling shape (c) is obtained from the postbuckling analysis result at the last iteration. The deformed shape in the postbuckling state (c) is similar to that in the global buckling (b); however, the area of the dimple shape caused by the external pressure increases in the transverse and radial directions (Figure 11(c)).
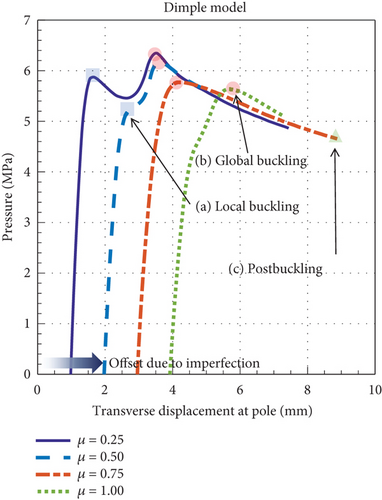
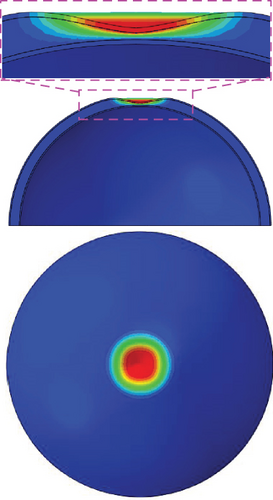
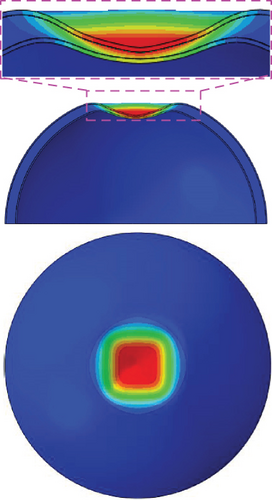
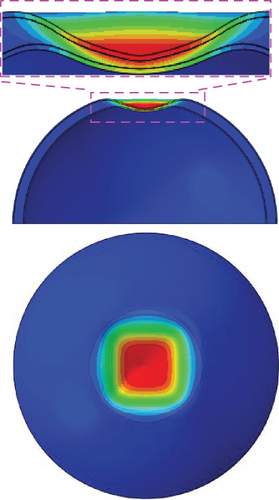
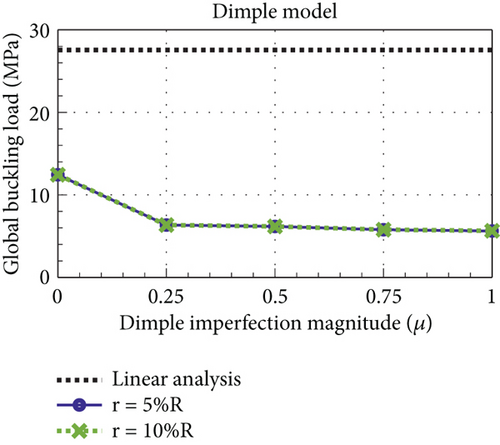
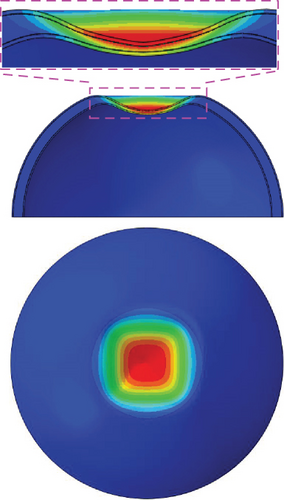
Figure 12 shows the Nimperfect values for different radii of the hemispherical rigid shell (r). When r is 5%R, the Nimperfect is calculated to be 5.65 MPa, which is slightly higher by 0.35% than the results obtained with r = 10%R (5.63 MPa). The Nimperfect are almost constant for the two radii of the hemispherical rigid shells (r). In addition, as the value of r increases, distortion is easily avoided for the solid elements. Therefore, in this study, r = 10%R is used to model the geometric initial imperfections of hemispherical foam core sandwich shells. In general, geometric initial imperfections in thin-walled structures are represented as localized imperfections; thus, r values greater than 10%R are not considered in this study.
3.2.2. Flat Model
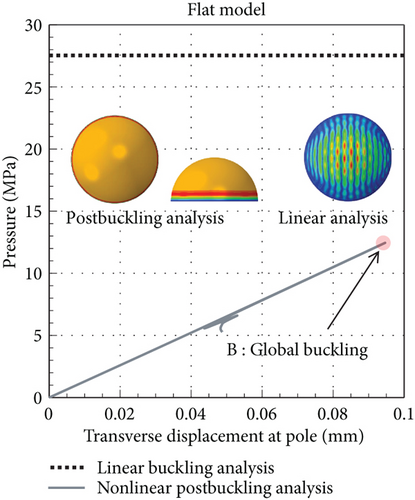
The buckling analysis results for a perfect flat model without initial imperfections are shown in Figure 13. The flat model has an inner sheet thickness of 0.42 mm, which is 5.00% thicker than that of the dimple model. The global buckling loads obtained from the linear buckling analysis (Nperfect) and nonlinear postbuckling analysis are 27.56 and 12.44 MPa, respectively. Similar to the results of the dimple model in the previous section, the global buckling load obtained from the nonlinear postbuckling analysis is 54.78% lower than the linear buckling load. Based on the linear buckling analysis, buckling waves are distributed in the upper region of the shell. However, in the postbuckling analysis, buckling waves are observed at the bottom edges. The differences in the buckling loads and shapes are due to material nonlinearity, as described previously.
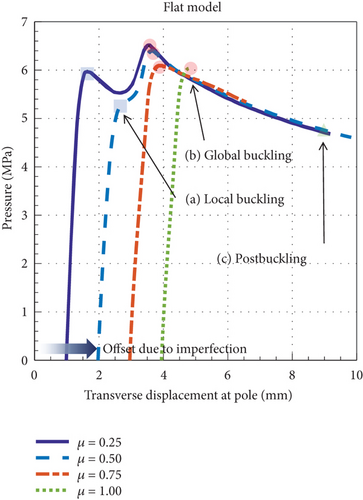
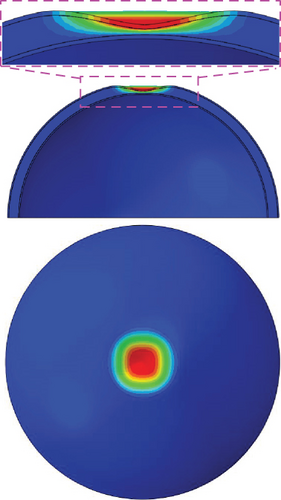
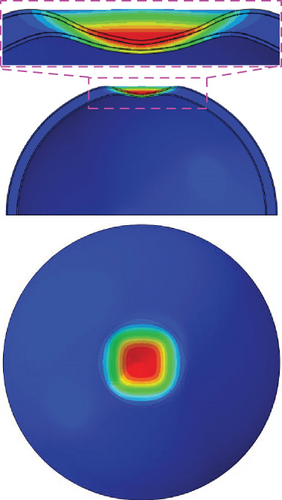
Figures 14 and 15 show the postbuckling analysis results of the flat models with different dimple imperfection magnitudes (μ). As shown in Figure 14, the Nimperfect is predicted to be 6.03 MPa when μ exceeds 0.75. Local buckling (a) is observed in the curves at μ = 0.25 and 0.50. Similar to the results of the dimple model shown previously in Figure 10, local buckling (a) does not occur when μ exceeds 0.75. As the external pressure increases until μ = 0.25, only the outer sheet of the flat model is buckled, and local buckling (a) is observed (Figure 15(a)). When global buckling (b) occurs after local buckling (a), the inner sheet is buckled together with the outer sheet (Figure 15(b)). As the external pressure continues to increase, the area of the dimple shape in the postbuckling state increases in the transverse and radial directions. Figure 15(c) shows the postbuckling shape (c) obtained from the postbuckling analysis result at the last iteration.
3.2.3. Global Buckling Loads and Buckling KDFs
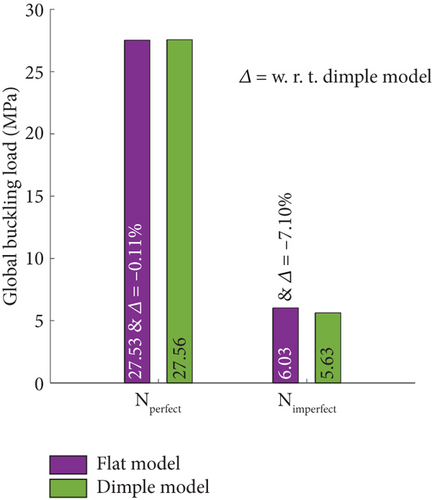
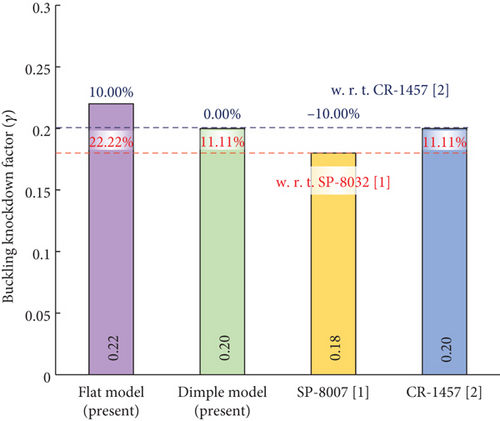
Figure 16 summarizes the global buckling loads of the dimple and flat models. As shown in the figure, the Nperfect of the dimple and flat models from linear buckling analyses are quite similar with a difference of −0.11%. However, the Nimperfect of the flat model (6.03 MPa) is 7.10% higher than that of the dimpled model (5.63 MPa). This difference in Nimperfect is due to the fact that the inner sheet thickness of the flat model is 5.00% thicker than that of the dimple model. Since the buckling stability of the perfect model is higher than that of the imperfect model, the effect of the inner sheet thickness is not evident in the global buckling loads for the perfect models (Nperfect). Figure 17 shows the KDFs for the dimple and flat models obtained from the global buckling load results (Figure 16). The KDF of the flat model is derived to be 0.22, which is 10.00% higher than that of the dimple model (0.20). The KDF of the flat model is 22.22% and 10.00% higher than those of NASA SP-8032 (0.18 [1]) and CR-1457 (0.20 [2]), respectively. The KDF of the dimple model is 11.11% higher than that of NASA SP-8032 (0.18 [1]) but equal to that of NASA CR-1457 (0.20 [2]). Both dimple and flat models are small-scale models that are more sensitive to geometric initial imperfections than large-scale structures [24–27]. In addition, since the inner thickness of the dimple model is 4.77% thinner than that of the flat model, the dimple model is susceptible to buckling due to the uniaxial compression load [18] and external pressure, as compared with the flat model (see Figures 8(b) and 16). Therefore, the present KDF of the dimple model with geometric initial imperfections is identical to the results in NASA CR-1457 [2]. The two KDFs presented are higher than that of NASA SP-8032 [1]; thus, they can provide a lightweight design of hemispherical foam core sandwich shells for common bulkhead structures. However, compared with the NASA CR-1457 [2], only the KDF of the flat model satisfies the lightweight design. Although the KDF of the dimple model and NASA CR-1457 [2] are the same, the other KDFs derived in this study are higher than the previous buckling design criteria [1, 2]. This implies that the buckling design criteria (or buckling KDFs) for hemispherical foam core sandwich shells can be improved by advanced numerical analyses instead of buckling tests.
4. Conclusions
In this study, the KDFs of hemispherical foam core sandwich shells under external pressure were numerically derived using ABAQUS. A finite element modeling technique considering the nonlinear compressive behaviors of the foam material was established and validated based on comparison with previous compression tests and postbuckling analyses for dimple and flat models. The crushable foam modeling technique in ABAQUS was used to represent the nonlinear compressive behavior of the PVC80 foam material. Postbuckling analyses were performed using the Riks method for hemispherical foam core sandwich shells under external pressure. The SDIA was established and used to represent the geometric initial imperfection of hemispherical foam core sandwich shells.
For the dimple model, the global buckling loads were reduced from 27.56 to 5.63 MPa due to the geometric initial imperfection. The KDF of the dimple model was derived to be 0.20. The KDF of the dimple model (0.20) was 11.11% higher than that of NASA SP-8032 (0.18) and equal to that of CR-1457 (0.20). The Nperfect of the perfect flat model was 27.53 MPa, similar to that of the perfect dimple model (27.56 MPa). However, the Nimperfect of the flat model (6.03 MPa) was 7.10% higher than that of the dimple model (5.63 MPa) since the flat model had a thicker inner sheet thickness. The KDF of the flat model (0.22) was 22.22% and 10.00% higher than those of the NASA SP-8032 (0.18) and CR-1457 (0.20), respectively. All of the derived KDFs in the present study were higher than or equal to the previous buckling design criteria; thus, the present results showed that KDFs can be updated for hemispherical foam core sandwich shells.
The foam core sandwich shells can be utilized for the common bulkhead structures of space launch vehicles. Since the dimple and flat models in this study were designed as the small-scale model, the present models did not adequately represent the large-scale model and they were more susceptible to geometric initial imperfections than the larger-scale models used in launch vehicles. Consequently, a study with large hemispherical foam core sandwich shells will be required in order to derive numerically a robust KDF that can be applied to space launch vehicle structures. Moreover, the KDFs of the hemispherical foam core sandwich shells depended on the inner sheet thickness of the foam core sandwich. Therefore, future investigations will be conducted to examine the KDFs of foam core sandwich shells with different inner sheet thicknesses. Furthermore, the initial imperfection modeling techniques will be improved to represent the more realistic imperfections of foam core sandwich shells, including debonding between surface sheets and a foam core or densification of a foam core due to hardening.
Disclosure
Part of this paper was presented at the 2023 Aerospace Europe Conference-10th EUCASS-9th CEAS, Switzerland, July 9–13, 2023.
Conflicts of Interest
The authors declare no conflicts of interest.
Funding
This work was supported by the Design and Evaluation of Common Bulkhead Propellant Tanks for the Applications of Launch Vehicle Systems (NRF-2021M1A3B9096762) and the National Research Foundation of Korea (NRF) grant funded by the Korea government (MSIT) (NRF-2022M1A3B8076744).
Open Research
Data Availability Statement
The numerical data used to support the findings of this study are included within the article.


