A Global Spatial–Temporal Energy Poverty Assessment and Social Impacts Analysis
Abstract
Energy poverty (EP) has emerged as a major challenge to achieving sustainable development goals, and its significance in social development has increased over time. This paper aims to analyze the spatial autocorrelation between EP and social factors on a global scale. Utilizing the panel data of 116 countries from 2012 to 2019, the Bivariate local Moran index, a representative spatial econometrics tool, has been employed to examine temporal changes and spatial differences of transboundary synergy and tradeoff relations between EP and social factors. The results indicate that EP has synergy relationships with social factors, including life expectancy at birth, access to immunization, CO2 emission, and forest area, and tradeoff relationship with social factors, such as infant mortality rate, prevalence of undernourishment, forest rents, and gender inequality. Significant spatial differences have been observed that clusters of high-income countries, particularly those in the Global North, tend to have better energy access and are surrounded by areas with favorable social conditions, and clusters of lower-income countries, especially those in South Africa and Southeast Asia, have lower energy access and are surrounded by areas with more severe social conditions. The robustness analysis has been conducted to verify the reliability of the results. The spatial imbalance of findings offers robust evidence by emphasizing the importance of key areas, such as Southeast Asia and South Africa, that should be prioritized to take essential policy measures to address the EP and social issues.
1. Introduction
Energy poverty (EP) is defined as the inability of a household to secure a socially and materially required level of energy services in the home [1]. Individuals experiencing EP heavily depend on traditional solid fuels for their primary energy needs [2], and significant time is dedicated to gathering local energy like wood and dung [3]. This situation has negative socioeconomic impacts, particularly for women, who often bear the responsibility of cooking and household tasks [4]. In this regard, the socioeconomic impacts of EP have garnered considerable attention among scholars [5, 6, 7, 8]. Existing literature highlights that EP is related not only to economic development [3] but also to various social issues [9, 10], including public health [11], gender inequality [4], and environmental concerns like deforestation [3, 12, 13] and CO2 emissions [8].
Generally, the relationship between EP and social factors may vary with time and space, and EP may become better or worse accordingly. Thus, this paper aims at conducting comprehensive quantitative studies on transboundary tradeoff-synergy relations of EP and social factors and analyzing their spatial–temporal variations for better identifying the vulnerable areas and formulating adaptive EP alleviation strategies. However, former research investigating the relationship between EP and social factors has predominantly utilized regression models, such as two-stage least squares (2SLS) [14] and panel fixed effect regression model [15]. Limited studies involved spatial characteristics of the relationship between EP and social factors, generating some limitations in the effective spatial management of EP alleviation. Spatial autocorrelation, a key aspect of spatial statistics, plays a crucial role in exploring spatial distribution patterns. Among different types of spatial statistics, Moran’s I statistic, initially proposed by Moran [16] and improved by Cliff and Ord [17], is frequently used to measure spatial autocorrelation [18, 19, 20]. In this study, we propose the utilization of bivariate local indicators of spatial association (BI-LISA), which assesses the type and intensity of interaction between a pair of factors at the local scale [21]. This approach allows for the identification of spatial clusters and the determination of spatial interaction areas related to the two factors, whose findings could provide valuable insights for proposing effective strategies to alleviate EP.
The paper aims to analyze the spatial autocorrelation between EP and social factors on a global scale. Given the objective, it is essential to focus on the following crucial research questions: How does EP correlate with social factors? What are the temporal changes and spatial differences in the association between EP and social factors? Addressing the abovementioned questions could not only contribute to the progress towards achieving multiple SDGs simultaneously but also highlight the regions that require urgent attention for realizing global equity in both energy and social issues.
The corresponding contribution of this paper is as follows: First, it adopts a global perspective by empirically examining the spatial difference in the relationship between EP and social factors across countries, building upon the qualitative analysis presented in the work of Chevalier and Ouédraogo [3] and Sovacool [22]. Second, previous research on the EP domain has primarily focused on household-scale data [5, 7, 23, 24]. There is a lack of international evidence utilizing panel data in investigating the spatial characteristics of the relationship between EP and social. Considering the significant variation of EP across geographical locations, this paper utilized the panel data of 116 countries, whose country list is presented in Table S1, between 2012 and 2019 to identify the spatial cluster areas that suffer from both EP and social issues, to assist policymakers in alleviating disparities and promoting equitable energy access and social justice.
The structure of this paper is as follows: Section 2 offers a literature review on the relationship between EP and social factors; Section 3 introduces the spatial analytical methods employed in this paper; Section 4 presents the results of BI-LISA along with the sensitivity analysis. In Section 5, we have a further discussion of our findings. Finally, Section 6 concludes the paper by presenting our main findings, limitations, and prospects.
2. Review on the Relationship between EP and Social Factors
Previous studies have demonstrated that EP may vary among times and spaces. For example, Wang et al. [25] used the remote-sensing and socioeconomic survey data and machine learning algorithm to predict the EP in India, whose findings show EP is strongly correlated with the geographical features of the areas. Spandagos et al. [26] proposed using the machine learning tool, specifically a random forest classifier, to predict and target energy-poor households more accurately, clarifying the spatial difference in EP across the European Union and the United Kingdom. Given the spatial imbalance of EP and social issues, conducting comprehensive quantitative studies on transboundary synergy and tradeoff relations of EP and social factors is a significant issue to be tackled for better identifying the vulnerable areas and formulating adaptive EP alleviation strategies. Previous research regarding the relationship between EP and social factors [22], especially its connection between public health, gender empowerment, and degradation of the natural environment, has been elaborated in Table 1.
| References | Regions | Period | Methodology | Result |
|---|---|---|---|---|
| Recent studies on the relationship between EP and public health | ||||
| Nawaz [14] | Pakistan | 2018–2019 | 2SLS | The significant impact of EP on health |
| Pan et al. [11] | 175 countries | 2000–2018 | GMM estimation | The causal effect of EP on public health |
| Banerjee et al. [15] | 50 developing countries | 1999–2017 | The panel fixed effect regression model | The significant impact of the EP on well-being |
| Recent studies on the relationship between EP and gender inequality | ||||
| Nguyen and Su [4] | 51 developing countries | 2002–2017 | GMM estimation | The reduced EP is an influential factor in gender equality |
| Recent studies on the relationship between EP and environmental degradation | ||||
| Khan et al. [27] | 48 BRI economies | 2001–2020 | SYS-GMM dynamics techniques | Technology-driven energy deficits positively impact CO2 emissions |
| Zhao et al. [8] | 30 Chinese provinces | 2002–2017 | SYS-GMM dynamics techniques | EP could increase the CO2 emission |
| Nguyen and Su [13] | 74 developing countries | 2002–2016 | Regression model | Reducing EP initially leads to a decrease in forest degradation and forest rent up to a certain predetermined point. Then, beyond that point, the improvement in energy access could contribute to increased deforestation and forest rent |
The existing literature empirically highlights that EP is related to various social challenges, including public health [11], gender inequality [4], and environmental concerns like deforestation [3, 12, 13] and CO2 emissions [8]. For example, for the relationship between EP and public health, Nawaz [14] verified the significant impact of EP on health in Pakistan by the 2SLS regression model. Using the panel data of 175 countries from 2000 to 2018, Pan et al. [11] identified the causal effect of EP on public health through the system generalized method of moments (SYS-GMM) estimation. Banerjee et al. [15] also examined the impact of the EP on well-being and educational outcomes for 50 developing countries from 1999 to 2017 by using the panel fixed effect regression model. Regarding the association between EP and gender inequality, Sovacool [22] observed possible linkages between access to modern energy services and gender equity and highlighted the potential influence of EP on gender roles and educational attainment. Pachauri and Rao [28] proposed the need for further research to develop a comprehensive understanding of how EP impacts the well-being of females. Meanwhile, Listo [29] argued that a collaborative endeavor involving researchers, policymakers, and practitioners is crucial for conducting interdisciplinary research on tackling the gender inequality problem caused by EP. Using a sample of 51 developing countries from 2002 to 2017, Nguyen and Su [4] investigated the influence of EP on gender inequality based on a two-step SYS-GMM estimator. In addition, as for the relationship between EP and environmental issues, such as CO2 emission and forest degradation. It has been empirically proved that the more nonrenewable energy consumption the more CO2 emission and the worse the environmental quality, in G7 economies [30, 31]. Meanwhile, households with lower income will have higher CO2 emissions in the both short and long term based on the data from Pakistan from 1971 to 2015 [32]. In this regard, using the dataset from 30 Chinese provinces from 2002 to 2017 and the SYS-GMM method, Zhao et al. [8] concluded that EP households accompanied by lower income and more traditional fuel usage could have higher CO2 emissions. Based on SYS-GMM dynamics techniques with balanced panel data of 48 BRI economies from 2001 to 2020, Khan et al. [27] revealed that technology-driven energy deficits positively impact CO2 emissions. Nguyen and Su [13] also analyzed the impact of the EP index on forest area and forest rent by utilizing panel data of 74 developing economies from 2002 to 2016. The findings suggest that reducing EP initially leads to a decrease in forest degradation and forest rent up to a certain predetermined point. However, beyond that point, the improvement in energy access could contribute to increased deforestation and forest rent. That would also be similar to the findings of Khan and Yahong [33], utilizing the data from 18 Asian developing economies from 2006 to 2017; they proved that access to electricity may control income inequality but negatively impact the environment.
However, former research focuses on investigating the relationship between the EP and social factors by using a regression model and has not been able to explain the significant variations of spatial features of the relationship between EP and social factors across countries. Unearthing spatial patterns of these associations within countries allows for providing insights into how these factors influence each other spatially and identifying areas with high concentrations of EP and specific social issues to assist in developing targeted interventions and allocating resources more effectively to address EP and related social challenges.
3. Methods and Data
3.1. Methods for Measuring Synergies and Tradeoffs
Synergy is observed when two variables change in a similar direction, whereas a tradeoff occurs when two variables change in the opposite direction [34, 35]. To examine synergy and tradeoff, the conventional statistical analysis approach primarily concentrates on the associations between various variables measured in the same location. The tradeoff and synergy between EP and social factors might vary across different spatial locations due to the influences of both social and environmental factors. Spatial autocorrelation is defined as the statistical relationship between spatially adjacent locations [36], which measures the degree to which similar values of a variable are clustered together in space. Moran’s I is a widely employed mathematical indicator used to quantify spatial autocorrelation [37]. However, it is limited to measuring spatial autocorrelation for a single variable; clustering change within the same unit is often influenced by other characteristics. In contrast, BI-LISA allows the simultaneous exploration of geospatial characteristics for two variables [38]. Bivariate local Moran’s I, a modified version of the traditional approach, examines the relationship between variables in close proximity [39] and has been used to investigate spatial inequalities.
In this study, considering the spatial difference, the bivariate spatial autocorrelation model was employed to explore the spatial distributions of tradeoff and synergy between two variables [35, 40, 41]. We utilized BI-LISA for exploratory spatial analysis to examine the spatial coincidence between two variables with lower levels of energy access and specific social factors for identifying areas that could potentially achieve both social and energy access objectives. All analyses were performed through Python, whose code has been provided at the end of supplementary material, and the final mapping was carried out using ArcGIS.
3.1.1. Setting of Spatial Weight Matrix
- (1)
Geographical distance matrix
- (2)
Economic distance matrix
- (3)
Gravity model matrix
The definitions of notations are the same as before. The data used in this paper are collected from WDI and the GeoDist database, which are shown in Tables S2 and S3.
3.1.2. Bivariate Local Moran Index
Based on the agglomeration degree of EP level in country i and the social factor performance in country j, four local spatial clusters are identified, including high–high (H–H) and low–low (L–L) clusters, which indicate positive spatial autocorrelation and suggest a synergy relationship between the specific social factor and EP level within a cluster of locations [45]. Conversely, low–high (L–H) and high–low (H–L) clusters indicate negative spatial autocorrelation, suggesting a tradeoff relationship between the two variables within a cluster of locations [45].
3.2. Data and Variables
3.2.1. Data
After excluding the countries with insufficient data, this paper uses a dataset of 116 countries from 2012 to 2019, which is shown in Table S4. The data for this paper are sourced from the WDI of the World Bank and Human Development Reports (HDR) dataset of the United Nations. There are several reasons why we selected these datasets. First, most previous studies on EP have focused on household-scale data. The utilization of panel data for global evidence is relatively uncommon within the current research. Second, WDI and HDR provide extensive and comprehensive data, ensuring that all the necessary information required is available. Table 2 shows the definition of each variable, and Table 3 summarizes the corresponding statistical description.
| Variables | Definitions | Data source |
|---|---|---|
| EP1 | Access to clean fuels and technologies for cooking (% of population) | WDI |
| EP2 | Access to electricity (% of population) | WDI |
| EP3 | Access to electricity, rural (% of rural population) | WDI |
| EP4 | Access to electricity, urban (% of urban population) | WDI |
| Life expectancy at birth, total (years) | It reflects the expected lifespan of the newborn, assuming the mortality rates prevailing at the time of birth remain constant during its entire lifetime | WDI |
| Infant mortality rate (per 1,000 live births) | It represents the ratio of infants who do not survive beyond their first year based on per 1,000 newborns during the particular year | WDI |
| Prevalence of undernourishment (% of population) | The ratio of population with insufficient food consumption for maintaining a healthy and active life | WDI |
| Access to immunization (% of children ages 12–23 months) | The percentage of children between the ages of 12 and 23 months who have been immunized against measles | WDI |
| CO2 emission (metric tons per capita) | It stems from burning fossil fuels and manufacturing cement | WDI |
| Forest area (% of land area) | It denotes land covered by naturally or artificially grown stands of trees, with a minimum height of 5 m, regardless of their productivity | WDI |
| Forest rents (% of GDP) | It is obtained by multiplying harvested roundwood volume by regional price and regional rental rate | WDI |
| Gender inequality | It is a composite indicator of gender inequality that considers three dimensions: reproductive health, empowerment, and labor market | HDR |
| Variables | Obs. | Mean | Std. dev. | Min | Max |
|---|---|---|---|---|---|
| EP1 | 928 | 75.9268858 | 32.8035908 | 0.3 | 100 |
| EP2 | 928 | 89.8129353 | 20.6001617 | 7.4000001 | 100 |
| EP3 | 928 | 85.2412612 | 26.791939 | 0.92683059 | 100 |
| EP4 | 928 | 95.6384581 | 11.4400055 | 14.8000002 | 100 |
| Life expectancy at birth, total (years) | 928 | 73.9567012 | 6.89991584 | 49.835 | 84.3563415 |
| Infant mortality rate (per 1,000 live births) | 928 | 16.7452586 | 16.2001224 | 1.8 | 71.1 |
| Prevalence of undernourishment (% of population) | 928 | 7.06810345 | 6.90845277 | 2.5 | 39.2 |
| Access to immunization (% of children ages 12–23 months) | 928 | 90.987069 | 9.31500023 | 40 | 99 |
| CO2 emission (metric tons per capita) | 928 | 4.7768416 | 4.60122109 | 0.05138984 | 25.1318614 |
| Forest area (% of land area) | 928 | 31.4792059 | 21.1216028 | 0.00807754 | 97.9524615 |
| Forest rents (% of GDP) | 928 | 1.05835808 | 2.40343519 | 0 | 20.0292149 |
| Gender inequality | 928 | 0.31662608 | 0.1810423 | 0.016 | 0.738 |
3.2.2. EP Indicator
Pachauri and Spreng [46] summarized one approach widely used for EP measurement by considering the limited availability of modern energy services. Obeng et al. [47] utilized electricity accessibility to measure the energy shortage. Nguyen and Nasir [48], Churchill and Smyth [49], and Churchill et al. [9] emphasize that access to clean fuel, modern technology, and electricity could be considered effective indicators for measuring EP. In this regard, four indicators have been used in this study [4, 13] as the proxy of EP, which are shown in Table 2. These indicators serve as a reliable proxy of EP, as supported by the evidence from existing research, and facilitate cross-country comparisons. The lower values of four indicators show the severity of EP condition, whose data are obtained from the WDI.
3.2.3. Public Health Indicator
“Life expectancy at birth” and “infant mortality rate” are widely recognized as the useful proxy of health outcomes at a global scale [50]. Several studies have utilized these two indicators to assess the health condition within the context of EP research. For example, Wilkinson et al. [51] highlight that global energy service provision could impact health conditions, which is reflected in increased life expectancy and reduced child mortality rate. Banerjee et al. [15] used the life expectancy at birth and infant mortality rate to measure health outcomes for examining the effect of EP on health conditions in 50 developing countries between 1990 and 2017. In addition, this paper incorporates additional health indicators to capture the nutritional condition and immunization status, including the prevalence of undernourishment and access to immunization, providing further insights into the health conditions of countries spanning from very poor to developed [15], which has been used in the previous research such as Black et al. [52] and WHO [53].
3.2.4. Environmental Degradation
In many developing countries, traditional fossil fuel is commonly used for energy generation, which would result in the EP and have the detrimental effect on the environment. Sovacool [22] highlighted that EP could lead to negative environmental consequences, such as deforestation and an increase in carbon emissions. Chevalier and Ouédraogo [3] explained that individuals facing EP have to allocate additional time to gather traditional energy resources such as wood to fulfill daily energy requirements. This, in turn, can accelerate deforestation. To assess the impact of EP on deforestation, this study employs the proportion of forest area and forest rent as the proxies of deforestation [13]. The increase in the forest area implies the decrease in deforestation, and the higher value of forest rent indicates a greater reliance on forests for consumption, consequently leading to higher deforestation. The data for forest area and forest rent are obtained from WDI. Meanwhile, Hanif et al. [54] identified the correlation between energy usage and carbon emissions, specifically within developing countries in Asia. They conducted a regression analysis to separately examine the impact of renewable and nonrenewable energy on carbon emissions, whose findings emphasized the crucial role of renewable energy in reducing carbon emissions. Baiwei et al. [55] used the Per capita metric tons (annual) CO2 emissions as a proxy of carbon emission to investigate the relationship between EP and CO2 emission based on data from 40 developing between 2000 and 2019. Based on Baiwei et al. [55] and Hanif et al. [54], annual per capita carbon dioxide emissions in metric tons, whose data were collected from WDI, were used for measuring CO2 emissions, which encompasses CO2 generated from the combustion of fossil fuels and cement production.
3.2.5. Gender Inequality
The EP impacts would vary between genders [56], particularly in terms of employment, health, and social status. This disparity could be attributed to the gendered difference of role, women typically bear the responsibility of cooking and other household chores. That is, the management of traditional energy resources is commonly perceived as the duty towards the female [57, 58], leading to women having limited time and fewer opportunities to pursue decent employment. Additionally, women from EP households face increased vulnerabilities, including exposure to indoor air pollution and extreme temperature conditions. As a result, EP reduces their access to essential life necessities, including healthcare, education, and employment opportunities [57]. Therefore, in this study, the gender inequality index (GII), a multidimensional measure, will be used to encompass three aspects of gender inequality, including labor market, reproductive health, and empowerment. The lower value of GII signifies a lower level of inequality between females and males, while a high value indicates higher inequality, whose data are collected from HDR.
4. Result
This study demonstrates the idea of Sovacool [22] to conduct the spatial autocorrelation analysis between four EP indicators and representative social factors based on the data of 116 countries from 2012 to 2019. The findings provide valuable insights into the connection between four EP indicators and social factors and strengthen some conclusions on the existing studies that were conducted qualitatively. Here, we present the statistical relationship between four EP indicators and social factors across different countries, from which we will investigate temporal changes and spatial clustering patterns of these relationships and do sensitivity analysis to verify the robustness of our findings. More specifically, to achieve a better understanding of spatial autocorrelation between four EP indicators and social factors, we conducted the synergy and tradeoff analysis referring to the result of bivariate local Moran’s I.
4.1. Transboundary Interaction between Four EP Indicators and Social Factors
4.1.1. Temporal Changes of Transboundary Interaction
The EP condition and social factors are various in different geographical contexts. In this regard, we examine the potential tradeoffs and synergies among each pair of relationships and investigate their evolution over time (Figure 1). In this study, we have not only observed the sole synergy or tradeoff relationship but also found the mixture of relationships between various pairs of interactions.


Among the synergy relationships, the high values in four EP indicators are spatially related to high values of the other factors, such as life expectancy at birth, access to immunization, and carbon emission. Without considering the spatial autocorrelation among variables, previous research also indicated a significant relationship between EP and overall health condition [59], life expectancy at birth [11], and CO2 emission [60]. As for the relationship between four EP indicators and forest area, a mixed share of synergies and tradeoffs appear, and as time goes by the synergy dominates the interactions. Indeed, better EP condition contributes to rising forest areas by transforming the fundamental energy consumption patterns of individuals facing EP from traditional fuels, such as wood, to clean energy sources.
Compared with the synergy relationship, the tradeoff relations are stable over time. The tradeoffs are prevalent particularly for gender inequality, forest rents, and public health factors, including infant mortality rate and undernourishment prevalence, illustrating that a cluster of countries where EP indicators have higher values and the other variable has a lower value. Cold climates within households could weaken the immune system of family members, raising the risk of infection and illness. Furthermore, enhanced accessibility of clean energy, particularly for women, positively impacts their well-being, creating opportunities for education and income generation by freeing up their time and resources [56]. Additionally, it has also verified the benefit of reducing forest rents by improving EP [13].
4.1.2. Spatial Difference of Transboundary Interactions
- (1)
Spatial difference in synergies between transboundary interactions

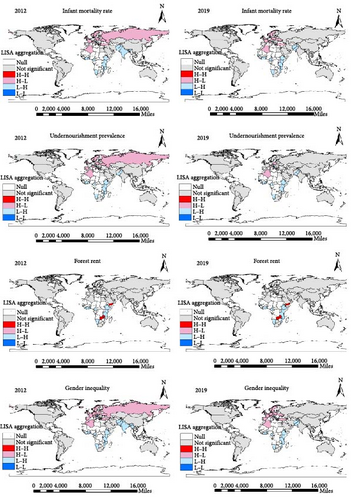
The bivariate LISA analysis in this study explored two types of synergies. The first type presents the agglomeration of synergy (represented by the color red), whose positive and significant value indicates a cluster of courtiers where both variables have high values. In this study, we found that areas with higher levels of energy access are surrounded by higher life expectancy at birth and CO2 emissions in European countries (Figure 2). It is worth noting that H–H clusters are mostly around Europe, especially in North Europe, and Arabia country in 2012. As the condition in 2019, H–H patterns appeared in the US and became weaker in Europe.
Second, another type of synergy is L–L clusters (represented by the color dark blue), whose negative and significant value indicates a cluster of countries where both variables have low values. Our finding indicates that low level of EP indicator and low level of life expectancy at birth, immunization, and CO2 emission in African countries or Southeast Asia. The outcome indicates EP households are also socially vulnerable along with African countries and Southeast Asia, which is consistent with established research that household in the abovementioned areas faces high levels of persistent poverty, poor health conditions [61], and lower CO2 emission [62]. The distributions of synergies reveal that H–H synergy areas predominantly appear in high-income countries, while L–L synergies are more prevalent in low-income regions and exhibit comparatively scattered distributions than H–H clusters. Prioritized EP alleviation efforts should be allocated to the L–L cluster areas.
- (2)
Spatial difference in tradeoffs between transboundary interactions
The tradeoff relations of L–H clusters exist with relatively lower EP indicators and high levels of social factors, including infant mortality rate, undernourishment prevalence, forest rent, and gender inequality in African countries or Southeast Asia, which belongs to low-income countries. Even though we observed the little H–H cluster in the relationship of EP 1 and forest rents, L–H clustering patterns had the largest number and there is little difference between 2012 and 2019. Additionally, the tradeoff relations of H–L clusters between relatively higher EP indicators and lower levels of social factors mainly appear in European countries. H–L clusters of EP and social factors refer to high energy access surrounded by low infant mortality rate, undernourishment prevalence, and gender inequality, which are almost located in European countries. The spatial distributions of tradeoffs exhibit an imbalance, that the H–L tradeoff domain is scattered across European countries and the L–H tradeoff domain is observed in South African countries, which is mostly consistent with economic development.
4.2. Sensitivity Analysis
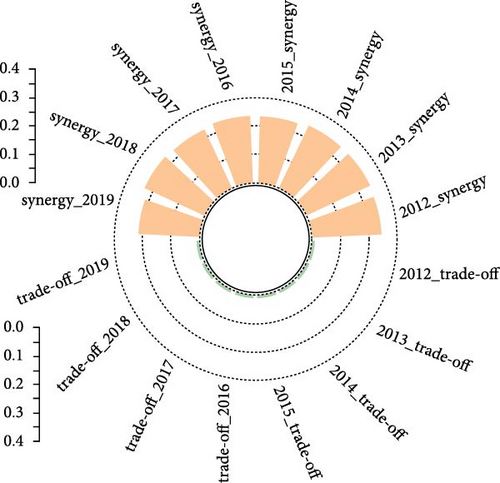
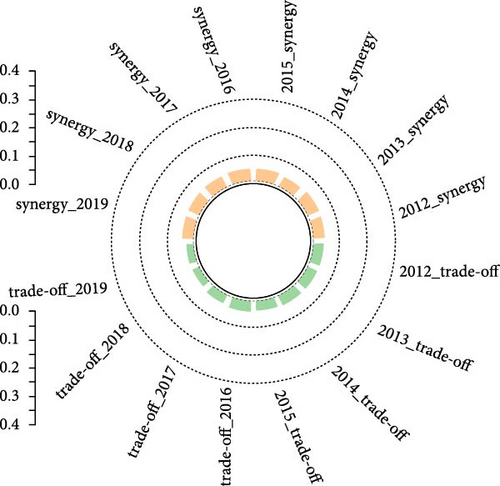
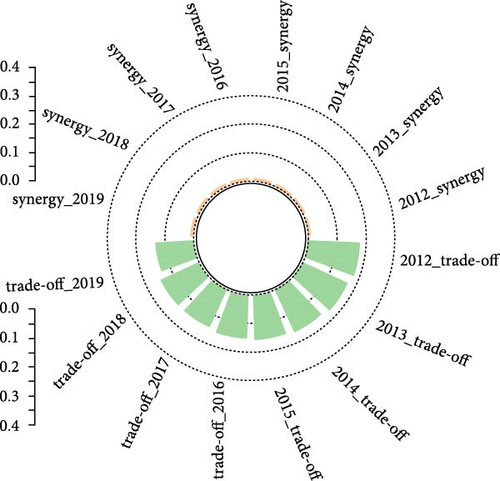
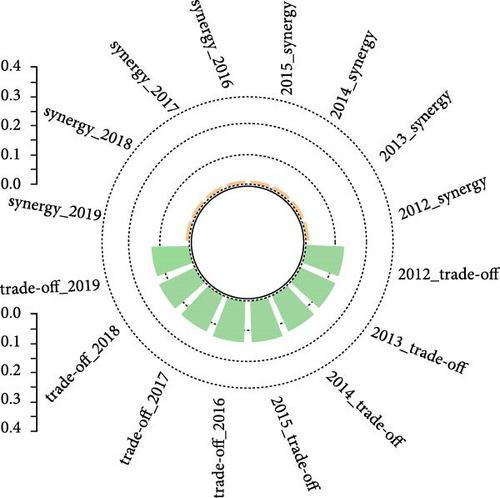
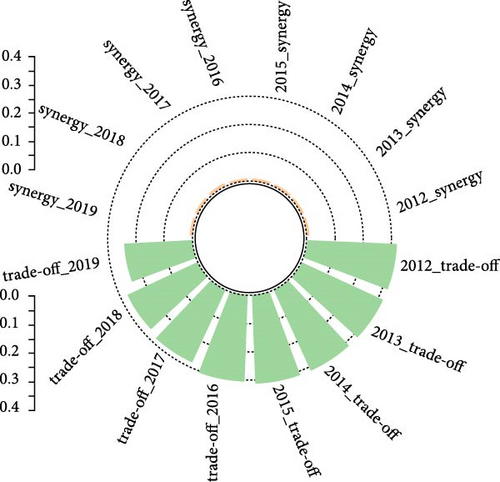
First, we consider the sensitivity of our results to various EP indicators. We assign equal weights to interaction results obtained from four EP indicators to obtain the overall evaluation of synergy and tradeoff. Figure 4 shows the synergy relations, and Figure 5 implies the tradeoff interactions. In both Figures 4 and 5, the orange/green bar represents synergy/tradeoff relations; the larger the orange/green bar, the more share of synergy/tradeoff interactions. It is clear from Figure 4 that there are stable synergy relationships between EP and some social factors from 2012 to 2019, including life expectancy at birth, access to immunization, and CO2 emission. As for the relationship between EP and forest area, the share of synergy and tradeoff is almost equal. The result is similar to the general conclusion obtained from Figures 1 and 2. As for tradeoff relations from the period of 2012–2019, there are stable tradeoff relations of EP and certain social factors, such as infant mortality rate, the prevalence of undernourishment, forest rents, and gender inequality. Among these tradeoff relations, the relationship between EP and gender inequality shares the largest proportions, showing the strongest tradeoff relationship. This result is generally consistent with the findings in Figures 1 and 3, verifying the robustness of the outcome.
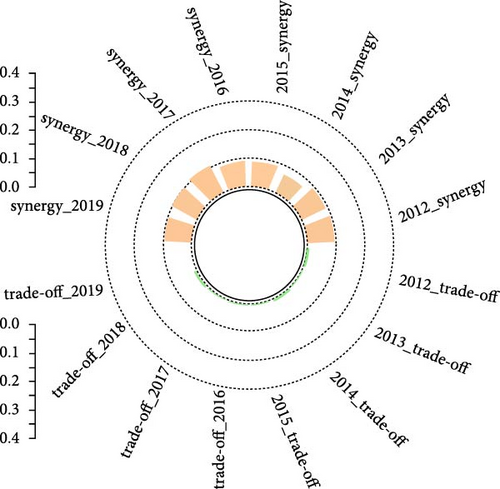
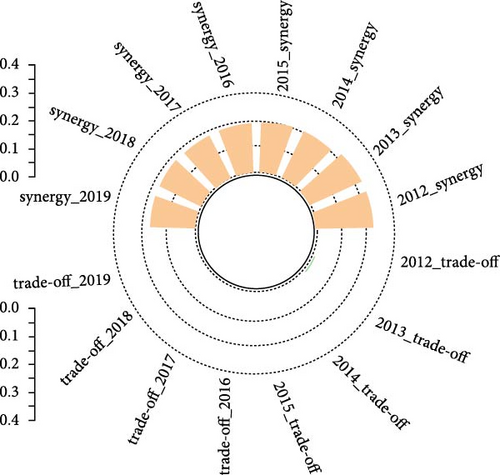

Second, we verify the validity of our findings by testing other spatial weight matrices, such as the economic distance matrix and gravity model matrix. Three spatial weight matrices consider different aspects of spatial weight, and thus, they complement each other. Overall, we observe the similarities and differences between synergy and tradeoff shares while considering three spatial weight matrices (Figure 6). On average, we have observed consistent synergy or tradeoff relationships among the results from three spatial weight matrices. However, it is important to note that the distribution of synergy and tradeoff varies among different periods, four EP indicators, and three spatial weight matrices. More specifically, it had a relatively larger share of synergy or tradeoff relationships in 2012 compared with 2015 and 2019. EP 1 also has stronger relationships with social factors compared with the other three EP indicators. Moreover, the spatial weight matrix constructed by the geographical distance matrix has the largest share of synergy and tradeoff relations compared with the economic distance matrix and gravity model matrix.


5. Discussion
The bivariate local Moran’s I takes into account the spatial intricacies of EP and social factors, whose effectiveness in capturing the clustering characteristics of EP has been supported by previous studies. In this study, we concentrated on four types of EP variables and social factors and utilized BI-LISA to explore vulnerable hotspots of spatial autocorrelation. Our GIS-based analyses, supported by BI-LISA, revealed significant spatial variations in the distribution of synergy (H–H and L–L) and tradeoff (H–L and L–H) domains. More specifically, we have witnessed that there is a synergy relationship between four EP indicators with certain social factors, including life expectancy at birth, access to immunization, CO2 emissions, and forest area. The tradeoff relationship appears in four EP indicators and some social factors, including infant mortality rate, prevalence of undernourishment, forest rent, and gender inequality.
The life expectancy at birth, access to immunization, infant mortality rate, and prevalence of undernourishment are classified as public health. Even though they have different synergy/tradeoff relationships with EP, it has been noticed that the better EP condition of a country is surrounded by the better public health of its neighborhood in Europe, and the severe EP condition of a country is surrounded by the severe health status of its neighborhood in South Africa or Southeast Asia. It could be explained that countries in European countries tend to have better infrastructure and healthcare systems; the cross-border collaboration also enhances their energy security and health outcomes. However, countries in South Africa or Southeast Asia may face greater energy access and health challenges due to rapid urbanization, population growth, and economic disparities Banerjee et al. [15].
We also discovered the different synergy and tradeoff relations of EP and factors related to environmental issues, including CO2 emission, forest area, and forest rents. First, it has a synergy relationship between EP and carbon emissions. Even with progress in clean energy adoption in developed countries, they tend to have a higher level of industrialization and economic development, which often leads to higher CO2 emissions. At the same time, due to the lower industrialization and energy demand, developing countries may have lower levels of overall energy consumption and emissions. Second, our research discovered the significant tradeoff relationships between EP and forest rents and not that obvious synergy relationship between EP and forest area. It could be explained that EP reduction could assist in expanding forest areas and lowering the forest rents by increasing clean energy consumption and decreasing the usage of traditional energy resources, such as wood. Meanwhile, with greater numbers of households obtaining modern energy services, there may be a tendency to engage in large-scale manufacturing and consumption, having the potential to accelerate deforestation [12].
Additionally, gender inequality showed the tradeoff relationship with EP, including the H–L clusters in European countries and L–H clusters in South Africa. European countries with better EP conditions tend to have higher levels of socioeconomic development and well-established legal frameworks and policies promoting gender equality, which can contribute to reduced gender inequality. In addition, South African countries may face challenges, such as high levels of poverty, income inequality, and gender-based violence. These factors and the persistence of EP can further exacerbate the existing gender inequality Nguyen and Su [4].
6. Conclusion
Accessing modern energy services is crucial for achieving a fundamental level of comfortable life. Currently, there exists a significant disparity in accessing and utilizing these clean energy services, with the poorest 3 billion individuals experiencing severe EP, while the wealthiest 1 billion consume a disproportionately large portion. In this background, this study utilized panel data covering 116 countries between 2012 and 2019 to analyze spatial–temporal features of the spatial relationship between EP and social factors. We conducted the spatial autocorrelation analysis to assess the synergy and tradeoff relationship between EP and social factors, thereby analyzing the temporal changes and spatial differences of this spatial autocorrelation. After that, we considered the four EP indicators for comprehensive evaluation of synergy and tradeoff relationship and adopted three different spatial weight matrices to ensure result reliability. The primary findings are summarized below.
Some social factors, including life expectancy at birth, access to immunization, CO2 emission, and forest area, share spatial synergy relations with EP. These synergy relationships are manifested in H–H and L–L clusters; that is, countries with lower energy access and surrounded by lower values of the abovementioned social factors were located in the low-income countries, including South Africa and Southeast Asia, while the regions with higher energy access are surrounded by the higher values of abovementioned social factors were located in the higher-income countries, such as European countries. In tradeoff relations, EP and some social factors, including infant mortality rate, prevalence of undernourishment, forest rents, and gender inequality, are presented in H–L and L–H clusters, having negative spatial autocorrelation effect, that is to say, countries, particularly for European countries, with the higher energy access tend to be adjacent to the countries with the better condition of social factors, while countries, especially for South Africa and Southeast Asia, having insufficient energy access are adjacent to countries with worse condition of social factors. Among the tradeoff and synergy relationships, synergy relationships, such as H–H and L–L clusters, indicated the dynamic pattern of progressively declining, except for the CO2 emissions. Meanwhile, all of the tradeoff relationships, including L–H and H–L clusters, witnessed a decreasing trend.
The findings suggest a gradual improvement in the uneven distributions of spatial autocorrelation between EP and social factors. These findings provide solid evidence on which to explore the influence of EP on social factors considering spatial heterogeneity. Meanwhile, even though the tradeoff/synergy relations between EP and social factors were not fixed, there still exists a significant spatial imbalance among different regions. More focus has better put on South Africa and Southeast Asia for improving their energy access, and further uplifting their social development indicators. This could involve investments in infrastructure and renewable energy sources to enhance energy access and promote sustainable development. In addition, higher-income countries tend to have better social conditions and higher energy access and lower-income countries experience the opposite trend. The financial aid, technical assistance, and capacity-building support could be proposed to bridge the gap between different regions.
This study has some limitations that need to be improved in future research. First, because of the data limitation, this study utilized the panel data of 116 countries from 2012 to 2019. Future research could incorporate updated data to capture the most recent spatial autocorrelation of EP and social factors. Second, the Bivariate local Moran index utilized in this paper has limitations in capturing the causal relationship between the factors, which is crucial for policymakers to determine the critical factors to address the EP and social issues effectively. Future research could construct spatial econometric models to provide a more accurate estimation of the causality direction between EP and social factors by considering spatial dependence.
Conflicts of Interest
The authors declare that they have no conflicts of interest.
Acknowledgments
The authors would like to express their sincere thanks to the financial support from the Research Institute for Advanced Manufacturing (RIAM) of the Hong Kong Polytechnic University (project code: 1-CDK2, Project ID: P0050827). The work described in this paper was also supported by the grant from the Research Committee of the Hong Kong Polytechnic University under student account code RK3E, a grant from Research Institute for Advanced Manufacturing (RIAM), the Hong Kong Polytechnic University (1-CD9G, Project ID: P0046135), and the Research Grant for Faculty Award in Research and Scholarly Activities—Outstanding Young Researcher (Individual) 2023, Faculty of Engineering, the Hong Kong Polytechnic University.
Open Research
Data Availability
The data are made available in the supplementary material of this manuscript.


