Numerical Study and Theoretical Model of Shaped Charge Jet Penetrating Into Thick-Walled Target With Following Velocity
Abstract
In order to investigate the effect of the carrier’s initial velocity on the jet’s damage power, this paper conducted the numerical simulation of a jet penetrating thick-walled targets at various following velocities (the carrier’s initial velocity). For large stand-off distance (D), the influence on jet formation parameters was revealed under different following velocities (ranging from 0 to 1000 m/s), and the jet’s penetration performances were analyzed at various stand-off distances (ranging from 3D to 10D). Then, taking 3D as an example, the study investigated the influence mechanism of the coupling between following velocity and impact angle (ranging from −60° to 60°) on jet penetration performance. The results show that an increase in the following velocity causes the jet to bend and break at an earlier time. The following velocity has a minimal effect on jet tip velocity. Additionally, the lateral displacement is linearly correlated with stand-off distance. For normal penetration, the jet penetration depth decreases exponentially as the following velocity increases at the same stand-off distance. Especially, the penetration depth decreases by over 80% when the following velocity exceeds 600 m/s, and a further increase in the following velocity has a minimal effect on jet penetration depth. A greater jet penetration depth was achieved for the climbing-oblique penetration (COP) than the diving-oblique penetration (DOP) due to an increase in dynamic stand-off distance. Finally, the ratio of oblique to normal penetration depth for a jet with varying following velocities was derived based on the theory of steady-jet and hole expansion, and its accuracy was verified.
1. Introduction
Precision guided munitions (PGM) are becoming increasingly vital as a weapon for destroying high-value and fortified targets in modern warfare. To enhance the survivability and damage power of the warhead, the shell protection materials of the warhead are continuously upgraded and thickened. Thus, the traditional high-speed fragments are inadequate for satisfying the strategic requirements for destroying incoming missiles [1]. Due to characteristics such as high temperature, rapid speed, and strong directionality, the shaped charge jet is usually used to attack heavily protected targets such as tank armor, fortifications, and concrete defense works [2–4]. Therefore, the interception and destruction of incoming thick-walled targets using shaped charge jets are gradually gaining wider attention in the field of antimissile defense.
The investigation of penetration performance of shaped charge jets was explored through experimental, numerical, and theoretical studies, which highlighted the crucial role of jet formation in determining its penetration capabilities [5, 6]. The lateral velocity causes the jet to bend and break, greatly lowering its penetration performance [7]. Currently, the research on jet formation mainly focuses on static detonation and the influence of asymmetrically shaped charges or eccentric initiation on jet formation [8–10].
In addition, the impact angle is also crucial in determining the penetration performance of the jet and the achievement of strategic objectives. By virtue of the simulation technique, Cao, Zhang, and Qiao [11] found that the jet has better penetration performance when normally penetrating a stationary target compared to obliquely penetrating a moving target. For penetrating a moving target, the penetration depth of the jet significantly decreases as the moving velocity of the target increases, due to the energy loss during penetration. Tan et al. [12] derived the calculation formula of the final crater radius on the thin target for oblique penetration based on the Szendrei hypothesis which was validated through experiments.
Held et al. [13, 14] proposed an analytical model for determining the dynamic penetration depth of inclined shaped charges. The theoretical formula considers the angle between the axis of the shaped charge and the missile, as well as the various inclinations of the target. Wang et al. [15] established a dynamic penetration model of the jet according to the penetration channel of the jet into the static target. Jia et al. [16] developed a theoretical model for calculating the jet’s penetrating into a moving target based on the virtual origin method. This model takes into account the disturbance caused by the moving target on the jet penetration and accurately predicts the depth and shape of the hole. Yadav [17] studied the after-penetration effect of jet impact on the moving target and established a theoretical model. This model assumes a constant velocity for the moving target and considers its effect in the form of an equivalent length. Experimentally, by accelerating shaped charges to 150 m/s (or 200 m/s), Golesworthy [18] investigated the effect of velocity on jet penetration depth and impact diameter. Jia et al. [19] conducted dynamic jet penetration tests on a moving target using a rocket sled as the launching device and validated the tested results with a theoretical model.
However, there exists the following velocity perpendicular to the carrier’s movement direction owing to the carrier’s movement for the shaped charge warhead. Limited reports have investigated the influence of following velocity on the jet formation. Besides, current numerical simulations and theoretical analyses have primarily focused on the reverse characterization of penetration performance by fixing the shaped charge and accelerating the target, while ignoring the influence of the carrier’s initial velocity. Although existing experimental methods can impart initial velocities to shaped charge warheads, it is difficult to precisely control the missile-target encounter condition, which poses a vast challenge to study and validate the penetration mechanism.
In this work, the penetration performance of the jet was investigated by applying the following velocity to the warhead and adjusting the impact angle. First, the critical following velocity and stand-off distance for jet deflection were determined. The effects of the following velocity on jet shape, tip velocity, and lateral displacement were analyzed. Next, the change in penetration depth was explored at various following velocities and impact angles, and the difference in penetration performance between climbing-oblique penetration (COP) and diving-oblique penetration (DOP) modes is discussed. Finally, the depth ratio of oblique penetration to normal penetration at different following velocities was derived based on the theory of steady-jet and hole expansion. As a result, the theoretical depth of oblique penetration was obtained indirectly, providing a valuable reference for future investigations.
2. Simulation Model and Validation of Effectiveness
2.1. Simulation Model
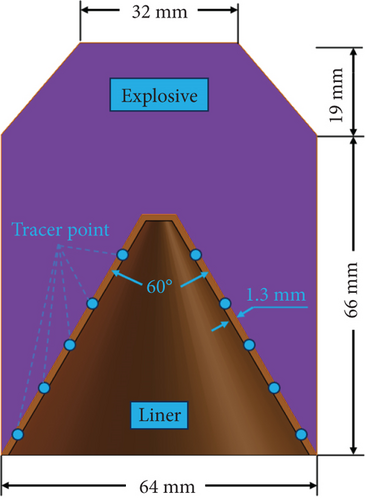
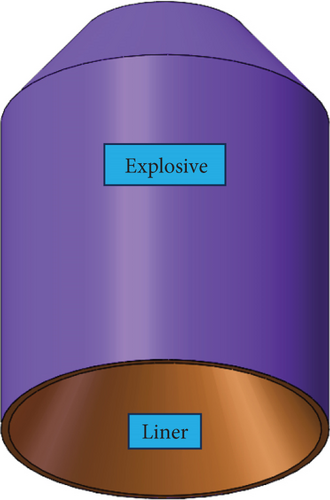
In this research, we studied the jet formation at different following velocities and the penetration performance at various impact angles. The simulation model consists of four parts: air, explosive, liner, and target, as shown in Figure 1(a). The structure of the shaped charge is illustrated in Figures 1(b) and 1(c). The thickness of the liner is 1.3 mm, with a diameter of 64 mm and a cone angle of 60°. The length of the charge is 86 mm, and the diameter is 64 mm.
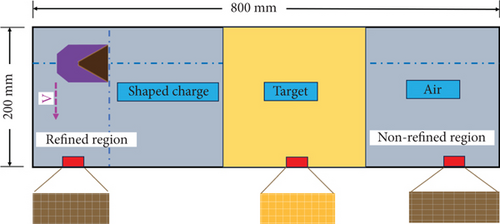
Numerical calculations are carried out in the air domain. A considerable amount of time is consumed for the traditional ALE algorithm due to the large number of air domain grids. Although the Structured Arbitrary Lagrangian–Eulerian (S-ALE) algorithm follows the same computational procedure as the traditional ALE algorithm, the S-ALE algorithm has some advantages over the traditional ALE algorithm, including easy mesh generation, high computational efficiency, and robust computation ability. This lies in the difference that the S-ALE algorithm automatically generates ALE meshes through keyword settings (“ALE_STRUCTURE_MESH”). Therefore, the S-ALE algorithm is adopted in this study to generate the air meshes. In addition, the explosive and liner are filled and initial velocities are applied using keyword settings (“INITIAL_VOLUME_FRACTION_ GEOMETRY”). The explosive is detonated in the center, and nonreflecting boundary conditions are applied at the outer air domain boundaries. The unit system of g-cm-μs is used in the numerical simulation model.
2.2. Material Model and Parameters
where C, S1, S2, S3, and a are the unitless coefficients. γ0 is the unitless Gruneisen gamma which is defined γ0 = ρ/ρ0 − 1. ρ0 is the initial density. E is the initial internal energy.
| Polyblack explosive-2 | ρ (g·cm−3) | D (cm·μs−1) | A (GPa) | B (GPa) | R1 | R2 | ω |
|---|---|---|---|---|---|---|---|
| 1.891 | 0.911 | 7.7828 | 0.0707 | 4.2 | 1.0 | 0.3 | |
| Pcj (GPa) | E0 (kj·cm−3) | ||||||
| 0.42 | 0.105 | ||||||
| 1006 mild steel | ρ (g·cm−3) | G (GPa) | A (GPa) | B (GPa) | n | c | m |
| 7.85 | 81.8 | 350 | 275 | 0.36 | 0.022 | 1.0 | |
| Tr (K) | C (m·s−1) | γ0 | S1 | V0 | |||
| 1811 | 4569 | 2.17 | 1.49 | 1.0 | |||
| 45# steel | ρ (g·cm−3) | G (GPa) | A (GPa) | B (GPa) | n | c | m |
| 7.85 | 75.9 | 507 | 320 | 0.28 | 0.064 | 1.06 | |
| Tr (K) | C (m·s−1) | γ0 | S1 | V0 | |||
| 1793 | 4578 | 1.67 | 1.33 | 1.0 |
2.3. Mesh Size Effect
We conducted numerical simulations with different mesh sizes, as shown in Table 2. Besides, we performed four sets of simulations to investigate the formation and penetration performance of the jet. The dimensions of the refined regions were 0.08 × 0.08 × 0.08 cm, 0.1 × 0.1 × 0.1 cm, 0.15 × 0.15 × 0.15 cm, and 0.2 × 0.2 × 0.2 cm, while the nonrefined regions had dimensions of 0.16 × 0.08 × 0.08 cm, 0.2 × 0.1 × 0.1 cm, 0.3 × 0.15 × 0.15 cm, and 0.4 × 0.2 × 0.2 cm.
| Mesh type | Refined region (cm) | Nonrefined region (cm) | Number of ALE mesh | Number of Lagrange mesh | Number of all mesh | Computation time (hour) | Research |
|---|---|---|---|---|---|---|---|
| (1) | 0.08 × 0.08 × 0.08 | 0.16 × 0.08 × 0.08 | 5781447 | / | 5781447 | 90 | Jet formation (10D) |
| (2) | 0.1 × 0.1 × 0.1 | 0.2 × 0.1 × 0.1 | 3013131 | / | 3013131 | 15 | |
| (3) | 0.15 × 0.15 × 0.15 | 0.3 × 0.15 × 0.15 | 864171 | / | 864171 | 6 | |
| (4) | 0.2 × 0.2 × 0.2 | 0.4 × 0.2 × 0.2 | 387816 | / | 387816 | 2 | |
| (1) | 0.08 × 0.08 × 0.08 | 0.16 × 0.08 × 0.08 | 3476844 | 1614544 | 5091388 | 130 | Penetration performances (3D) |
| (2) | 0.1 × 0.1 × 0.1 | 0.2 × 0.1 × 0.1 | 1808001 | 810000 | 2608001 | 18 | |
| (3) | 0.15 × 0.15 × 0.15 | 0.3 × 0.15 × 0.15 | 533052 | 257481 | 790533 | 8 | |
| (4) | 0.2 × 0.2 × 0.2 | 0.4 × 0.2 × 0.2 | 233376 | 101250 | 334626 | 3 |
Figure 2 shows the jet formation and jet tip velocity under different mesh sizes. For mesh sizes (1) and (2), not only is the jet formation process highly similar, but the jet tip velocities are also close to each other. However, for mesh sizes (3) and (4), the jet experiences a break during its motion. Especially with mesh size (4), the jet no longer forms an effective penetration. Compared to the tip velocity with mesh size (1), the tip velocities for (2), (3), and (4) have decreased by 0.96%, 6.56%, and 16.62%, respectively.
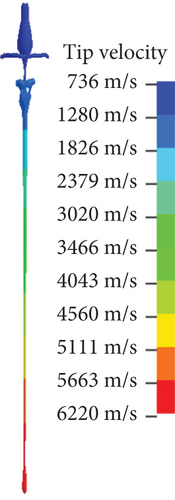
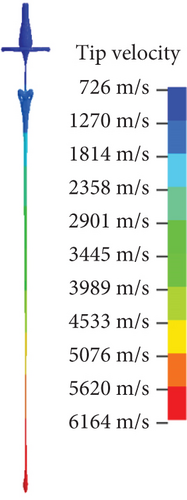

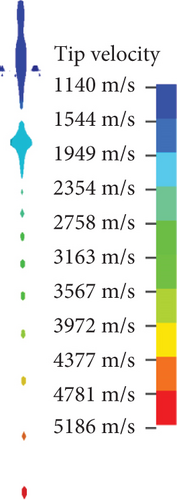
Figure 3 shows the penetration depth and hole diameter of the jet under different mesh sizes, with the computational results detailed in Table 3. Compared to the penetration depth (1), the penetration depths (2), (3), and (4) exhibit decreases of 1.64%, 35.81%, and 58.74%, respectively.


| Mesh type | Tip velocity (m/s) | Error | Penetration depths (cm) | Error |
|---|---|---|---|---|
| (1) | 6189 | / | 18.88 | / |
| (2) | 6164 | 0.96% | 18.57 | 1.64% |
| (3) | 5812 | 6.56% | 12.12 | 35.81% |
| (4) | 5186 | 16.62% | 7.6 | 58.74% |
In summary, while both mesh sizes (1) and (2) yield satisfactory simulation results, mesh size (1) clearly requires more computational time. Therefore, taking into account the trade-off between time cost and accuracy, mesh type (2) was used in this study.
2.4. Numerical Result Verification
2.4.1. Stationary Target
The accuracy of penetrating into a stationary target for two jets with 50 and 150 mm stand-off distances was verified via numerical calculation [20]. The maximum error of penetration depth calculated from the numerical calculation and test results is 2.4%, as shown in Table 4. Furthermore, it can be seen from the postpenetration profile of the target that the hole sizes are almost identical (Figure 4).
| Stand-off distance | Test results | Numerical calculations | Error |
|---|---|---|---|
| 50 mm | 168 mm | 165 mm | 1.8% |
| 150 mm | 210 mm | 205 mm | 2.4% |
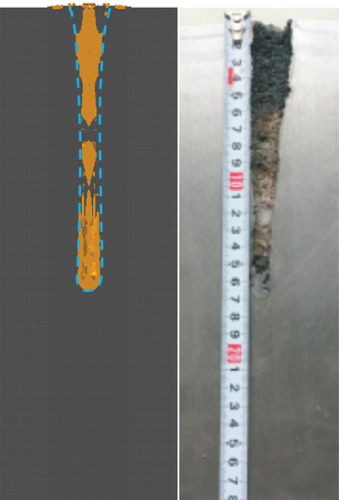
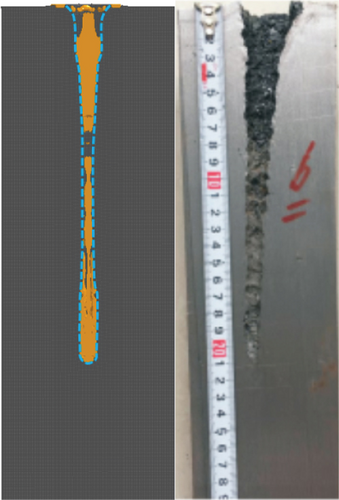
2.4.2. Moving Target
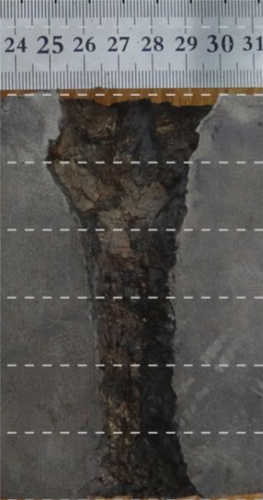
To ensure the accuracy of the numerical calculation of the jet penetrating into a moving target, we verified the test results in Reference [19] by numerical simulation. The shaped charge warhead is stationary, and the target moves at a velocity of 150 m/s. As can be observed from Figure 5, the hole shape obtained from numerical calculation is approximately the same as those obtained from the test. Experimentally, the initial aperture on the test target formed by the jet penetration is approximately 35 mm, and the final aperture is approximately 27 mm, whereas, the corresponding numerical results on the test target are 33 and 25 mm, respectively. The initial and final aperture errors are 5.7% and 7.4%, respectively. Therefore, the calculation accuracy and stability of penetrating the moving target can be ensured by numerical simulation.

2.4.3. Jet Formation Verification
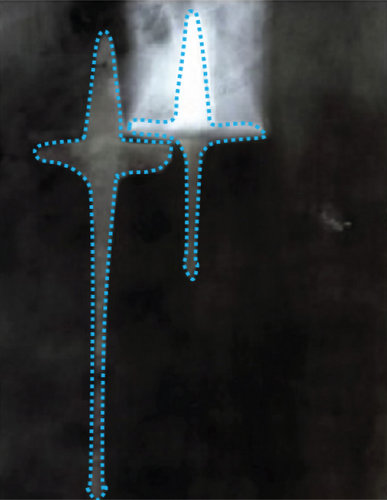
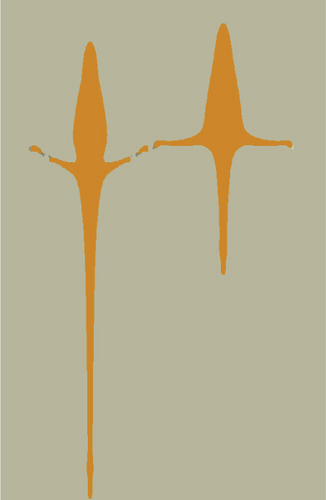
The prerequisite for studying the influence of following velocities on jet formation is to ensure the accuracy of the jet formation in the simulation results. In this work, the numerical calculation of the jet formation process in Reference [21] has been performed. At t = 26μs and t = 26μs, Figure 6 shows the comparison of images between pulse X-ray photography and the numerical calculations. The test results are given in Table 5. Evidently, the maximum error of jet length, jet diameter, and tip velocity is all less than 4.5%. The simulated shape of the jet is in good agreement with the experimental results. Therefore, numerical simulations are highly effective in studying jet formation under different engineering conditions.
| Parameters | Test results | Numerical calculations | Error |
|---|---|---|---|
| Length of jet at 26 μs (mm) | 41.1 | 40.6 | 1.2% |
| Length of jet at 42 μs (mm) | 77.6 | 76.3 | 1.4% |
| Jet tip velocity at 42 (μs/(m∙s−1)) | 5276.2 | 5161.0 | 2.2% |
| Jet diameter at 42 μs (mm) | 4.18 | 4.00 | 4.5% |
3. Jet Formation
3.1. Jet Shape
The shape of the flying jet is an essential factor affecting penetration performance. The better-collimated jet can often achieve a greater destructive power (i.e., deeper penetration) than the broken jet. Therefore, it is crucial to explore the jet shape at different following velocities. Typically, the speed of missile carriers ranges from 2 to 3 Mach, which corresponds to 680–1020 m/s. Therefore, the following velocities are set for the carrier: 0, 200, 400, 600, 800, and 1000 m/s.
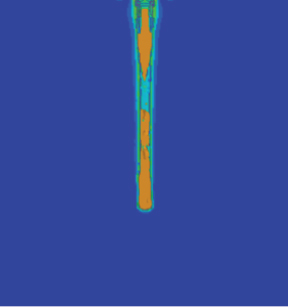
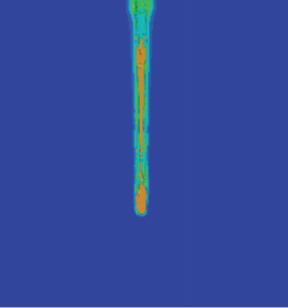
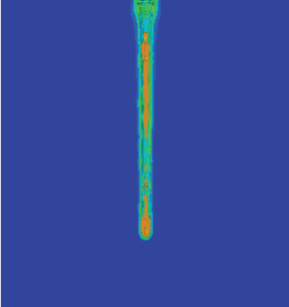
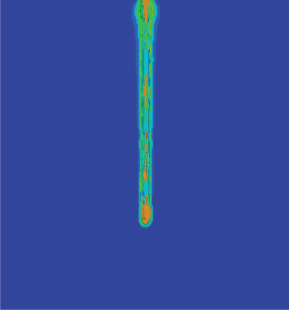
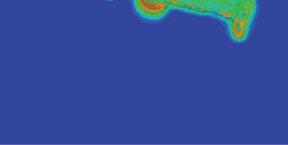
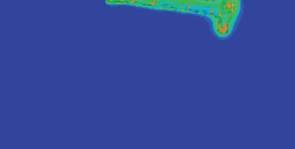
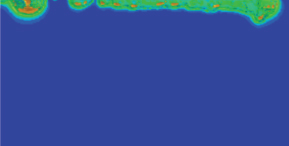
Table 6 presents the jet shapes at various following velocities and stand-off distances. From the perspective of jet breakup, the influence of following velocity on the jet shape is not obvious for the stand-off distance less than 5D (D is the stand-off distance). Thus, the jet maintains a good degree of collimation without being broken. However, the jet tip with greater following velocity is broken earlier. Notably, the fracture length increases significantly for the stand-off distances greater than 8D. For example, in a case of the stand-off distance is equal to 10D and the following velocity exceeds 800 m/s, almost one-third of the jet is broken, severely affecting subsequent jet penetration. Indeed, the following velocity causes the jet to deflect and bend during movement. The main reason for this is the increasing drag encountered by the jet due to the following velocity. The jet would stretch and break when subjected to lateral forces. Correspondingly, a stretched and fractured jet is more susceptible to lateral forces so as to be deflected and bent.
| Stand-off distances | Following velocities | Jet formation |
|---|---|---|
| 3D | 0 m/s |  |
| 3D | 200 m/s |  |
| 3D | 400 m/s |  |
| 3D | 600 m/s |  |
| 3D | 800 m/s |  |
| 3D | 1000 m/s |  |
| 5D | 0 m/s |  |
| 5D | 200 m/s |  |
| 5D | 400 m/s |  |
| 5D | 600 m/s |  |
| 5D | 800 m/s |  |
| 5D | 1000 m/s |  |
| 8D | 0 m/s |  |
| 8D | 200 m/s |  |
| 8D | 400 m/s |  |
| 8D | 600 m/s |  |
| 8D | 800 m/s |  |
| 8D | 1000 m/s |  |
| 10D | 0 m/s |  |
| 10D | 200 m/s |  |
| 10D | 400 m/s |  |
| 10D | 600 m/s |  |
| 10D | 800 m/s |  |
| 10D | 1000 m/s |  |
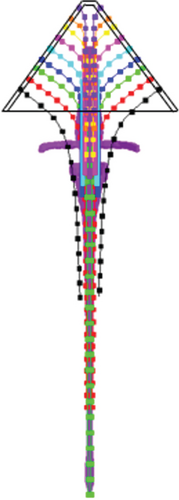
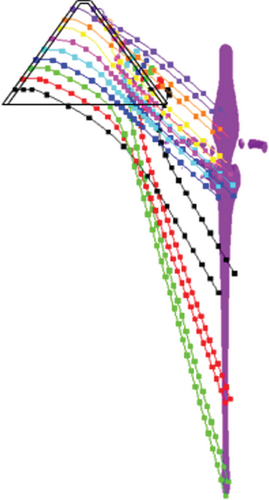
The jet shape was further analyzed using tracer particle techniques to clearly reveal the influence mechanism of following velocities on the jet shape. Tracer particles that follow the motion of the material help to provide physical information such as position, velocity, and stress at specific points within the material. Especially, the use of tracer particle techniques for the ALE multimaterial group is beneficial to gather more node information. The positions of tracer particles within the liner are shown in Figure 1. Because of the influence of following velocity, tracer particles with the same initial height fail to exhibit a symmetrical distribution along the jet axis after some time but rather show a height difference. This may account for jet tip deviation.
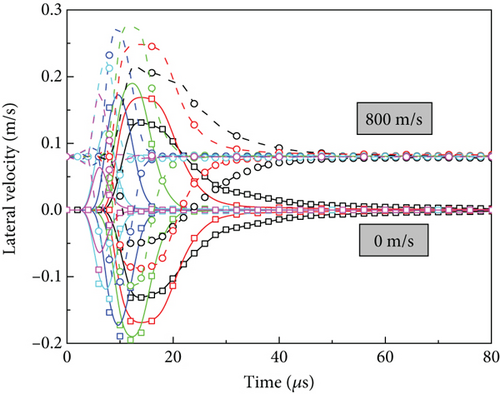
Figure 7 shows the trajectories of tracer particles at different following velocities. When the following velocity reaches 800 m/s, the tracer particles no longer distribute symmetrically along the initial axis, instead exhibiting a parabolic motion in the direction of the following velocity. Figure 8 shows the variation of lateral velocity of the tracer particles at different times, corresponding to the following velocities of 0 and 800 m/s, respectively. Interestingly, the evolutionary pattern of lateral velocity with time is the same for the two following velocities mentioned above. The lateral velocity curves are symmetrical to the horizontal line at v = 0 m/s for the following velocity of 0 m/s. However, the lateral velocity curves remain symmetrical to the horizontal line at v = 800 m/s when the following velocity is 800 m/s, although the lateral velocity curves are not symmetrical to v = 0 m/s. The lateral velocity eventually stabilizes around 800 m/s. This may also contribute to good jet cohesiveness and low deflection.
3.2. Jet Tip Velocity and Lateral Displacement
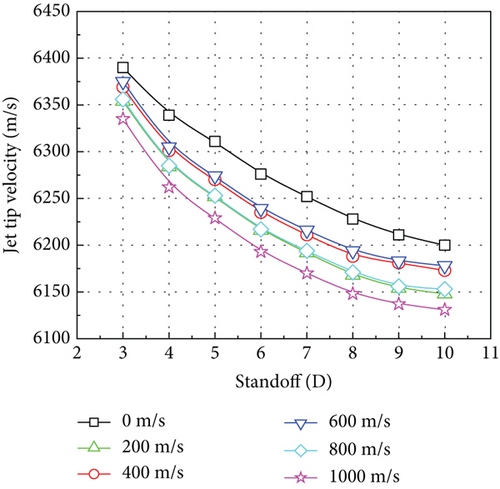
The tip velocity of the jet is also one of the main factors affecting its damage power. Figure 9 shows the tip velocity at various following velocities and stand-off distances. Overall, a rise in both the stand-off distance and the following velocity results in a decline in the jet tip velocity. The tip velocity of the jet is 6131 m/s when the following velocity is 1000 m/s and the stand-off distance is 10D. The magnitude of the jet tip velocity is decreased by only 1.11% due to the following velocity changing from 0 to 1000 m/s. Therefore, the effect of the following velocity on the jet tip velocity can be considered negligible.
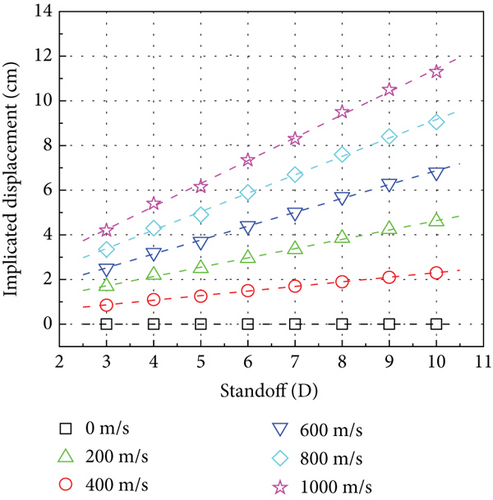
The slope of the lateral displacement curve is the lateral velocity of the jet. Based on Equation (5)–Equation (10), the lateral velocity of the jet can be approximated as the following velocity of shaped charge, which is useful for quickly determining the penetration position of the jet on the target.
4. Damaging Effect
4.1. Normal Penetration
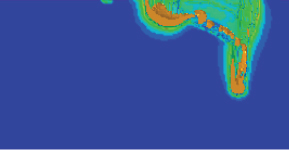
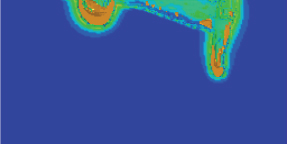
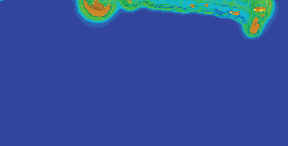
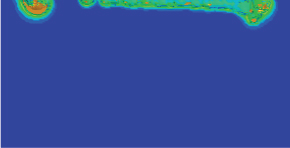

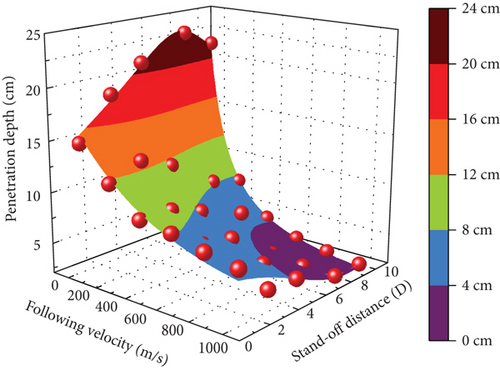
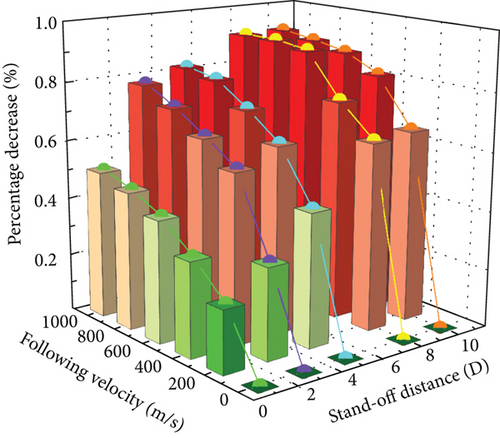
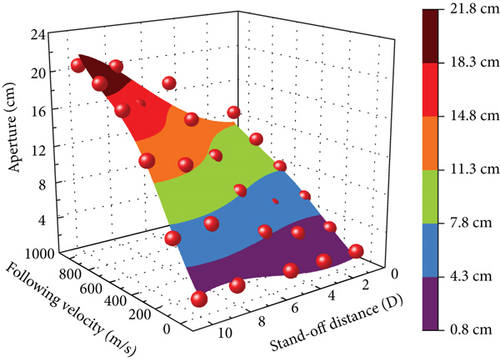
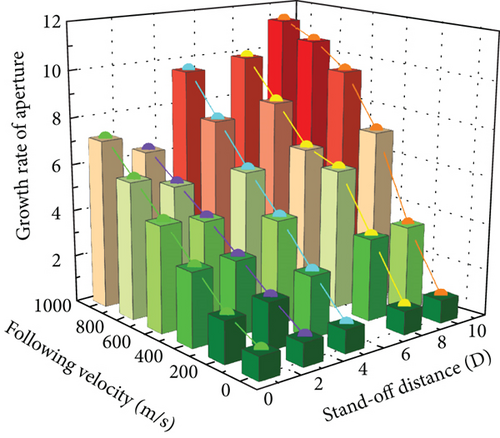
The penetration depth of the jet is significantly affected by the following velocity. For the same stand-off distance, the jet penetration depth decreases exponentially as the following velocity increases. The maximum reduction in penetration depth has reached the maximum at a following velocity of 200 m/s. The reduced magnitude in penetration depth exceeds 80% for the following velocity over 600 m/s. As the following velocity is further enhanced, the change in jet penetration depth becomes insignificant.
In addition, the control effect of stand-off distance on the jet penetration depth is weakened as the following velocity increases. The penetration depth first increases and then decreases when the following velocity is below 200 m/s. However, the penetration depth and the following velocity have an opposite relationship when the following velocity exceeds 200 m/s. This may be because the jet’s elongation reduces penetration depth by lowering stored energy per unit length of the jet [16].
The hole diameter increases monotonically with the following velocity, contrary to the trend of the penetration depth. Compared to the hole diameter at 0 m/s, the hole diameter is boosted by about 9.3 times due to the following velocity changing from 0 to 1000 m/s. The effective length of the jet in motion is further elongated owing to the increase in the stand-off distance, thus resulting in a rising trend in the hole diameter with the following velocity. Nevertheless, an increase in hole diameter means that more energy is consumed for opening the hole, reducing the penetration depth.
4.2. Oblique Penetration
The impact angle is crucial in determining the jet’s destructive capability. Accurate calculation of impact angle can be regarded as a reference for designing more efficient tracking and interception systems, thereby improving the interception capability and hit rates of missiles or aircraft. Understanding the impact angle provides critical parameters related to input data for modeling the interception process. It is convenient for optimizing interception strategies and practical operations. Therefore, the investigation of the effect of impact angle on the penetration performance has considerable engineering value.
In actual warhead-to-target engagement scenarios, the relative motion between the target and the warhead may involve a variety of angles. Extreme angles, such as near-perpendicular impacts close to 90°, are relatively rare in actual combat situations. Therefore, focusing on impact angles within the range of −60° to 60° can better simulate actual combat conditions and provide guidance for the design and evaluation of weapon systems.
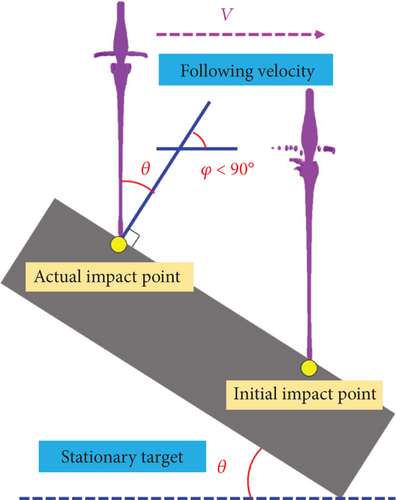
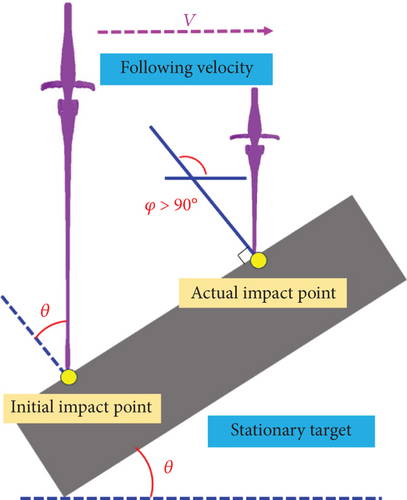
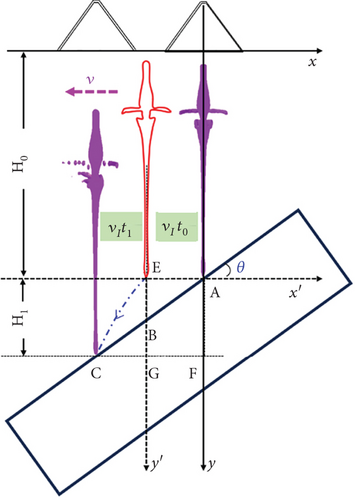
In this section, the simulation of jet penetration with different following velocities and different impact angles is carried out by taking the stand-off distance 3D as an example. The model is shown in Figure 13. Based on the intersection angle between the following velocity and the target’s normal vector, the jet’s mode of penetrating into an oblique target can be classified into two types. Detaily, we define the penetration case with the intersection angle φ less than 90° as a DOP. In this mode, the jet undergoes a downward “smearing” effect along the inclination of the target. On the contrary, a penetration case with an intersection angle φ greater than 90° is a COP mode. In this mode, the jet experiences a “smearing” upward effect along the inclination of the target. The jet penetration was simulated at six following velocities (0, 200, 400, 600, 800, and 1000 m/s) and seven impact angles θ (−60°, −40°, −20°, 0°, 20°, 40°, and 60°). Some simulation results are shown in Figure 14.
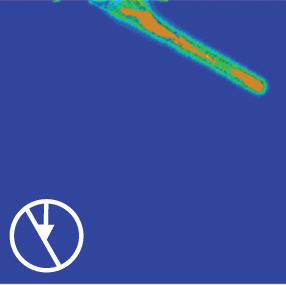
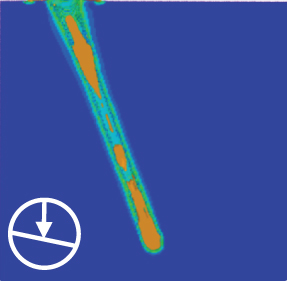
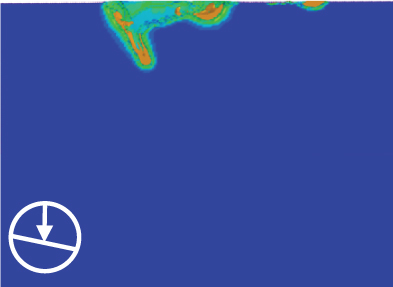
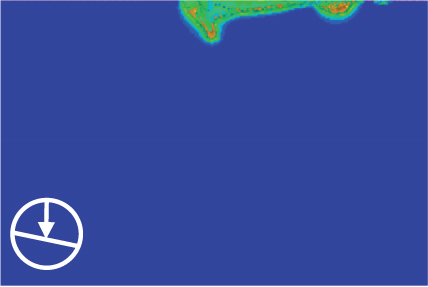
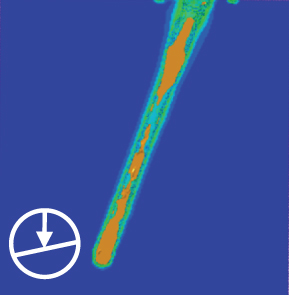
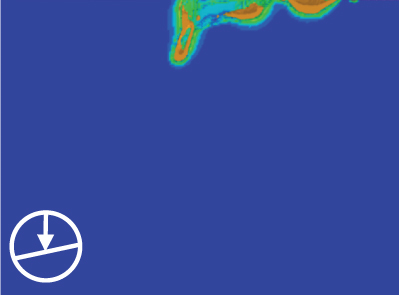
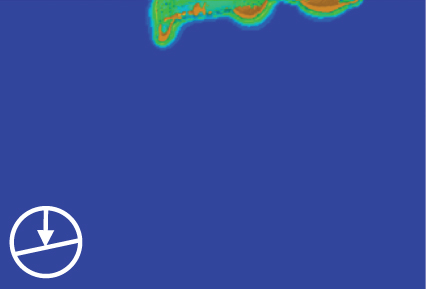

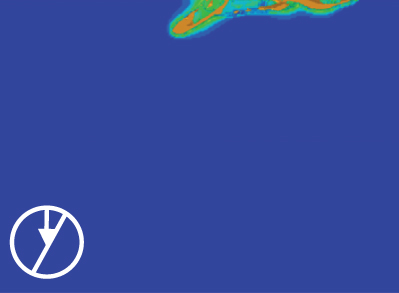
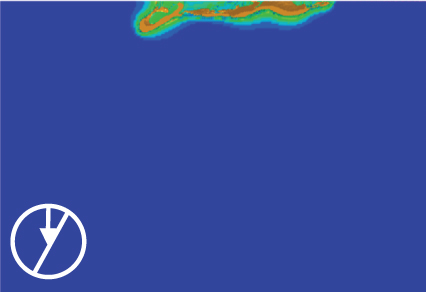
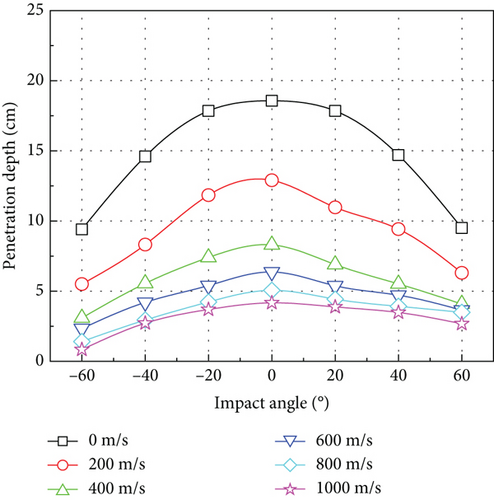
The curves of jet penetration depth at different following velocities and impact angles are shown in Figure 15. In both DOP and COP, a decrease in penetration depth with a rise in impact angle is consistent with the case observed in normal penetration. For the same impact angle, the penetration depth of the jet decreases exponentially as the following velocity increases. Furthermore, the penetration depth in DOP and COP is nearly the same when the following velocity is 0 m/s. The penetration depth is reduced by approximately 50% when the impact angle evolves from 0° (i.e., normal penetration) to 60°. Figure 15(b) shows the penetration depth ratio of DOP and COP. As the impact angle increases, the penetration depth in the COP is significantly deeper than that in the DOP, and the effect becomes more pronounced as the following velocity increases. At a following velocity of 1000 m/s and an impact angle of 60°, the penetration depth ratio of COP and DOP peaks at approximately 3.2.
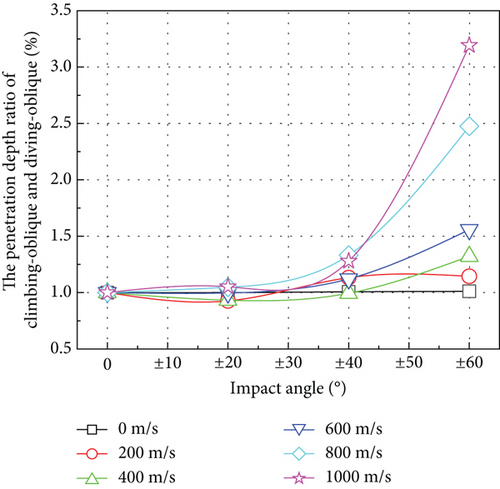
The main reason for this is that the jet fails to impact the target at the initial point corresponding to the stand-off distance due to the following velocity. The impact point is distributed to both sides of the initial impact point, resulting in a change in the stand-off distance of the jet. The actual impact point is positioned below the ideal impact point corresponding to the initial stand-off distance in the case of DOP, as shown in Figure 13. This situation is equivalent to an indirect increase in the jet’s stand-off distance. Here, we defined the actual stand-off distance of the jet as the dynamic stand-off distance. The dynamic stand-off distance varies with the following velocity and impact angle. In the case of dive oblique penetration, the dynamic stand-off distance is greater than the initial stand-off distance, but in the case of COP, the reverse is true. According to Section 4.1, the jet no longer undergoes a significant “stand-off distance” effect under the influence of the following velocity when the stand-off distance is greater than 1D. Instead, as the stand-off distance increases, the penetration depth of the jet gradually decreases. This means that the penetration depth ratio DOP to COP is greater than 1. However, when the following velocity is 200 or 400 m/s, and the impact angle is 20°, the penetration depth ratio is less than 1. This is because the penetration depth of the jet is still affected by the “stand-off distance” effect at that velocity. The optimal stand-off distance of the jet is about 3D at that velocity, so the penetration depth of COP may be less than that of DOP. Overall, the effect on the penetration depth of the jet becomes more obvious as the dynamic stand-off distance increases. With increasing impact angle and stand-off distance, the penetration depth ratio of DOP and COP goes up.
5. Theoretical Approach
5.1. Dynamic Stand-off Distance
According to Section 4.2, for the same impact angle, the penetration depth of diving-oblique and climbing-oblique is significantly different. The reason can be mainly attributed to the influence of dynamic stand-off distance. Indeed, the dynamic stand-off distance changes with the following velocity or impact angle.
5.2. Aperture
5.3. Result Analysis
f(t) and g(vI, H) can be obtained from Section 3.2 and Section 4.1. By submitting f(t), g(vI, H), following velocity (vI), and impact angle (θ) into Equation (28), the penetration depth at various following velocities and impact angles can be calculated as shown in Table 7. The relative error between the theoretical calculation and the numerical calculation is not greater than 20%, demonstrating excellent accuracy. However, the model oversimplifies the jet penetration process, and further research is needed to improve and optimize the model.
| Impact angles (°) | Following velocities (m/s) | Dynamic stand-off distance (cm) | Hole diameter ratio | Theoretical calculation (cm) | Numerical calculation (cm) | Relative error |
|---|---|---|---|---|---|---|
| 20 | 200 | 12.80 | 0.998 | 11.95 | 10.49 | 13.91% |
| −20 | 200 | 12.81 | 0.998 | 12.02 | 11.79 | 1.94% |
| 20 | 400 | 8.83 | 0.994 | 8.01 | 7.11 | 12.65% |
| −20 | 400 | 8.76 | 0.994 | 8.09 | 7.58 | 6.72% |
| 20 | 600 | 7.21 | 0.987 | 5.64 | 5.16 | 9.30% |
| −20 | 600 | 6.77 | 0.987 | 5.50 | 5.25 | 4.76% |
| 20 | 800 | 5.34 | 0.978 | 4.51 | 4.18 | 7.32% |
| −20 | 800 | 4.78 | 0.978 | 4.39 | 4.23 | 3.89% |
| 20 | 1000 | 4.48 | 0.968 | 4.08 | 4.10 | 0.75% |
| −20 | 1000 | 3.64 | 0.968 | 3.31 | 3.71 | 10.81% |
| 40 | 200 | 12.80 | 0.995 | 7.51 | 6.33 | 18.64% |
| −40 | 200 | 12.81 | 0.995 | 9.76 | 8.32 | 17.39% |
| 40 | 400 | 8.87 | 0.980 | 6.36 | 5.71 | 11.38% |
| −40 | 400 | 8.71 | 0.980 | 6.14 | 5.59 | 9.84% |
| 40 | 600 | 7.18 | 0.958 | 5.27 | 4.73 | 11.58% |
| −40 | 600 | 6.61 | 0.958 | 4.51 | 3.94 | 14.46% |
| 40 | 800 | 5.75 | 0.930 | 4.10 | 4.04 | 1.30% |
| −40 | 800 | 4.37 | 0.930 | 3.11 | 3.10 | 0.15% |
| 40 | 1000 | 5.11 | 0.898 | 3.52 | 3.53 | 0.45% |
| −40 | 1000 | 3.01 | 0.898 | 2.27 | 2.59 | 12.35% |
| 60 | 200 | 12.79 | 0.992 | 6.34 | 5.65 | 12.29% |
| −60 | 200 | 12.78 | 0.992 | 6.32 | 5.51 | 15.11% |
| 60 | 400 | 8.94 | 0.969 | 4.23 | 3.77 | 12.20% |
| −60 | 400 | 8.59 | 0.969 | 4.06 | 3.58 | 13.40% |
| 60 | 600 | 7.54 | 0.933 | 3.52 | 3.47 | 1.44% |
| −60 | 600 | 6.22 | 0.933 | 2.71 | 2.51 | 7.96% |
| 60 | 800 | 6.69 | 0.889 | 3.05 | 3.49 | 12.60% |
| −60 | 800 | 3.43 | 0.889 | 1.52 | 1.48 | 3.10% |
| 60 | 1000 | 6.65 | 0.838 | 2.79 | 2.67 | 4.27% |
| −60 | 1000 | 1.46 | 0.838 | 0.68 | 0.80 | 15.00% |
6. Conclusion
- 1.
The influence of following velocity on jet shape is not obvious for the stand-off distance less than 5D. However, the jet with greater following velocity is more susceptible to bend and fracture when the stand-off distance is greater than 8D.
- 2.
For the same stand-off distance, the jet penetration depth decreases exponentially as the following velocity increases. The reduced magnitude in penetration depth exceeds 80% for the following velocity over 600 m/s.
- 3.
With an increase in impact angle, the penetration depth in the COP is significantly deeper than that in the DOP, and the effect becomes more pronounced as the following velocity increases.
- 4.
The error between the theoretical calculation and the numerical calculation is less than 20%, demonstrating excellent accuracy. However, further improvement on the established model will be carried out in future studies due to the simplification of the jet’s penetration and hole expansion process.
Conflicts of Interest
The authors declare no conflicts of interest.
Funding
This work was supported by the National Natural Science Foundation of China (Grant No. 11672278).
Acknowledgments
This work was supported by the National Natural Science Foundation of China (Grant No. 11672278).
Open Research
Data Availability Statement
Some or all data, models, or codes that support the findings of this study are available from the corresponding author upon reasonable request.


