A Design Method for Redundant Microthruster Layout With Allocation Error
Abstract
The microthruster is generally chosen as the actuator of the drag-free satellite control system, and the layout directly affects the stability of the satellite control. Due to the extremely rigorous objectives of drag-free control, a design method for the redundant thruster layout is proposed in this paper to improve the control stability of the satellite and reduce the allocation error of the control system. First, the factors corresponding to the allocation errors of redundant thruster layouts are analyzed. And the minimum number of thrusters required for satellite control is determined through the calculation method of thruster redundancy. Then, the design criterion of reducing the allocation error and increasing the satellite control stability is put forward. To demonstrate the effectiveness and feasibility of the design method proposed in this paper, the space gravitational wave detection satellite is taken as a simulation case. Thrust distribution models corresponding to the designed thruster layouts are established, and the results show that a proper layout can not only improve stability but also reduce fuel consumption. The research is looking forward to providing a reference for designing the microthruster layout of the gravitational wave detection satellite in the future.
1. Introduction
As a high-precision measurement platform, the drag-free satellite cannot install moving parts to meet the hardware design requirements for being a rigid body. Therefore, the microthruster is generally used to be the main executive mechanism of drag-free satellites in space. Thrust and torque produced by microthrusters should compensate for the nonconservative force and torque accurately so as to keep relatively static between the satellite and the internal test mass without contraction. The failure or damage of the thruster could occur in the long-term operation, which may lead to the instability of the control system and even the failure of the mission.
In order to avoid the above problem, one method is the master/replica actuator configuration. In 2015, the European Space Agency launched a satellite Laser Interferometer Space Antenna (LISA) Pathfinder (LPF) [1, 2]. LPF is equipped with the main and backup cold gas microthrusters as the execution system to operate safely and reliably in the halo orbit of the Lagrange L1 point in the Sun–Earth system. And the key technologies of drag-free control in space gravitational wave detection have been verified. Apart from the main backup method, the failure of the thruster can also be figured out by the redundant thruster configuration. The redundant thruster layout means that the thrusters used in the satellite are more than the degrees of freedom required for the control mission to make the system have a certain fault tolerance. In this research, Crawford [3] determined the relationship between the number of thrusters in the redundant configuration and the degrees of freedom of the satellite. For the LISA program [4, 5] in the future, the redundant microthruster configuration is proposed to complete the mission of drag-free control. In addition, Taiji-1 [6], a drag-free satellite launched by the Chinese Academy of Sciences in 2019, installed four radiofrequency ion thrusters and four Hall electric thrusters, which were used in single-degree-of-freedom drag-free control.
Most high-performance satellites could be equipped with redundant actuators in the control system to complete the control task. Xia et al. [7] extracted the design parameters of the GEO satellite thruster layout and optimized the process through programming to reduce the design iteration cycle and improve design efficiency. Gazzino et al. [8] introduced a control scheme to realize the satellite equipped with electric thrusters to minimize fuel consumption while maintaining position using four electric thrusters. Li et al. [9] designed a fault detection algorithm and developed two efficient station-keeping strategies in full and failure modes. The eight thrusters are used in normal mode, and the specified four thrusters are used in fault mode. However, apart from station-keeping, attitude control is also necessary for the system to be stable. Weiss, Kalabić, and Cairano [10] proposed a model predictive control strategy, which used six electrically powered thrusters and three axially symmetric reaction flywheels as actuators for orbit control and attitude control, respectively. In addition, Wei et al. [11] proposed a novel electric thruster configuration design combined with the 4-DOF robotic arm, which can provide flexible thrust in space to reduce propellant. Besides, to solve the problem of thruster failure, Faure et al. [12] studied the optimal layout of spacecraft (SC) thrusters under the constraints of fault diagnosability and fault recoverability.
Thrusters are more suitable for satellite models close to rigid body dynamics than robot arms and reaction flywheels. And the redundant thruster layout entails fewer thrusters at a lower cost than the master/replica actuator configuration because they could change the center of mass of the satellite. However, it should be noted that the redundant thruster layout could lead to unique thrust instructions. Many scholars proposed diverse solutions, such as the direct allocation method [13], daisy chain control allocation [14], and generalized inverse allocation methods [15]. Johansen and Fossen [16] summarized common methods under the nonlinear and linear models of actuators under different application backgrounds. Although varieties of algorithms can be used to obtain the proper instructions, the SC equipped with redundant thrusters still produce allocation errors in the control process, which will affect the control stability of the whole system [17]. Buffington and Enns [14] conducted a study on the stability of control systems with control allocation. To reduce the allocation error, the method based on mathematical programming [16] sets the minimum error as the objective function of the control allocation. Besides, Yang et al. [18] presented an optimization strategy for high-precision attitude control using the solid propellant microthruster array. Doman and Oppenheimer [19] proposed a closed-loop feedback control method to improve the stability of the system with control allocation, considering the effects of the efficiency matrix error caused by the installation deviation. Besides, the microthruster applied to a drag-free satellite needs an extremely strict thrust resolution. To decrease the actuator output deviation, Ma et al. [20] developed the radiofrequency ion microthruster μRIT-1 by optimizing the key structural components, which could make thrust output continuously adjustable. Moreover, Yang [21] developed the cold gas microthruster with an extremely strict thrust resolution to decrease output deviation.
Many researches only consider the relation between the thruster number and the orbit control or the attitude control. But the orbit control and the attitude control must be performed in the drag-free control process. And the design of the thruster layout for the drag-free control needs to take many factors into consideration, including the thruster number, position, and orientation. Moreover, a high microgravity level of drag-free control leads to high requirements for designing the thruster layout. But optimization algorithms and hardware optimization are unsuitable for the design of thruster layout to decrease errors. It is complex and difficult to design a suitable layout to optimize the thruster layout, considering allocation errors. Therefore, it is necessary for high-precision drag-free control to do research on designing the redundant thruster layout.
To realize the high precision attitude and orbit control, the paper proposes a design method for redundant thruster layout to reduce the distribution error generated by various influence factors. First, the main components of allocation error are derived from theoretical analysis. And the thruster configuration factor (TCF) is determined to represent the position and angle of the thrusters involved in the allocation error. In addition, the design criterion of minimum required thrusters is derived to be applied to the satellite model with the orbit control and the attitude control. The criterion is put forward to balance the thruster number and fault tolerance. On this basis, an optimization model is developed to reduce allocation error and improve the availability of layout design. Finally, the simulation results of the gravitational wave detection satellite show that the design of redundant thrusters can reduce the allocation error and improve the fault tolerance of the control system. It demonstrates the feasibility of the proposed method. This work is expected to provide a reference for the redundant thruster configuration design of the drag-free satellite or other satellites in the future.
The paper is organized as follows: Section 2 shows mathematical descriptions of thrust allocation. Section 3 presents the deduction of the optimization principle and method. Section 4 provides the application of the layout design and simulation strategy. Section 5 discusses the results. Section 6 presents the conclusions.
2. Mathematical Model of Thrust Allocation
The expected control quantity Fc is the generalized active control force. T is the thrust column vector. , where Ti represents the thrust generated by the i-th thruster. A is the control efficiency matrix, which is determined by the direction, position, and number of thrusters.
The installation of one thruster is determined in the xyz-coordinate system, as shown below.
In Figure 1, O is the origin of the satellite body coordinate system. C is the center of mass of the satellite. T is the installation position of the thruster. The xyz-coordinate system is parallel to the xbybzb-coordinate system. θ is the angle between the thruster direction and the x-y plane. φ is the angle between the projection of the thruster in the x-y plane and the x-axis.
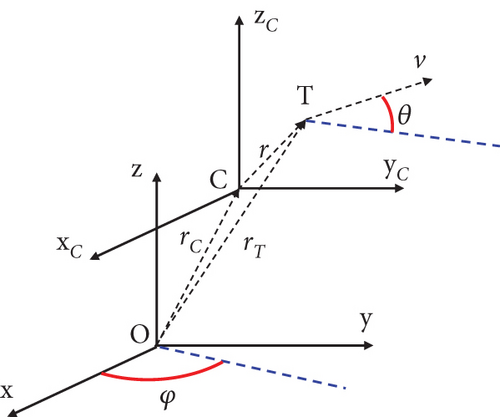
There are m installation positions of thrusters. In Figure 1, r represents the position vector of the thruster in the xbybzb-coordinate system. moment efficiency matrix L = (r1 × v1 ⋯ rj × vi ⋯ rm × vn).
The disturbing force measured is taken as the desired control vector Fc. The optimal solution T is calculated considering specific constraints subject to the thrust limits. T represents the lower limit of thrust, and represents the upper limit of thrust. Based on Formula (6), the allocation errors of thruster configuration could be analyzed.
3. The Design Method of Thruster Layout
The advantage of a redundant thruster layout is that it could effectively solve problems such as failure or damage of thrusters. However, there exist errors between the actual result F and the desired control vector Fc, called the allocation error. To reduce allocation errors, the number and the installation orientation of thrusters are designed in this paper.
3.1. The Allocation Error
3.2. TCF
In the above equation, δa1i is the error caused by the installation angle and δa2i is the error caused by the installation position.
It shows that Δ is positively correlated with TCF. Therefore, TCF could become a design critical standard measuring the effects of the thruster configuration on Δ.
3.3. TCF Optimization Principle
In order to decrease Δ, the two key criterions about the thruster layout are derived from TCF. And it is effective and feasible to evaluate the installation of thrusters in the design of the thruster layout.
3.3.1. Design Principle of Thruster Number
A redundant thruster layout does not mean that the more thrusters, the better stability, while it can provide fault tolerance. Reducing unnecessary thrusters reasonably is conducive to lowering Δ. The proof is as follows:
It can be proved that TCF increases with an increase in the number of thrusters. Besides, Equation (26) shows that Δ is positively related to TCF. Thus, it reveals that reducing unnecessary thrusters reasonably plays a critical role in lowering Δ.
3.3.2. TCF Optimization of Thruster Configuration
The above inequalities could construct simple linear matrix inequalities [22]. In order to improve the optimization efficiency of the model, it is useful to decrease the design parameters according to the actual situation, for instance, by minimizing the installation position and applying the paired thrusters. Hence, we can decrease the parameters of the constraints.
3.4. The Design Method of the Thruster Redundancy
The layout design of n thrusters accommodates up to five n parameters. These design parameters coupled with installation errors can significantly impact distribution outcomes and Δ. Therefore, the minimum required thrusters [3] need to be figured out.
The sufficient and necessary condition for Equation (34) is that each set of D − 1 linearly independent column vectors of control efficiency matrix A can form a D − 1 dimensional hyperplane, which splits D dimensional space into the same two parts where both there must be at least R + 1 column vectors corresponding to thrusters. The inequation (34) means that apart from arbitrary R failed thrusters, the remaining n-R thrusters can still control satellite motion with D degrees of freedom.
3.4.1. Calculation of the Redundancy
According to the above sufficient and necessary condition, the redundancy calculation method of the thruster layout can be deduced.
A is a D × n matrix and I is the D-order identity matrix, I = (e1 ⋯ eD). is formed by a set of D − 1 column vectors from A. The remaining vectors form the matrix .
B is the set of cosines of the angle between each column vector of matrix and the normal vector l. The number of positive values in B is equal to the number of column vectors in half space where the normal vector l is located. The number of negative values in B is equal to the number of column vectors in the other half space. The number of zero in B is the number of column vectors located in the D − 1 dimensional hyperplane formed by .
P is the number of positive values in B. N is the number of negative values in B. Z is the number of zero in B. And all the matrixes satisfying Equation (35) need to be found out so as to obtain P and N of each B corresponding to each .
3.4.2. Conditions for Minimum Redundancy
The above calculation method is performed on the basics of the fact that D − 1 column vectors in must be linearly independent. A set of linearly dependent column vectors cannot form a D − 1 dimensional hyperplane. And subsequent calculations can be avoided, which has no impact on the calculation of redundancy. Because the column vectors inapplicable to Equation (35) exist in of Equation (38) and the corresponding value of B is zero, consequently, the redundancy is determined by the number of positive and negative in B.
- •
If , the designed thruster layout cannot control the satellite motion with D degrees of freedom. So, it needs to be redesigned.
- •
If , the layout does not meet the requirements for the design redundancy. So, it needs to be redesigned.
- •
If , the thruster layout meets the requirements of control and design redundancy.
Given the analysis of the relation between TCF and the number of thrusters, as few thrusters as possible should be used to complete the control target. It demands that the actual redundancy should be equal to the design redundancy R.
Once the number n of thrusters is equal to 2R + D + 1, the above equalities combined with the calculation of the redundancy (Equations (35)–(39) in Section 3.4.1) could be translated to the linear matrix inequality problem [22]. The first equation indicates that all combinations of any five control vectors corresponding to thrusters are linearly independent. It means that any of the combinations can compose a D − 1 dimensional hyperplane. The second equation indicates that all elements of P and N are equal to R + 1. The implication is that there are R + 1 thrusters in each of the two equally divided spaces by a D − 1 dimensional hyperplane.
3.5. Assumptions
- •
Assumption 1 is to apply a precise and reasonable allocation algorithm. It ensures that AT = Fc.
- •
Assumption 2 uses a small-angle approximation to ignore the second-order small quantity.
- •
Assumption 3 is that the mean of the output error of each thruster is zero and the standard deviation is σδT.
The first constraint means the application conditions of the thrusters, which ensure that each thruster avoids interference. The second and third equations in constraints are derived from conditions for minimum redundancy. The last five inequations could show that the installation position and angle are limited by the actual physical constraints.
4. Designs of Redundant Thruster Layout
According to the above method of designing redundant thruster layout, the corresponding whole simulation strategy is shown in Figure 2. And the drag-free satellite LPF [23] is taken as an example for designing the thruster layout in this paper. A series of calculations would be performed to verify the redundancy of the thruster layout.

4.1. The Model of Redundant Thruster Layout
The satellite model is shown in Figure 3.
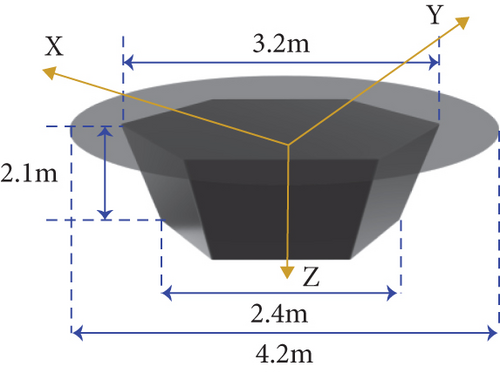
In order to reduce design parameters, paired thrusters are applied to each position, and as few installation positions as possible are used. The designed redundancy is set to be zero or one. Seven layouts are designed on the satellite model, as shown in Figure 4.
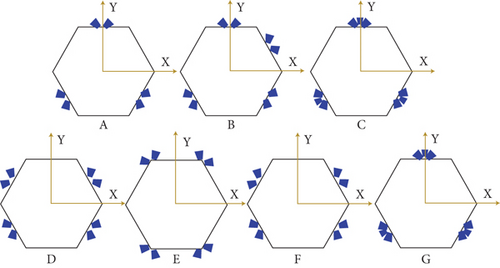
Layouts a, b, and c are designed to compare the effect of thruster number on Δ. Different from the first layout, the latter two layouts add two and three thrusters, respectively, to compare the TCF of the corresponding layout. In addition, layouts d and e are arranged to contrast the influence of the installation position of thrusters on Δ with layout b on the basic of the same thrusters. Besides, the difference between layout f and layout d is the installation angle, the same as the difference between layout c and layout g.
4.2. Results of Redundancy
According to the redundancy calculation method given in Section 3.4.1, the calculation process of the redundancy is shown in Figure 5.
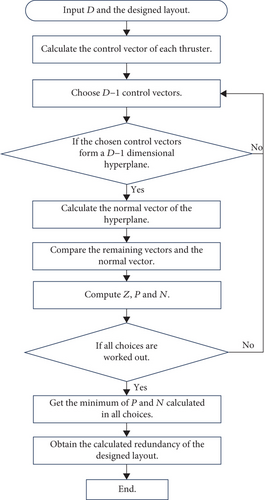
The designed layout determines the efficiency matrix A, which can be calculated by Equations (2)–(4). Efficiency matrices corresponding to all designed layouts in the previous section can be calculated. But with more factors taken into consideration, designing a redundant thruster layout is more complex. Using the paired thrusters can decrease the installation positions. And the design criterion minimum required thrusters can limit the number of thrusters.
Each unit vector applied on layout a is shown in Tables 1, 2, 3, 4, 5, and 6.
| No. | vx | vy | vz |
|---|---|---|---|
| T1 | −0.078310 | −0.864364 | 0.496732 |
| T2 | −0.787716 | 0.364364 | 0.496732 |
| T3 | 0.787716 | 0.364364 | 0.496732 |
| T4 | 0.078310 | −0.864364 | 0.496732 |
| T5 | −0.709406 | 0.500000 | 0.496732 |
| T6 | 0.709406 | 0.500000 | 0.496732 |
| No. | vx | vy | vz |
|---|---|---|---|
| T7 | 0.787716 | −0.364364 | 0.496732 |
| T8 | 0.078310 | 0.864364 | 0.496732 |
| No. | vx | vy | vz |
|---|---|---|---|
| T7 | 0.433013 | 0.250000 | 0.866025 |
| T8 | −0.433013 | 0.250000 | 0.8660254 |
| T9 | 0 | −0.500000 | 0.866025 |
| No. | vx | vy | vz |
|---|---|---|---|
| T1 | −0.078310 | −0.864364 | 0.496732 |
| T2 | −0.787716 | 0.364364 | 0.496732 |
| T3 | 0.787716 | −0.364364 | 0.496732 |
| T4 | 0.078310 | 0.864364 | 0.496732 |
| T5 | 0.787716 | −0.364364 | 0.496732 |
| T6 | 0.078310 | 0.864364 | 0.496732 |
| T7 | −0.787716 | −0.364364 | 0.496732 |
| T8 | −0.078310 | 0.864364 | 0.496732 |
| No. | vx | vy | vz |
|---|---|---|---|
| T1 | 0.669550 | −0.602866 | 0.433884 |
| T2 | −0.187322 | 0.881281 | 0.433884 |
| T3 | 0.187322 | 0.881281 | 0.433884 |
| T4 | −0.669550 | −0.602866 | 0.433884 |
| T5 | −0.669550 | 0.602866 | 0.433884 |
| T6 | 0.187322 | −0.881281 | 0.433884 |
| T7 | −0.187322 | −0.881281 | 0.433884 |
| T8 | 0.669550 | 0.602866 | 0.433884 |
| No. | vx | vy | vz |
|---|---|---|---|
| T7 | 0.813798 | 0.469846 | 0.342020 |
| T8 | −0.813798 | 0.469846 | 0.342020 |
| T9 | 0 | -0.939693 | 0.342020 |
Then, the installation positions of the thrusters should be determined. The installation positions of layouts c and g are the same as layout a. The position vectors of the corresponding installation place to the satellite centroid coordinate system are r1 = (−1.05, −0.61, 0.62), r2 = (1.05, −0.61, 0.62), and r3 = (0, 1.21, 0.62).
Different from layout a, the additional position vector of layout b is r4 = (1.05, 0.61, 0.62).
Layout d is the same as layout f. And the position vectors of each installation placed in the satellite centroid coordinate system are r1 = (−1.05, −0.61, 0.62), r2 = (1.05, −0.61, 0.62), r3 = (1.05, 0.61, 0.62), and r4 = (−1.05, 0.61, 0.62).
The position vectors of Layout e are r1= (-0.7, -1.21, 0.62), r2= (0.7, -1.21, 0.62), r3= (0.7, 1.21, 0.62) and r4= (-0.7, 1.21, 0.62).
Throughout the use of Equation (4), the efficiency matrix A corresponding to each thruster layout is deduced, which is input into the redundancy calculation. In addition, D = 6. Thus, the calculation results are shown in Table 7.
| Layout | a | b | c | d | e | f | g |
|---|---|---|---|---|---|---|---|
| The calculated redundancy | −1 | −1 | −1 | −1 | −1 | −1 | −1 |
| The actual redundancy | 0 | 1 | 1 | 1 | 1 | 1 | 1 |
The difference between the calculated redundancy and the actual redundancy is caused by the virtual thruster produced by solar radiation pressure. Because the solar radiation pressure exerted on the drag-free satellite is a relatively stable force with respect to the SC, it can be regarded as a virtual thruster Tv, as shown in Figure 6.
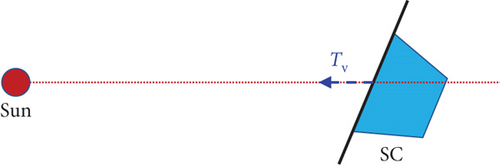
The position vector of the virtual thruster Tv is r = (0, 0, −0.4 m). θ = 60°. φ of Tv in the SC body coordinate system varies with the satellite position in the orbit. The actual redundancy of each layout should be computed with the virtual thruster, which is reliable. Consequently, the actual redundancy of each thruster in Table 7 can fulfill the design requirement for six degrees of freedom.
5. Simulation
According to the simulation strategy and the control allocation model, a series of simulations of the above layouts are completed to evaluate the relationship between Δ and TCF. Besides, the propellant consumption of each layout is figured out, and the fault tolerance can be verified.
5.1. Simulation of the Orbit
The orbits of the Taiji Project [24] are taken for simulation test in this paper, as shown in Figure 7.
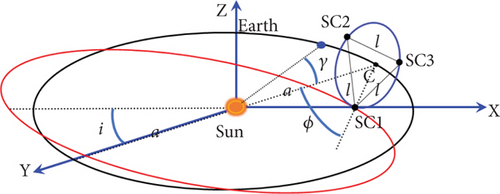
l = 3 × 10⁶ km. And the results of i and e are about 0.009968838702433 and 0.005839000853703, respectively.
The results are shown in Table 8.
| Satellite | Ω | ω | M |
|---|---|---|---|
| SC1 | 270° | 270° | 180° |
| SC2 | 150° | 270° | 300° |
| SC3 | 30° | 270° | 60° |
Hence, the corresponding values of θa are 180° 299.5636083225304° and 60.436391677469594°, respectively.
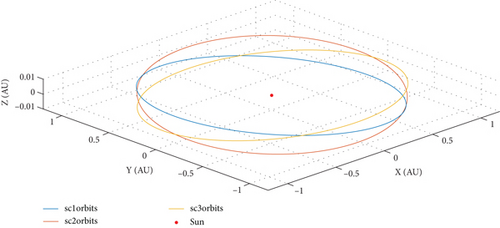
Based on the above results, the orbits are simulated through MATLAB software and the TU Delft Astrodynamics Toolbox (TUDAT). The mass of each satellite model is 1500 kg. The diameter of the sail is 4.2 m. The operation time is 2 years. The step size is 1000 s. The simulation orbits are shown in Figure 8.
5.2. Simulation of the Disturbing Force
5.2.1. Simulation of the Solar Radiation Pressure
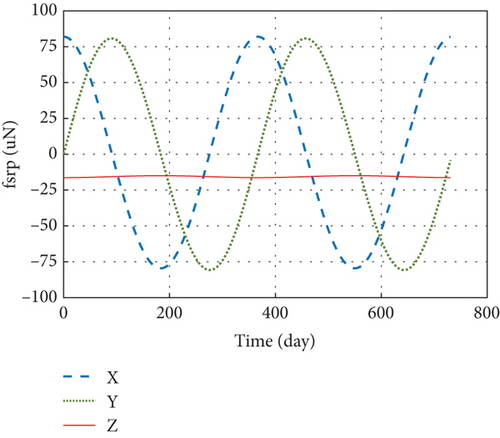
The speed of light in vacuum is c = 299792458 m/s. 1A.U. = 1.495978707 × 10¹¹ m. The standard solar constant is W0 = 1361 W/m2 [27]. Rl is the relative distance between the satellite and the sun. Sz is the solar sail area. Ra is the absorption coefficient. Rd is the diffuse reflection coefficient. Rs is the specular reflection coefficient. These three coefficients satisfy Ra + Rd + Rs = 1. z is the unit vector of the z-axis. s is the unit direction vector of the satellite pointing towards the sun.
Three drag-free satellites construct an equilateral triangular formation. The calculation of the disturbing force acting on SC1 is the same as the other two. Assuming Rs = 0 and Ra = 0.14 [28], the calculation results of fsrp in the ecliptic coordinate system are obtained, as shown in Figure 9.
5.2.2. Enter Instruction of Control Allocation
The force f in the generalized disturbing force fd is calculated, as shown in Figure 10.
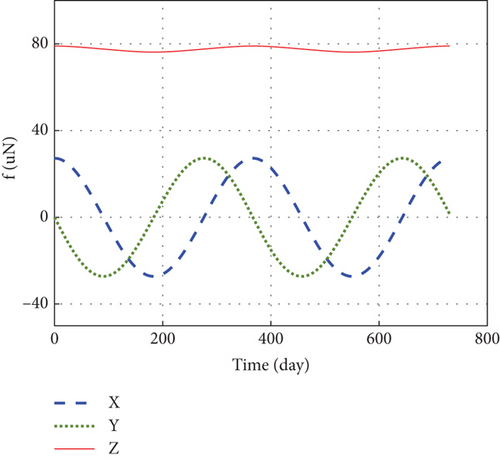
rc = (0, 0,−0.4 m)Т. The torque l in the generalized disturbing force fd is calculated, shown in Figure 11.
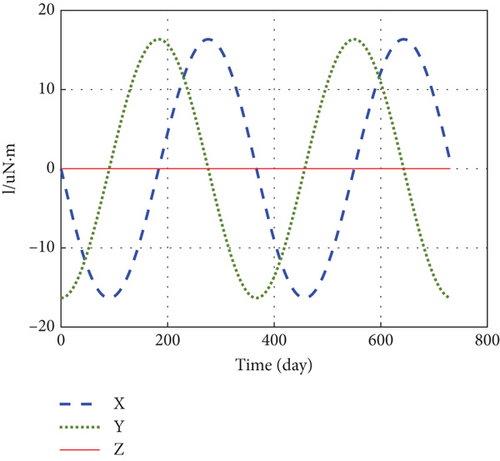
f and l compose fd. According to Equation (51), Fc can be figured out and used as the enter instruction to calculate the thrust distribution of each thruster at each time point.
5.3. Modified Pseudoinverse Allocation
In this paper, the modified pseudoinverse method is used to work out the thrust distribution results T with the constraint condition ().
A† is the pseudoinverse matrix of A. .
N = (n1 n2 ⋯ nn − m).
5.4. Simulation Results and Analysis
Because of a larger thrust range and lower noise [21], the cold gas microthruster is chosen as the actuator. The limited range of Ti in Equation (6) is set as [1 μN, 100 μN]. Different simulations of all layouts in normal mode are compared to find the relationship between the TCF of each layout and Δ of the counterpart. And the simulation in thruster failure mode is performed to verify the fault tolerance of the redundant thruster layout.
5.4.1. Simulation Results of All layouts
In order to simulate the thrust output error, a random value taken from 0 to 0.1 μN is added to each element of the distribution result T. The actual thrust results of all layouts are shown in Figure 12.
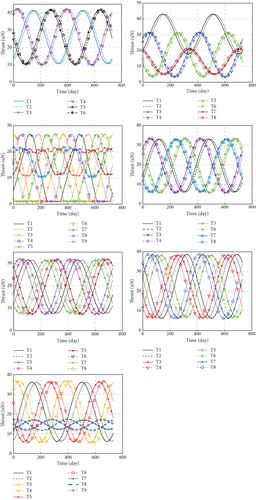
From top to bottom and left to right, the seven pictures represent the thrust results of layouts a, b, c, d, e, f, and g. All the figures show that the actual thrust of each thruster in each picture fluctuates periodically within the restricted range, which meets the constraint condition. The smooth curves indicate that the correspondent thrusters are barely assigned a constant value equal to the lower limit or upper limit of thrust. In addition, if the thrust is in a flat line, the output of the thruster must be equal to the limits of the thrust.
Throughout the use of the above results, we can obtain the actual control forces and torques, which constitute the actual control vector. And the allocation error Δ is the difference between the actual control vector and the desired control vector. The results of Δ are shown in Figure 13.

Two pictures at each line in Figure 13 represent Δ of the correspondent layout. The left picture shows the error Δ of each control force. The right picture shows the error Δ of each control torque. The results show that the allocation error in all pictures is at the level of 10−7. The difference in pictures in the third line implies that thrust redistribution is executed in the simulation of layout c. With the increase in thruster number, thrust redistribution could be more likely to occur in the control process. But given the possibility of thruster failure, we should keep the balance between thruster number and allocation error.
5.4.2. Analysis of Allocations
The main source of noise is allocation error. And the influence of TCF on allocation error is studied by frequency spectrum analysis to obtain the ability to restrain the error of each layout. The spectrum of Δ corresponding to each layout is shown in Figure 14.
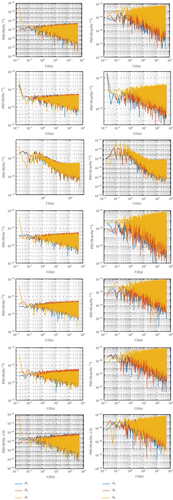
The left picture in each row represents the control force noise, and the right picture in each row represents the control torque noise. Except for layout c, the results of other layouts show that the noise from 0.1 to 1000 Hz is between 16 and 17 orders of magnitude. The results of layouts c and g with the same thrusters reveal that thrust redistribution also influences the error, which belongs to the algorithm error. Subsequently, the variance of Δ is calculated to compare the data from different layouts intuitively. And the sum of varΔi is worked out. The value of TCF corresponding to each layout is computed. The calculations are shown in Table 9.
| Layout | a | b | c | d | e | f | g |
|---|---|---|---|---|---|---|---|
| varΔi/10−15 | 1.88 | 2.40 | 16.17 | 2.09 | 2.09 | 1.62 | 3.00 |
| 1.89 | 2.63 | 16.19 | 2.90 | 2.94 | 3.77 | 2.98 | |
| 1.24 | 1.63 | 11.12 | 1.62 | 1.66 | 1.27 | 1.53 | |
| 0.70 | 0.98 | 8.23 | 1.10 | 1.21 | 1.61 | 1.95 | |
| 0.69 | 0.89 | 8.17 | 0.75 | 1.07 | 1.10 | 1.94 | |
| 3.71 | 4.94 | 31.36 | 5.00 | 6.59 | 7.14 | 3.70 | |
| Sum/10−15 | 10.1 | 13.5 | 91.2 | 13.5 | 15.6 | 16.5 | 15.1 |
| TCF | 12.1 | 16.2 | 20.7 | 16.2 | 18.6 | 19.9 | 18.1 |
It can be seen that TCF is positively associated with thruster number, derived from the data in Columns 1, 2, and 3 corresponding to layouts a, b, and c. It verifies the validity of the deduction in Section 3.3.1. And from the data in Columns 2, 4, 5, and 6 in the table, it can be found that the sum of varΔi augments with the increase of TCF on the condition of the same thrusters. In addition, because cov(Δi, Δi) = varΔi, the sum of varΔi is equal to tr(covΔ). Thus, it can be found that TCF is proportional to tr(covΔ), which demonstrates the deduction of Equation (26). Moreover, the sum of varΔi of layout c is the maximum among all results. It illustrates that thrust redistribution could lead to an increase in the sum. The limitation of the obtained results is that the relation between TCF and allocation error must be evaluated on the condition of the same number of thrusters. It can be found that the TCF of layout g is smaller than the TCF of layouts e and f, while the thrusters of layout g are more than the thrusters of layouts e and f. But if the extra thrusters are added to the designed layout, TCF can be compared between them. For example, the results of layouts a, b, c, and g show that the TCF of layout c error is the biggest, as well as the allocation.
5.4.3. Analysis of Fuel Consumption and Fault Tolerance
On the basics of the above thrust distribution results, the total impulse consumed in 2 years can be calculated through the time integral of thrust. Assuming that the specific impulse Isp of the cold gas microthruster is 60 s (N2) and g is 9.8 N/kg, the total mass corresponding to each layout is shown in Table 10.
| Layout | Total impulse /N·s | Mass/kg | TCF |
|---|---|---|---|
| a | 9878.85 | 16.80 | 12.1 |
| b | 9885.18 | 16.81 | 16.2 |
| c | 7494.40 | 12.75 | 20.7 |
| d | 9885.06 | 16.81 | 16.2 |
| e | 9855.10 | 16.81 | 18.6 |
| f | 11313.31 | 19.24 | 19.9 |
| g | 10742.96 | 18.27 | 18.1 |
The above results show that the fuel consumption of redundant thrusters is related not only to the number of thrusters but also to thruster configuration. And it can be seen that layouts a, b, and e consume almost the same mass of fuel, while they have different values of TCF. Besides, four layouts with eight thrusters indicate that fuel consumption has some relationship with thruster configuration. A reasonable configuration could balance thruster number, allocation error, and fuel consumption.
A redundant thruster layout could improve the fault tolerance caused by the permission of R failure thrusters. R of layout a is 0. Hence, one of the redundant thrusters designed in other layouts is chosen to be invalid. The results are shown in Figure 15.
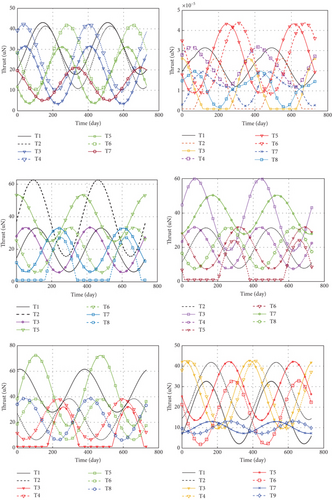
Based on the calculation of the actual redundancy corresponding to each layout, all layouts but layout a can perform simulation experiments with one thruster failure. All the above pictures show the distribution results of each redundant thruster layout. The missing curve T7 in the first picture indicates that the Thruster 7 is out of use. The same goes for other pictures. Compared with the former simulation without failed thrusters, the latter results reveal that the redundant thruster layout has a certain fault tolerance, which could use other thrusters to compensate for the effect of the failed thruster on control stability. It demonstrates the feasibility of the designed layout with redundant thrusters.
6. Conclusion
This paper presents a design method for the redundant thruster layout to improve the control stability of the satellite and reduce the allocation error. In the proposed method, the TCF of redundant thruster layout is put forward and derived through theoretical analysis. The simulation results can verify that TCF can be set as the key criterion for evaluating the allocation error of the attitude and orbit control systems. And the geometric relationship between the thrusters should be designed to reduce the allocation error with a smaller TCF. In addition, the minimum number of thrusters satisfying the redundancy requirement is defined in the layout design. The calculation method for thruster redundancy is provided in this paper. The results of the layouts with one failed thruster verify the validity of the design criterion of minimum required thrusters. And the advantage of a redundant thruster layout is that it can effectively solve problems such as failure or damage of thrusters. Moreover, the simulation results can verify the feasibility and effectiveness of the proposed design method for attitude and orbit control and show the influence of thruster layout on fuel consumption. Future work will be to consider establishing the relation between fuel consumption and requests for allocation error to seek a more suitable design method for the redundant thruster layout for a wider practical application.
Conflicts of Interest
The authors declare no conflicts of interest.
Funding
This work was supported by the Ministry of Science and Technology of China (grant number 2021YFC2202604).
Open Research
Data Availability Statement
The authors confirm that the data supporting the findings of this study are available within the article.


