Optimization of Thermal Conductivity and Latent Heat Capacity Using Fractional Factorial Approach for the Synthesis of Nano-Enhanced High-Performance Phase-Change Material
Abstract
This study systematically optimizes the synthesis parameters for nano-enhanced phase-change materials (NEPCMs) based on paraffin wax and copper oxide. The objective is to collectively improve both thermal conductivity and latent heat capacity. Unlike the previous research, the present approach considers all significant synthesis parameters simultaneously, employing a fractional factorial approach for efficient experimentation. By varying CuO nanoparticle sizes, paraffin wax melting temperatures, and mass fractions of CuO and surfactant in pure paraffin wax, the comprehensive thermal analysis reveals a maximum enhancement of 51.2% thermal conductivity compared to pure paraffin wax. In addition to thermal conductivity improvement, the applied optimization strategy identifies six NEPCM combinations, collectively enhancing thermal conductivity, latent heat of melting, and solidification. Among these, one NEPCM exhibits notable improvements of 13.39%, 6.9%, and 4.5% in thermal conductivity, latent heat of melting, and solidification, respectively, making it suitable for thermal energy storage systems due to combined enhanced thermal properties. Additionally, the ANOVA approach indicates the melting temperature of pure PCM as the most significant factor for thermal conductivity enhancement, with a contribution of 55.45%. The present study has a direct impact on improving thermal properties, specifically in thermal energy storage technology, making it relevant to the thermal management research community.
1. Introduction
Escalated energy demand caused by rapid industrialization and modernized living standards has necessitated a transition toward sustainable energy sources. In this regard, solar energy is a promising solution because of its vast potential relative to other renewable energy sources. However, it remains challenging to exploit the full potential of solar energy because of its intermittent availability and the lack of efficient energy storage technologies. This challenge presents an opportunity for developing nano-enhanced phase-change materials (NEPCMs), which can seamlessly capture, store, and release thermal energy [1]. The term NEPCMs can be understood more easily in terms of thermal conductivity and thermal capacity by applying the fundamentals of heat transfer. In the present work, combinations of phase-change materials with foreign particle inclusions for enhancing the thermophysical properties of the materials are called NEPCMs.
The thermal conductivities of pure phase-change materials (PCMs) are rather low, which make them unsuitable for direct use in thermal energy storage applications and other energy-related applications. Undoubtedly, the use of pure PCMs significantly compromises the performance of thermal energy storage (TES) systems. Conversely, many studies have revealed the importance of incorporating nano-additives in PCMs to improve their thermophysical properties [1, 2, 3, 4, 5, 6, 7, 8]. The effectiveness of arrays of zero-dimensional, one-dimensional, two-dimensional, and three-dimensional nano-additives (metals, metal oxides, carbon derivatives, foams, sheets, tubes, and flakes) in improving the thermophysical properties of PCMs has already been proved [9, 10]. However, despite their numerous benefits, carbon derivatives exhibit a few disadvantages in NEPCM synthesis, such as complex preparation, easy agglomeration, high cost, collapse at high temperatures, and large expansion coefficient, which limit their large-scale application [9]. In a few cases, the enthalpies of the NEPCMs synthesized using carbon derivates, especially carbon nanotubes (CNTs) and expanded graphite, are remarkably lower than those of metal oxide-based NEPCMs [9]. Although the thermal conductivities of the metal oxides used to synthesize NEPCMs are often lower than those of the corresponding pure metal particles, metal oxides are chemically stable and less expensive, which makes them suitable for large-scale utilization [11, 12].
It has been observed consistently that PCM–nanoparticle integration leads to remarkable performance enhancements in materials meant for TES systems. The incorporation of Al2O3, MgO, and SiO2 nanoparticles in a PCM substantially improved the charging–discharging performance of a PCM-based latent heat TES (LHTES) system [13]. In contrast to direct experiments, recent studies have adopted data training approaches to predict the thermal conductivity enhancement of PCMs after the incorporation of nano-additives. These methodologies necessitate the use of huge thermal conductivity enhancement datasets. The substantial volume of research dedicated to this topic reflects the significance of using nano-additives to tailor the thermophysical properties of NEPCMs [14, 15]. More precisely, beyond laboratory characterization results and application-related concerns, NEPCMs provide efficient heat dissipation from electronic components, thereby emerging as a crucial means to reduce power consumption [16]. In a study, PCMs emerged as the key factor in battery thermal management. These materials are especially important for battery temperature management, which is crucial for enhancing the overall performance and safety of batteries [17, 18, 19, 20, 21, 22]. To boost battery performance, different nano-additives, such as graphene and CNTs in conjunction with a fin system, have been incorporated into PCMs. These approaches successfully tailored the thermophysical properties of PCMs and yielded notable improvements in the overall performance of battery systems [23, 24, 25, 26]. Several studies have presented experimental results related to the incorporation of nanoparticles into PCMs. For instance, Sharshir et al. [27] conducted a comparative study of mono and hybrid nanocomposite PCMs by combining paraffin with copper oxide and cobalt oxide. The findings indicated that the resulting composite PCMs outperformed the pure PCM. To test the performance of these composite PCMs, a direct solar exposure test was performed at a specific location in Egypt, and the results showed that the temperature of the hybrid composite increased by 14.52%, which was higher than that of the pure PCM.
Şahan et al. [28] suggested the integration of Fe3O4 as a cost-effective strategy to enhance the heat transfer capabilities of PCM systems. The synthesized paraffin-based nanocomposite exhibited substantial improvements in thermal conductivity, latent heat storage, and thermal stability. The thermal conductivity of the composite was enhanced significantly by 48% and 60% with the addition of 10% and 20% nano-sized Fe3O4 by weight fraction. In addition to thermal conductivity, the melting temperature of the nanocomposite remained consistent even after 500 thermal cycles. In terms of economic viability, the incorporation of 10 wt.% Fe3O4 nanoparticles increased the manufacturing cost by only 20%. Wang et al. [12] explored the heat transfer characteristics of a CuO-loaded nanocomposite. The mass fraction of copper oxide in paraffin wax varied from 0.3% to 1.2% in four equal intervals by adding a surfactant. Notably, loading 1.2% CuO nanoparticles in paraffin increased the thermal conductivity of the material significantly by 24.4%, but the latent heat decreased marginally by 1.5%. In an investigation of the heat transfer performance of the resulting PCM nanocomposite, a heat pipe was inserted into the evaporator of a cooling system containing 1.2 wt.% CuO. Consequently, the temperature inside the heat pipe decreased by 17.2%, thereby highlighting the importance of nanointegration.
In addition to metal and metal oxides, carbon derivatives have been incorporated into PCM systems. Despite their different natures, these two types of additives yielded marked improvements in thermal conductivity. Recently, Fikri et al. [29] investigated the tailored performance of Plusice A70 PCM after incorporating multiwalled CNTs and functionalized multiwalled CNTs into it. This experimental approach, which depended solely on variation of the mass fractions of nano-additives, was consistent with those used in numerous past studies. Among the two tested compositions, the highest increase in thermal conductivity of 150.7% was observed for the composite containing 1.0 wt.% functionalized MWCNTs, whereas it decreased to 109.5% for the composite containing nonfunctionalized MWCNTs. In many other studies, compositions of different nano-additives were varied, or combinations of distinct nano-additives were explored. In all such studies, it was found that the inclusion of foreign particles improved thermal conductivity, which is favorable for enhancing the performance of LHTES systems [30, 31, 32, 33, 34, 35].
The above concise literature provides evidence of many other similar research efforts that collectively demonstrate the favorable effect of incorporating nanoparticles on enhancing the thermophysical properties of PCMs. The findings highlight the potential of nanoparticles for transforming energy storage technologies to make them suitable for use in commercial applications. A precise review of the literature reveals that, till date, the efforts related to enhancing the thermal conductivity of PCMs have revolved predominantly around varying only the percentage composition of nanoparticles without accounting for the simultaneous influence of PCM melting temperature, nanoparticle sizes, and compositions of nanoparticles and surfactants in PCMs. In addition to thermal conductivity, the latent heat interaction during phase change is also a predominant factor that must be considered during NEPCM synthesis. Unfortunately, the literature on this type of synergistic investigation is limited. To the best of our knowledge, existing studies have not explored the combined influence of nano-additives and PCM properties on NEPCM synthesis while considering both thermal conductivity and latent heat capacity together. Furthermore, there has been a limited exploration of optimization approaches, coupled with an investigation into the significance and contribution levels of various independent factors affecting the thermal properties of NEPCMs, using any commercial software package.
This study introduces a novel approach to optimize synthesis parameters for paraffin wax and copper oxide-based nano-enhanced phase-change materials (NEPCMs). In contrast to existing research, the present approach considers all key synthesis parameters simultaneously, utilizing a fractional factorial approach for efficient experimentation. Notably, we address the typical tradeoff between thermal conductivity and phase change enthalpy during NEPCM synthesis [36, 37, 38, 39]; to balance this, the present distinct contribution lies in achieving a simultaneous enhancement of NEPCM thermal conductivity and phase change enthalpy, effectively demonstrating the successful optimizing strategy. Additionally, the ANOVA approach carried out in commercial software (Minitab) identifies the significance of each NEPCM synthesis parameter toward the improvement of thermal conductivity. This pioneering work creates opportunities for advancements in materials science and thermal management research.
2. NEPCM Synthesis and Characterization
To understand the synergistic effects of three different sizes of CuO nanoparticles and three paraffin waxes differentiated by their melting temperatures, a series of NEPCM samples is prepared herein. The compositions of the CuO nanoparticles, surfactant, and pure PCM are considered during the synthesis of these NEPCM samples. To investigate the thermophysical properties of the samples, particularly their thermal conductivities, the laser flash method is used. Additionally, the thermal stability and heat flow behaviors of all the NEPCMs synthesized herein and those of pure PCM are analyzed using thermogravimetric analysis (TGA) and differential scanning calorimetry (DSC) techniques.
2.1. Material Selection
The selection of organic PCMs in the present research arises from its remarkable attributes, supported by quantitative suggestions. Paraffin wax as an organic PCM, prime candidate, exhibits high energy density (>150 MJ/m3) [40, 41], thermal stability, no phase segregation, negligible supercooling, and relatively cost effectiveness at commercial grade rather than pure [36, 42, 43]. Inorganic salts demonstrate relatively high latent heat of fusion (68–1,041 kJ/kg) yet suffer from poor nucleation properties and incongruent melting, leading to significant supercooling issues [40]. More specifically, inorganic PCMs like alum exhibit a substantial increase in thermal conductivity (0.497–5.875 W/mK, 1,082%); their susceptibility to supercooling and concerns about phase stability persist especially when incorporating 3D-expanded graphite or other carbon nanomaterials [44]. Furthermore, the literature recommended optimum thermal conductivity range of 0.9–1.5 W/mK for thermal storage application can be aligned with the organic PCMs through compromising thermal conductivity with the latent heat storage capacity. This balanced approach between thermal conductivity and storage capacity is essential to prevent fast discharge in thermal energy storage systems due to high thermal conductivity. Moreover, the cost-effectiveness of commercial-grade organic PCMs makes them suitable for large-capacity thermal energy technologies, especially as PCM stored in metallic containers for solar thermal energy systems. In the context of metal containers, corrosion is a critical concern, and over inorganic, the organic PCMs emerge as the optimal solution [40, 45]. Although as mentioned there are some additional benefits of organic PCMs over inorganic, the major considerations favoring organic PCM for large-scale applications are their minimal supercooling and corrosion resistance, making them particularly suitable for thermal energy technologies stored in metallic containers for solar thermal energy systems. These quantitative considerations, coupled with the practical advantages of organic PCMs, strengthen their position as an efficient and cost-effective solution for thermal energy storage applications.
Three different grades each of paraffin wax (pure PCM) (labeled PW-1, PW-2, and PW-3, CAS 8002-74-2) and nano-sized CuO powder (labeled CuO-10, CuO-40, and CuO-80, CAS 1317-38-0) in their purest forms were purchased from Sigma–Aldrich, Aladdin Chemicals, and Avention Korea, separately. The specified average size details of CuO nanoparticles rely on information provided by the vendor rather than being derived from physical measurements conducted in the laboratory. The surfactant SPAN-80 (CAS 1338-43-8) was sourced from Sigma–Aldrich, Korea, and used to ensure that the nanoparticles dispersed appropriately in the liquid phase of paraffin wax during NEPCM synthesis. The thermophysical properties of these materials are listed in Table 1.
| Pure paraffin wax (PW) and CuO particles | Melting temperature (°C) | Thermal conductivity ∗ (W/mK) | Latent heat melting (J/g) | Latent heat solidification (J/g) | Density (kg/m3) | Specific heat (J/g/K) | Diffusivity (mm2/s) |
|---|---|---|---|---|---|---|---|
| PW-1 | 51 | 0.156 | 152.4 | 145.8 | 799 | 2.807 | 0.070 |
| PW-2 | 51.8 | 0.183 | 149.2 | 144.7 | 778 | 2.870 | 0.082 |
| PW-3 | 62.2 | 0.224 | 197.1 | 203.0 | 874 | 2.232 | 0.115 |
| Avg. particle size (nm) | Thermal conductivity in powder form (W/mK) | ||||||
| CuO-10 | 10 | 1.064 | |||||
| CuO-40 | 40 | 1.127 | |||||
| CuO-80 | 80 | 1.069 | |||||
- ∗Measured at 35°C. Avg., average.
2.2. NEPCM Synthesis
Four important factors (paraffin melting temperature, nanoparticle size, composition mass fraction of CuO, and surfactant in PCM) were considered simultaneously for synthesizing all NEPCM samples. The synthesis process depicted in Figure 1 follows the fractional factorial approach [46], and in total, nine samples were prepared, as listed in Table 2. This approach provides a substantial array of combinations of the factors necessary for understanding simultaneous interactions of the variables related to the analysis objective.

| NEPCM | PW melting temperature (°C) |
CuO nanoparticle (average particle size) (nm) |
CuO in PW (wt.%) | Surfactant (SPAN-80) (wt.%) |
|---|---|---|---|---|
| NEPCM-1 | 51 | 10 | 0.3 | 0.3 |
| NEPCM-2 | 51.8 | 40 | 0.3 | 0.3 |
| NEPCM-3 | 62.2 | 80 | 0.3 | 0.3 |
| NEPCM-4 | 51.8 | 10 | 0.6 | 0.6 |
| NEPCM-5 | 62.2 | 40 | 0.6 | 0.6 |
| NEPCM-6 | 51 | 80 | 0.6 | 0.6 |
| NEPCM-7 | 62.2 | 10 | 0.9 | 0.9 |
| NEPCM-8 | 51 | 40 | 0.9 | 0.9 |
| NEPCM-9 | 51.8 | 80 | 0.9 | 0.9 |
The CuO concentrations in each NEPCM sample were not solely based on varying the CuO weight percent; it also involved the simultaneous consideration of all other synthesis parameters. This comprehensive approach yielded a set of combinations for all synthesis parameters, guiding the determination and processing of CuO concentration during synthesis. The fractional factorial approach is a statistical experimental design method to optimize the usage of experimental facilities by testing a subset of factor level combinations instead of all possible combinations in a full factorial design. The reduction in experimental runs is accomplished by fixing certain factor combinations at specific levels, under the assumption that specific interactions are either negligible or can be accurately estimated through other runs. This technique systematically varies factors and their levels to efficiently explore main effects and interactions. To reduce the number of experimental runs while maintaining statistical validity, the present experimental design involves systematically varying a subset of any one process parameter while keeping others constant. This thoughtful selection process has yielded nine distinct sets for conducting the experiments, effectively minimizing the overall number of required experimental runs [46].
Herein, enhancements to both thermal conductivity and latent heat capacity were considered the objectives of experimentation. A similar two-step method was adopted for the synthesis of all NEPCM samples. As depicted in Figure 2, all three types of pure paraffin wax in the solid phase were melted at 70°C in a magnetic stirrer, which provided the dual functions of heating and stirring. Then, the nanoparticles and SPAN-80 surfactant were mixed carefully with the liquid paraffin wax.
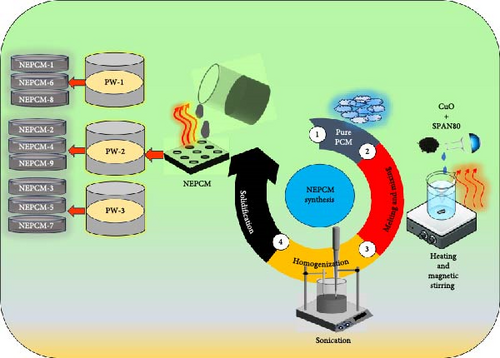
The mixing process was accomplished through strong shear magnetic stirring at 400 rpm for 40 min. Then, homogenization of the dispersed nanoparticles was checked using a probe-type sonicator (BANDELIN, Germany) operated at a frequency of 40 kHz for 40 min. Thereafter, nine NEPCM samples were prepared, collected, and solidified for further characterization.
2.3. Thermal Transitions
To quantify the heat exchange during temperature variations and capture the transient behaviors of the NEPCMs and pure PCM, a DSC analysis was performed. To this end, a differential scanning calorimeter (DSC 200 F3 Maia, Netzsch-Gerätebau GmbH) was utilized in nitrogen atmosphere, and heating and cooling rates of 5°C per minute were adopted. The area enclosed by the temperature axis within the DSC curve was used to determine the latent heat values during melting and solidification of the PCM and NEPCM samples. In conjunction with these intersections of extrapolated baseline and the tangents to the DSC curve drawn gives onset and endset points [47].
2.4. Thermogravimetric Analysis
A TGA was performed to assess and compare the thermal stabilities of the synthesized NEPCMs and the pure PCM. To this end, a thermal analyzer (STA 449 F3, Netzsch-Gerätebau GmbH) was used to determine changes in material weight in response to controlled changes in the ambient temperature. The temperature during heating of the samples was varied from 28 to 650°C at a rate of 10°C/min. The instrument was purged with nitrogen to provide an inert and stable experimental atmosphere.
2.5. Thermal Conductivity Measurement
All samples were prepared with a square shape, and their thicknesses and side length were 2–3 and 10 mm, respectively, as depicted in Figure 1.
A laser flash apparatus (LFA 457 MicroFlash, Netzsch-Gerätebau GmbH, Germany) was used to determine the thermal conductivities of the NEPCM samples. A schematic of the laser flash technique is illustrated in Figure 3, where the front surface of a plane parallel to the NEPCM sample was used to provide heat through a short energy light pulse, and an infrared detector was used to measure the temperature of the rear face of the NEPCM sample.
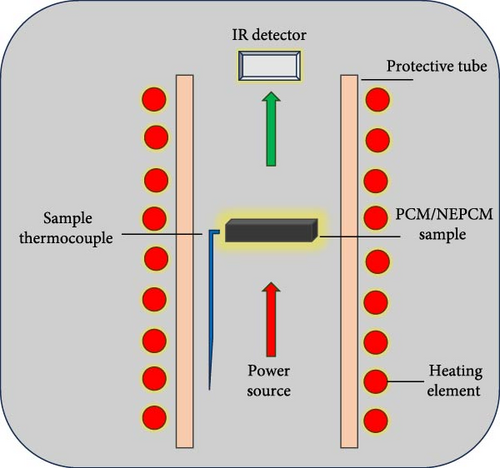
The accuracies of the thermal diffusivity and specific heat capacity measurements were less than ±3% and less than ±5%, respectively.
3. Results and Discussion
In this section, we present and discuss the results of the above-described comprehensive investigation of the thermal conductivity, heat flow, and thermal stability properties of the NEPCM samples synthesized herein. Through a systematic analysis, we aim to interpret the simultaneous effects of paraffin wax melting temperatures, CuO nanoparticle size, and CuO and surfactant composition fractions in the PCM on the fundamental thermal characteristics of the synthesized NEPCMs.
3.1. Thermomechanics of PCM and NEPCMs
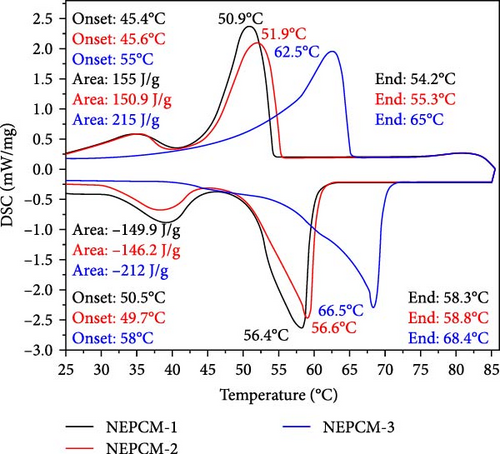
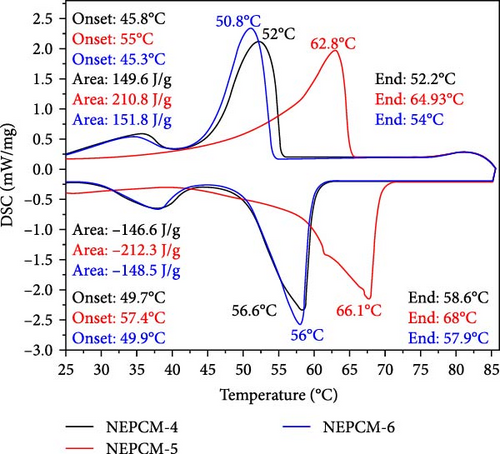
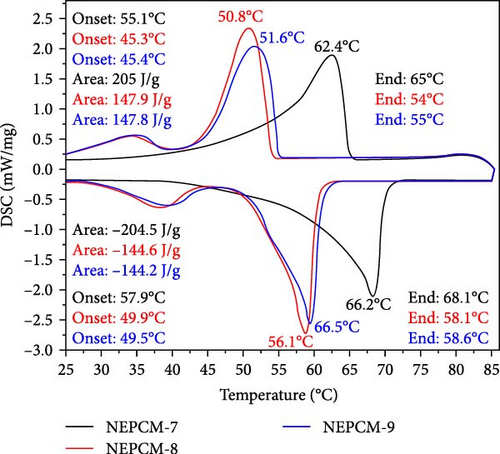
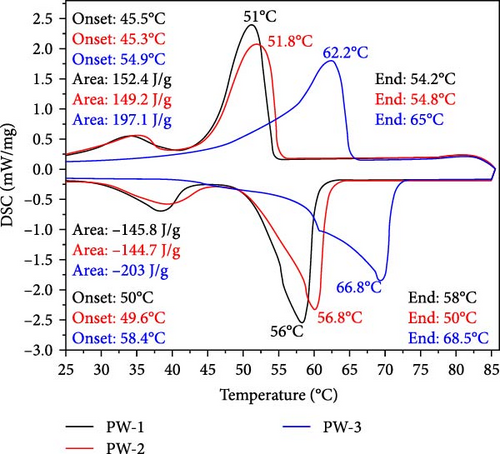
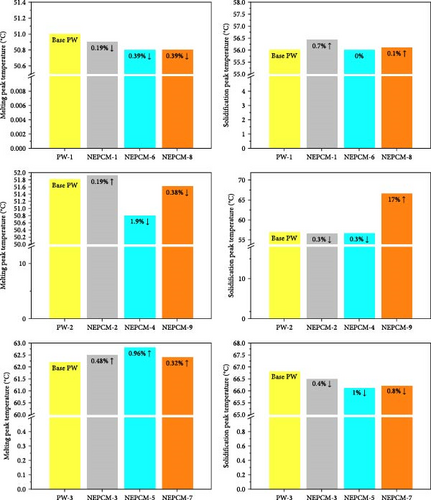
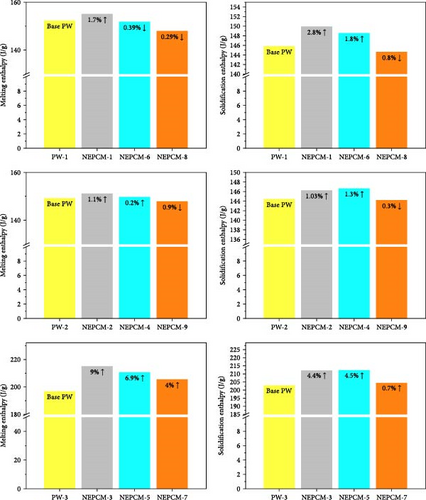
The latent heat and thermomechanics during the melting and solidification process are illustrated and summarized in Figure 4 and Table 3, respectively. Figures 5 and 6 present a comprehensive comparison of the peak temperatures of the melting and solidification processes, along with the corresponding enthalpies. No significant changes were observed in the peak melting temperatures of all the NEPCM samples synthesized herein in reference to their base PCM. In Figure 4, it can be observed that all NEPCM samples synthesized from base PCM (PW-1 and PW-2) including their base PCM exhibit phase shifts for which the sharp peak represents the solid–liquid phase change (melting temperature), and the minor peak on the left of sharp peak corresponds to the solid–solid phase transition of PCM/NEPCM (transition temperature). This solid–solid phase transition refers to a shift between different solid phases of paraffin wax because paraffin wax exhibits polymorphism, indicating the ability to exist in various crystal structures or phases in the solid state. This phenomenon is common in high concentrated PCMs. The transition between these phases involves changes in the arrangement of molecules in the crystal lattice [36, 50].
| Thermal properties | NEPCM-1 | NEPCM-2 | NEPCM-3 | NEPCM-4 | NEPCM-5 | NEPCM-6 | NEPCM-7 | NEPCM-8 | NEPCM-9 | PW-1 (Base PCM) |
PW-2 (Base PCM) |
PW-3 (Base PCM) |
|---|---|---|---|---|---|---|---|---|---|---|---|---|
| Melting onset (°C) | 45.4 | 45.6 | 55 | 45.8 | 55 | 45.3 | 55.1 | 45.3 | 45.4 | 45.5 | 45.3 | 54.9 |
| Melting endset (°C) | 54.2 | 55.3 | 65 | 52.2 | 64.9 | 54 | 65 | 54 | 55 | 54.2 | 54.8 | 65 |
| Melting (peak value) (°C) | 50.9 | 51.9 | 62.5 | 50.8 | 62.8 | 50.8 | 62.4 | 50.8 | 51.6 | 51 | 51.8 | 62.2 |
| Melting enthalpy (J/g) | 155 | 150.9 | 215 | 149.6 | 210.8 | 151.8 | 205 | 147.9 | 147.8 | 152.4 | 149.2 | 197.1 |
| Solidification onset (°C) | 50.5 | 49.7 | 58 | 49.7 | 57.4 | 49.9 | 57.9 | 49.9 | 49.5 | 50 | 49.6 | 58.4 |
| Solidification endset (°C) | 58.3 | 58.8 | 68.4 | 58.6 | 68 | 57.9 | 68.1 | 58.1 | 58.6 | 58 | 50 | 68.5 |
| Solidification (peak value) (°C) | 56.4 | 56.6 | 66.5 | 56.6 | 66.1 | 56 | 66.2 | 56.1 | 66.5 | 56 | 56.8 | 66.8 |
| Solidification enthalpy (J/g) | 149.9 | 146.2 | 212 | 146.6 | 212.3 | 148.5 | 204.5 | 144.6 | 144.2 | 145.8 | 144.7 | 203 |
Across all the NEPCMs, the peak melting temperatures increased by 0.19%–0.96% or decreased by 0.19%–1.96%. In a similar comparison, the peak solidification temperature of NEPCM-9 increased by a substantial 17% relative to that of its base PCM. Unexpectedly, the peak solidification temperature of NEPCM-6 did not change despite the incorporation of CuO nanoparticles. The increases and decreases in the peak solidification temperatures of the samples ranged from 0.1% to 17% and 0.3% to 1%, respectively. The observations of phase change temperature correlate with existing literature because the incorporation of relatively higher thermal conductive nanoparticles in PCM alters the peak phase change temperatures of PCM due to enhanced heat transfer, crystallization kinetics, and nucleation effects [51]. The specific impact on peak phase change temperature depends on factors like nanoparticle concentration, dispersion, and the intrinsic properties of the PCM. Notably, the solidification peak temperature increases with a higher weight percentage of nanoparticles [52, 53]. In this study, NEPCM-9, synthesized by mixing CuO with the highest concentration as well as particle size, leading to more nucleation sites, exhibits the highest improvement in solidification peak temperature compared to other samples.
In our observation of phase transition enthalpy, notably, the enthalpy of melting and solidification of the PCM emerged as critical parameters that could be directly correlated to its thermal energy storage and release capacities.
Materials with higher melting and solidification enthalpies can store and release more energy during phase transitions, which makes them suitable for use in efficient LHTES applications. From this perspective, Figure 6 depicts a diverse trend in terms of changes in the melting enthalpy of all samples. The melting enthalpy of most of the NEPCM samples increased, but those of a few samples decreased.
The maximum reduction in the melting enthalpy of an NEPCM relative to that of its base PCM was 0.9% in the case of NEPCM-9. This was the most substantial decrease among all the NEPCM samples, and it can be disregarded on account of its nominal significance.
In terms of energy storage capacity enhancement, the three NEPCM samples synthesized using PW-3 (NEPCM-3, NEPCM-5, and NEPCM-7) exhibited consistent rises in melting enthalpy as compared to their base PCM. Furthermore, across these three NEPCM samples, the trends of increase in melting enthalpy were aligned with the increased CuO nanoparticle size. This above trend was reversed when considering the composition by wt.% of CuO and SPAN-80 in the base PCM (PW-3). The observed reduction in latent heat during phase transitions, as a result of an increased mass fraction of CuO in all NEPCMs except NEPCM-4, closely aligns with the findings by Wang et al. [12]. The deviations from these trends in NEPCM-4 may be indicative of the influence of other synthesis parameters, such as the melting temperature of the pure PCM, nanoparticle size, and the mass fraction of surfactant within the pure PCM.
The phenomenon of reduction in latent heat during phase transitions can be attributed to the heat conductive core of CuO, which augments the surface area of the paraffin wax. The small size of nanoparticles significantly increases their specific surface area, fostering a greater number of contact points between the nanoparticles and paraffin molecules. Consequently, the presence of nanoparticles influences a higher proportion of paraffin molecules, leading to alterations in their phase transition behavior.
Van der Waals forces play a crucial role in this process by modifying the way paraffin molecules arrange themselves during phase transitions. This alteration in molecular arrangement can directly impact the latent heat of the paraffin, as it pertains to the energy required for molecules to transition from one phase (e.g., solid) to another (e.g., liquid). Consistent with previous observations pertaining to solidification enthalpy, the highest increase in solidification enthalpy was 4.5% for NEPCM-5 relative to that of its base PCM. Additionally, the highest decrease was 0.8% for NEPCM-8 relative to that of its base PCM.
3.2. Thermal Stability Analysis
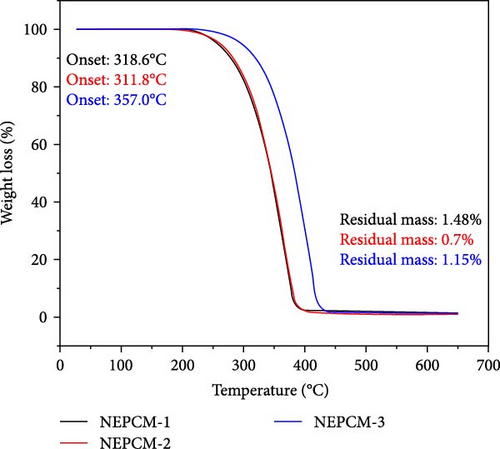
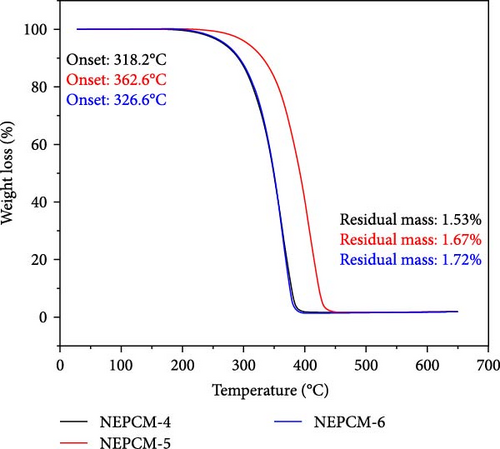
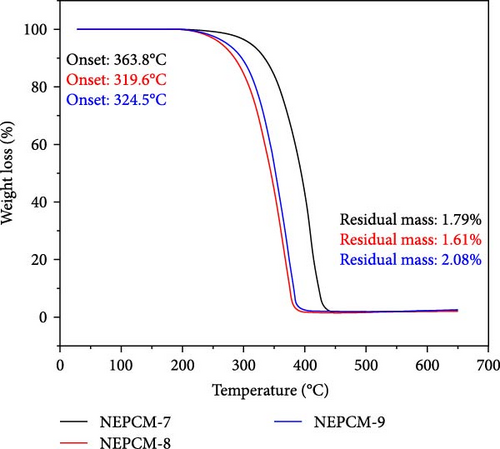
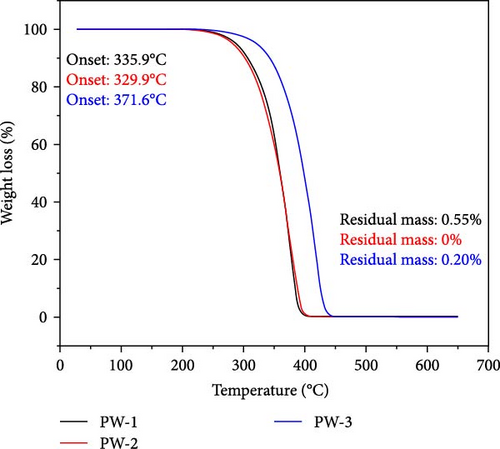
The findings of the TGA investigation are depicted in Figure 7 and summarized numerically in Table 4. These observations offer valuable insights into two major aspects: weight loss onset temperatures and residual masses of both the pure PCM and NEPCM samples.
| NEPCM | Degradation onset temperature (°C) |
Percentage change in degradation onset temperature relative to base PCM (%) | Residual mass at 650°C (%) |
|---|---|---|---|
| NEPCM-1 | 318.6 | −5.1 | 1.48 |
| NEPCM-2 | 311.8 | −5.4 | 0.7 |
| NEPCM-3 | 357 | −3.9 | 1.15 |
| NEPCM-4 | 318.2 | −3.5 | 1.53 |
| NEPCM-5 | 362.6 | −2.4 | 1.67 |
| NEPCM-6 | 326.6 | −2.7 | 1.72 |
| NEPCM-7 | 363.8 | −2.0 | 1.79 |
| NEPCM-8 | 319.6 | −4.8 | 1.61 |
| NEPCM-9 | 324.5 | −1.6 | 2.08 |
| PW-1 (base PCM) | 335.9 | — | 0.55 |
| PW-2 (base PCM) | 329.9 | — | 0 |
| PW-3 (base PCM) | 371.6 | — | 0.2 |
Remarkably, all the NEPCMs started to degrade at lower temperatures relative to those of their respective base PCMs. Subsequently, the residual mass percentages of all NEPCM samples increased remarkably.
Notably, the degradation onsets of the NEPCMs were slightly advanced compared to those of the corresponding pure PCM samples. The high surface area and nucleation-promoting properties of metal oxide nanoparticles reduce the energy barrier for phase transition, leading to a lower transition temperature. Furthermore, the improved thermal conductivity of the PCM due to the presence of nanoparticles ensures more efficient heat conduction and a more uniform heat distribution, ultimately resulting in a reduced phase transition temperature. Interactions at the nanoscale between the nanoparticles and the PCM affect thermodynamic properties, including intermolecular forces, contributing to alterations in the energy required for the phase transition [54, 55].
The range of this initial degradation was relatively narrow, spanning between 1.6% and 5.4% across all the NEPCMs. While all samples exhibited slightly lower degradation onset temperatures compared to those of their respective base PCMs, the NEPCM samples synthesized from PW-3 stood out. In direct comparisons with all other NEPCMs, those derived from PW-3 exhibited elevated degradation onset temperatures and enhanced residual masses. However, the residual mass of only the NEPCM-9 sample was greater than those of the NEPCM-3, NEPCM-5, and NEPCM-7 samples, but its degradation temperature was significantly lower.
3.3. Thermal Conductivity Analysis
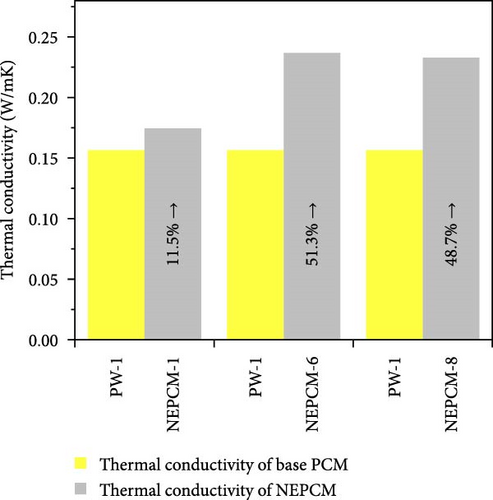
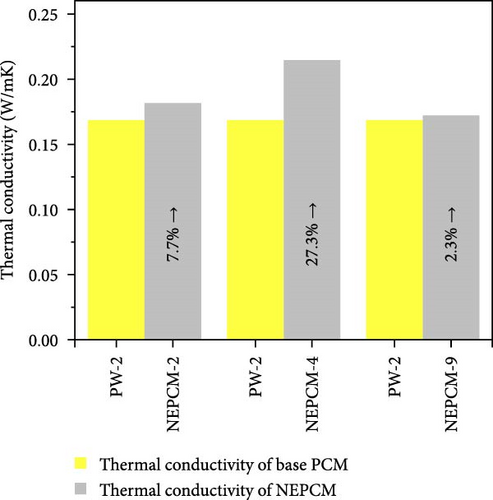
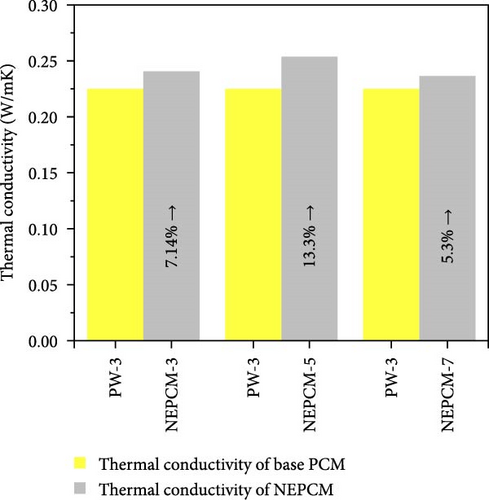
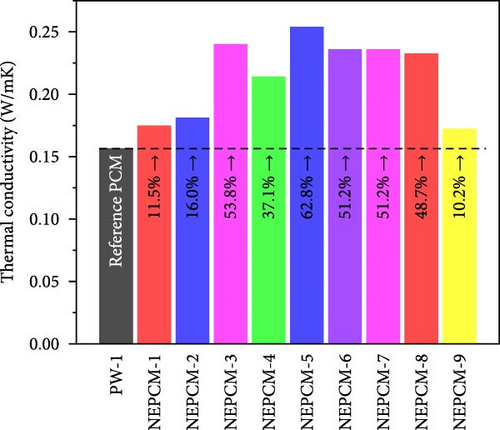
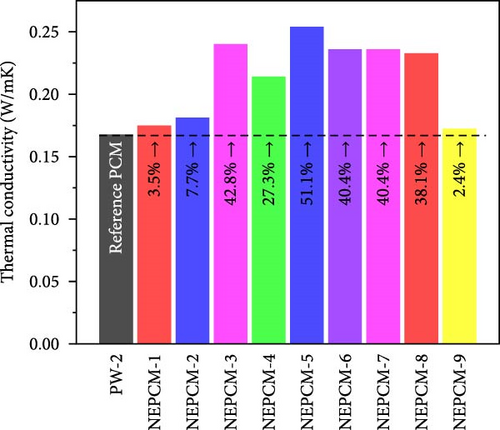
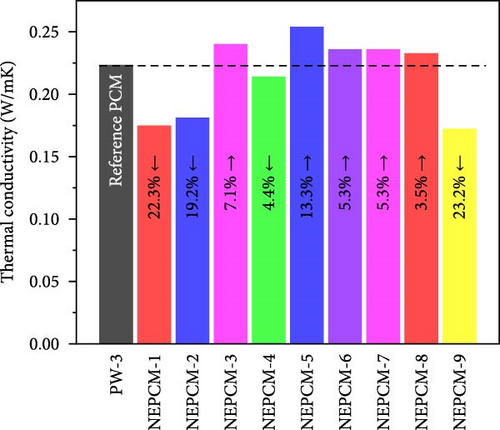
The experimental measure of thermal conductivity at 35°C for NEPCMs and their base PCM is presented in Table 5. Moreover, in addition to presenting the individual thermal conductivity, a comparative analysis of thermal conductivity concerning the base PCM (Figures 8(a), 8(b), and 8(c)) as well as with reference PCM (Figures 8(d), 8(e), and 8(f)) is also presented. In the present research work, all pure PCMs except considering base PCM for any of NEPCM have been denoted as reference PCMs for that specific NEPCM.
| NEPCM labels | Thermal conductivity of base PCM (W/mK) |
Thermal conductivity of NEPCM (W/mK) |
Improvement in thermal conductivity (%) |
|---|---|---|---|
| NEPCM-1 | 0.156 | 0.174 | 11.54 |
| NEPCM-2 | 0.168 | 0.181 | 7.74 |
| NEPCM-3 | 0.224 | 0.240 | 7.14 |
| NEPCM-4 | 0.168 | 0.214 | 27.38 |
| NEPCM-5 | 0.224 | 0.254 | 13.39 |
| NEPCM-6 | 0.156 | 0.236 | 51.28 |
| NEPCM-7 | 0.224 | 0.236 | 5.36 |
| NEPCM-8 | 0.156 | 0.232 | 48.72 |
| NEPCM-9 | 0.168 | 0.172 | 2.38 |
The measured thermal conductivity of the various NEPCM samples, along with those of their base and reference PCMs, revealed interesting trends and variations. Importantly, it has been observed that in each HHPCM sample, thermal conductivity increases relative to its base PCM due to fundamental factors such as thermal bridging, reduced phonon scattering, and increased surface-to-volume ratio [56].
Upon analysis, it was evident that the NEPCM samples exhibited a range of thermal conductivities, with NEPCM-5 exhibiting the highest value of 0.254 w/mK, followed closely by NEPCM-3 with a value of 0.24 w/mK. By contrast, NEPCM-1 and NEPCM-9 exhibit the lowest thermal conductivities of 0.174 and 0.172 w/mK, respectively, among all the NEPCM samples. A comparison between these values and those of the pure paraffin waxes used as the base PCMs (PW-1, PW-2, and PW-3) and reference PCMs indicated that NEPCM-5 had the highest thermal conductivity relative to those of its base PCM and other reference PCMs. While the percentage increase in the thermal conductivity of NEPCM-5 relative to that of its base PCM was notable, it was lower than those observed for NEPCM-4, NEPCM-6, and NEPCM-8 relative to those of their respective base PCMs. Interestingly, NEPCM-6 exhibited the highest percentage improvement in thermal conductivity of ~51.28% relative to that of its base PCM.
In addition to the above intrabase PCM comparison, three other comparisons (Figures 8(d), 8(e), and 8(f)) of all NEPCMs separately with the three pure PCMs (reference PCMs) were performed to understand the overall performance of the proposed synthesis system. Intrabase PCM comparisons are comparisons of the thermal conductivities of the NEPCMs with those of their respective base PCMs. Overall, these comparisons revealed that the highest increase in thermal conductivity of 62.8% occurred in the case of NEPCM-5 relative to that of its base PCM PW-1. Conversely, the thermal conductivity of certain NEPCM samples decreased notably relative to those of the reference PCMs rather than those of their respective base PCMs. The highest decrease of 23.3% was observed for NEPCM-9 relative to that of the reference PCM PW-3. The overall comparison can serve as a valuable guide for the synthesis of NEPCMs. Moreover, it can be used to recommend a specific pure PCM to synthesize a nano-enhanced PCM. This would allow individuals to determine which synthesis approach paired with a particular pure PCM would yield the most significant enhancement in thermal conductivity.
3.4. Optimization of NEPCM Synthesis Parameters
Apart from improving the thermal conductivity of the synthesized NEPCMs, two other factors, namely, latent heat of the melting process (LHMP) and latent heat of the solidification process (LHSP), were considered major objectives from the perspective of optimizing the NEPCM synthesis process. LHMP and LHSP are two crucial factors that significantly affect the thermal energy storage and release capacities of PCMs. These two properties define the ability of a PCM to absorb and release thermal energy during phase transitions. PCMs with higher LHMP and LHSP values can store and release greater amounts of thermal energy during phase transitions, thereby making them effective for use in thermal energy storage applications.
In most cases, enhancing the thermal conductivity of a PCM through CuO nano-incorporation tends to decrease the LHMP and LHSP of the material [12, 35, 57, 58, 59, 60]. In the investigations conducted herein, it was observed that by employing an innovative strategy, the above concerns can be mitigated effectively. The approach adopted herein is based on sequential comparisons and elimination, as discussed in the previous subsections. The outcomes of these step-by-step comparisons eliminate undesirable combinations of NEPCM synthesis parameters, thus helping achieve the optimization objectives. The selected NEPCMs exhibited the potential to simultaneously achieve all the optimization objectives depicted in Figure 9.
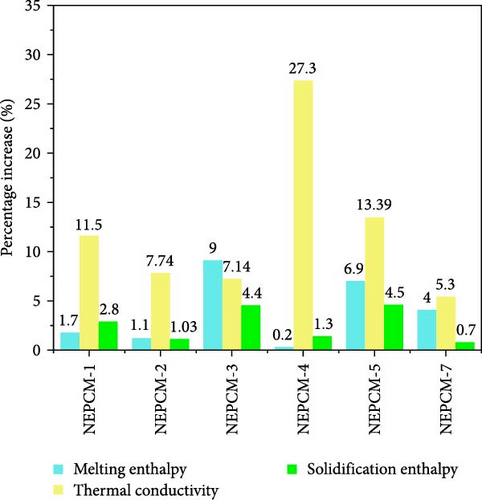
According to Figure 9, all preferred NEPCMs exhibited trends of increase for all three objectives of the NEPCM synthesis process. The objectives were to increase thermal conductivity, LHMP, and LHSP. Additionally, and importantly, even the NEPCM exhibiting the highest increase in thermal conductivity, albeit compromised LHMP and LHSP, was not included in the category of optimally synthesized NEPCMs. The elimination of such samples is the main purpose of the aforementioned optimization process.
We move to the question identifying the sample that can be considered the most optimal from the perspective of achieving all the targeted objectives. In this regard, the decision ultimately hinges on the application requirements and end uses of the NEPCMs. If the application primarily demands rapid heat transfer kinetics, NEPCM-4 is the perfect choice. Conversely, if the focus is on large energy storage capacity, NEPCM-5 is the ideal choice.
3.5. Analysis of Variance (ANOVA)
ANOVA is a statistical method crucial for assessing individual contributions of independent parameters to system performance. It determines the significance of each parameter’s impact on the response and validates the experimental results. In the present ANOVA analysis, this approach is utilized to understand the impact of independent parameters on thermal conductivity of NEPCM. Four control factors, presented in Table 6, are selected with three-level design parameters.
| Factors | Level 1 | Level 2 | Level 3 |
|---|---|---|---|
| PW melting temperature (°C) | 51 | 51.8 | 62.2 |
| CuO particle size (nm) | 10 | 40 | 80 |
| CuO (wt.%) | 0.3 | 0.6 | 0.9 |
| Surfactant (wt.%) | 0.3 | 0.6 | 0.9 |
Table 7 presents ANOVA-transformed response which reinforced the reliability of the results. The increasing F value of the independent parameters indicates their significant increase impact on the response value. The influence percentages of each factor are calculated based on the ANOVA F value results and presented with a 95% confidence level.
| Parameters | DOF | Sequential sum of squares (SS) | Adjusted mean squares (MS) | F value | P-values | Contribution (%) |
|---|---|---|---|---|---|---|
| PW melting temperature | 2 | 0.004438 | 0.002219 | 3.54 | 0.220 | 55.45 |
| CuO particle size | 2 | 0.000310 | 0.000155 | 0.25 | 0.802 | 3.87 |
| Surfactant (wt.%) | 2 | 0.002000 | 0.001000 | 1.59 | 0.386 | 25.0 |
| Error | 2 | 0.001255 | 0.000627 | — | — | 15.68 |
| Total | 8 | 0.008002 | — | — | — | 100 |
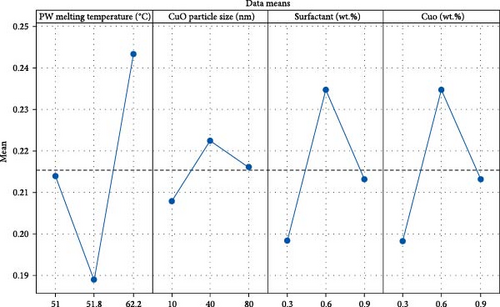
The analysis reveals a significant impact of PW melting temperature on thermal conductivity of NEPCM and also shows the highest F value of 3.54 as well as contributing 55.45% to NEPCM thermal conductivity. Further, surfactant wt.% shows their significance as 25%, while the CuO nanoparticle size has the lowest contribution of 3.87%. The trend and ranking align with design of experiments, highlighting PW melting temperature as the most influential factor in all experiments. Subsequently, fraction weight of surfactant and CuO particle size emerges as the pivotal parameter for the NEPCM thermal conductivity, bearing statistical and physical significance. In the current ANOVA analysis, the presence of perfect multicollinearity needs to be acknowledged, stemming from the deliberate choice in experimental design to maintain identical levels for two pivotal factors: wt.% of CuO nanoparticles and surfactant. The perfect multicollinearity in ANOVA refers to a condition where two or more independent variables in a statistical model are highly correlated, leading to difficulties in estimating their individual effects on the dependent variable. The literature proposes a straightforward approach being the elimination of one of the collinear variables to avoid the multicollinearity effect during general linear modeling [62, 63]. To mitigate the issue, the wt.% of CuO nanoparticle has been overlooked during general linear modeling with the assumption that similar response trends would be exhibited due to same levels two factors with perfect multicollinearity. The validation of this assumption is evident in the main effect plot illustrated in Figure 10, where both the surfactant and CuO wt.% exhibit similar trends in thermal conductivity. Moreover, recognizing this inherent limitation during the present analysis of perfect multicollinearity, future research endeavors may enhance experimental design strategies to effectively mitigate multicollinearity, thereby yielding a more comprehensive understanding of the effects of these factors on the response variable. Additionally, variance inflation factor (VIF), a coefficient used to evaluate multicollinearity among predictor variables, reaches a maximum of VIF = 1.33 in the present analyzed model. This result suggests the absence of significant multicollinearity among the other independent variables in the model [62, 63].
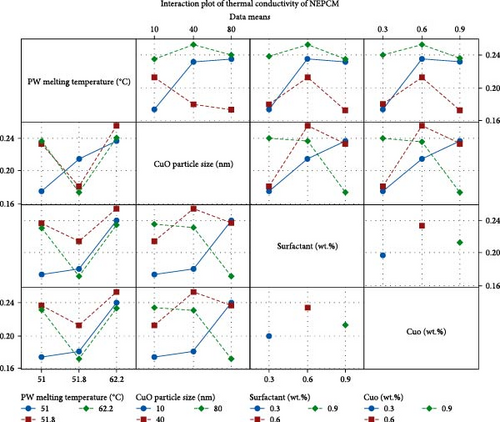
The interaction plot in Figure 11 illustrates the simultaneous impact of any two independent variables on the thermal conductivity of NEPCM. Each line represents a distinct interaction level determined by the thermal conductivity parameters. Positive gradients denote an increase in thermal conductivity, while negative gradients signify a decrease. Two parallel lines denote no interaction between the independent variables, while intersecting lines underscore the significance of their interaction. The interaction plot reveals significant interactions among most parameters within their designated levels. Overall, the ANOVA results validate the experimental design approach, reinforcing the findings obtained through fractional factorial design and establishing a robust concordance between the two methodologies.
3.6. Comparative Study Using Similar Approach
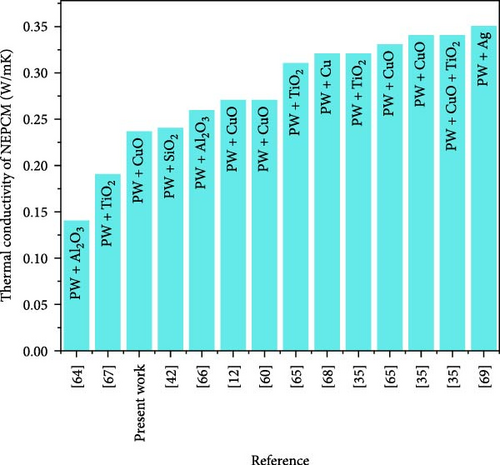
The nano-enhancement of PCMs is a well-established technology for thermal conductivity enhancement, but there remains considerable potential for comprehensively exploring all the relevant parameters. Table 8 and Figure 12 showcase the substantial progress made herein relative to the relevant results reported in the literature. Significantly, the current study was found to be closely aligned to a prior study [35] that focused on thermal conductivity enhancement. It was found that the use of a high melting temperature base PCM coupled with a high concentration of nanoparticles led to a substantial increase in thermal conductivity. However, similar results were achieved by using a base PCM with a considerably lower melting temperature and a significantly lower concentration of nanoparticles. This comparison highlights that to achieve higher thermal conductivity, one need not use high melting temperature base PCMs and high nanoparticle concentrations.
| Author | PW melting temperature (°C) |
Nanoparticles | Particle size (nm) | Nanoparticle concentration (wt.%) | Thermal conductivity of pure PW | Thermal conductivity of NEPCM | Thermal conductivity improvement (%) |
|---|---|---|---|---|---|---|---|
| Ho and Gao [64] | 26.5 | Al2O3 | 196 | 10 | 0.120 | 0.140 | 16.60 |
| Wang et al. [60] | 51.6 | CuO | 50 | 1.2 | 0.220 | 0.270 | 22.70 |
| Dsilva Winfred Rufuss et al. [65] | 46–48 | TiO2 | 160 | 0.3 | 0.260 | 0.320 | 23.00 |
| Dsilva Winfred Rufuss et al. [65] | 46–48 | CuO | 190 | 0.3 | 0.260 | 0.330 | 26.90 |
| Wang et al. [12] | 51–53 | CuO | 30 | 1.2 | 0.210 | 0.270 | 28.50 |
| Nourani et al. [66] | 50–60 | Al2O3 | 10–20 | 10 | 0.197 | 0.259 | 31.47 |
| Sami and Etesami [67] | 54–58 | TiO2 | 5–20 | 3 | 0.140 | 0.190 | 32.60 |
| Manoj Kumar et al. [42] | 63.74 | SiO2 | 15 | 2 | 0.180 | 0.240 | 33.34 |
| Harikrishnan et al. [35] | 60–62 | TiO2 | 21 | 1 | 0.230 | 0.310 | 34.70 |
| Lin and Al-Kayiem [68] | 60.4 | Cu | 20 | 2.04 | 0.172 | 0.320 | 46.30 |
| Harikrishnan et al. [35] | 60–62 | CuO | 21 | 1 | 0.230 | 0.340 | 47.80 |
| Harikrishnan et al. [35] | 60–62 | CuO+TiO2 | 21 | 1 | 0.230 | 0.340 | 47.80 |
| Sathyamurthy [69] | 60.6 | Ag | 50 | 2 | 0.210 | 0.350 | 66.60 |
| Present study | 51 | CuO | 80 | 0.6 | 0.156 | 0.236 | 51.20 |
- PW, paraffin wax; NEPCM, nano-enhanced phase-change materials.
Instead, it emphasizes the importance of comprehensively adjusting all other synthesis parameters to improve thermal conductivity. This finding highlights the significance of the present research.
4. Conclusions
- (1)
The significance of the present study becomes apparent when considering the outstanding outcomes achieved with NEPCM-3 and NEPCM-5, which originate from PCM with the highest melting temperatures, all at relatively low concentrations of CuO particles. These NEPCMs have showcased a remarkable 9% increase in melting enthalpy and a 4.5% increase in solidification enthalpy, respectively, underscoring their exceptional thermal storage and release capabilities even at lower concentration of nano-enhancement. This underscores the critical importance of precise synthesis parameter adjustment, particularly the melting temperature of the pure PCM, in obtaining optimal and desired results within a vast array of available combinations.
- (2)
Thermal stability analysis revealed minor reductions in degradation onset temperatures but increased residual mass, indicating overall improved thermal stability. Moreover, all the NEPCMs synthesized using a specific paraffin wax (PW-3) exhibited higher degradation onset temperatures and enhanced residual mass. These observations indicated that higher degradation temperature and greater residual mass can be realized by using PCM with a higher melting temperature.
- (3)
Nano-enhanced NEPCMs showed limited impact on peak melting and solidification temperatures. NEPCM-9 notably increased peak solidification temperature by 17%, whereas NEPCM-6 remained stable for peak melting, making them suitable for increased energy release capacity and consistent energy storage application, respectively.
- (4)
The comparison of NEPCM-6 and NEPCM-7, with significant difference in the melting temperatures of their base PCM, challenges the conventional assumptions. It brings a crucial revelation: the presence of a high concentration of smaller nanoparticles, even when combined with a base PCM featuring a high melting temperature, does not guarantee the highest level of thermal conductivity improvement.
- (5)
The results of optimization-based comparative analysis indicated that the incorporation of smaller nanoparticles into low-melting-temperature PCMs resulted in a more significant thermal conductivity enhancement. Conversely, for high melting temperature PCMs, the use of relatively larger nanoparticles led to increased capacities for energy storage and release, adjusting expectations for thermal conductivity enhancement.
- (6)
ANOVA analysis reveals significant contributions to NEPCM thermal conductivity, with PW melting temperature having the highest impact at 55.45%, and surfactant wt.% contributes 25%, while CuO particle size shows the lowest impact at 3.87%.
- (7)
Herein, we proposed a comprehensive approach that enables individuals regarding the synthesis process of high-performance PCMs under the constraint synthesis parameters. This approach aims to increase the thermal performance of materials through the combined effect of elevated thermal conductivity and increased heat storage and release capacities.
Overall, this study provides valuable insights into the complex relationships involved in the incorporation of nanoparticles into PCMs in terms of their multidimensional effects on the thermal properties of NEPCMs. The observed trends suggest that careful selection of nanoparticle characteristics and base PCM composition is crucial for achieving the desired enhancements in thermal properties, such as energy storage and release capacities and thermal conductivity.
5. Future Recommendations
A few unexpected findings highlighted the complex relationships between the NEPCM synthesis parameters. To understand the interactions between these parameters and their effects on output functions, one could use an appropriate parametric optimization technique to identify the optimal combination of synthesis parameters that yield the desired output from NEPCMs. Additionally, to mitigate multicollinearity during general linear modeling of ANOVA, future research should consider varying levels for CuO and surfactant wt.%, ensuring independent assessment of their effects.
Conflicts of Interest
The authors declare that they have no conflicts of interest.
Acknowledgments
This research was supported by the Basic Science Research Program through the National Research Foundation of Korea (NRF) funded by the Ministry of Education (RS-2023-00249523).
Open Research
Data Availability
The raw/processed data required to reproduce the above findings cannot be shared at this time as the data also form part of an ongoing study.


