Genome-Wide Association Study for High Milk Yield in Saudi Arabian Dromedary using Whole Genome Sequencing
Abstract
The camels have attracted scientific attention due to their unique agricultural characteristics and are used for a variety of purposes, including milk and meat production. To exploit their full potential, it is essential to improve our understanding of the genetic makeup of these animals. Advances in molecular breeding have expanded our knowledge of the genetic architecture of complex traits through genome-wide association studies (GWAS). This study aimed to identify genome-wide variants, annotate their functions, and examine the genetic variants linked to milk production in camels. We used whole-genome sequencing data of 61 dromedary camels to perform a genome-wide association study for investigated milk traits using a logistic regression model. After variant calling in all 61 genome samples and subsequent rigorous filtering processes, we identified 306,310 single nucleotide polymorphisms (SNPs) across all genomes. Among the 306,310 identified SNPs, a subset of 28 SNPs demonstrated statistical significance (p < 5 × 10⁻⁴) in association with milk traits in dromedaries. These significant SNPs were found within 13 locations of candidate genes, namely TYRP1, DLC1, GPC5, SLC24A4, NEMP2, and SLC14A1, suggesting their potential relevance to milk production characteristics in this species. The results of our GWAS unravel the complex genetic landscape of milk production in dromedary camels and provide a list of significant SNPs and candidate genes, providing valuable information for further investigations to understand the molecular mechanisms behind this important economic trait.
1. Introduction
The dromedary camel, scientifically known as Camelus dromedarius, stands as a testament to resilience and adaptability in some of the world’s harshest environments [1]. With origins dating back thousands of years, the story of the dromedary intertwines with human history, particularly in regions spanning Africa and Asia [1, 2]. This remarkable species, characterized by its distinctive single hump, has carved out a niche for itself in arid and semi-arid landscapes, where conventional livestock struggle to survive [3].
The domestication journey of the dromedary commenced around 3,000 B.C., with its roots firmly planted in South-East Arabia and South-West Central Asia [2]. Since then, it has become an indispensable part of the socioeconomic fabric of numerous nations across the globe [4]. From serving as a primary source of transportation and livelihood for nomadic communities to providing sustenance in the form of milk and meat, the dromedary camel holds multifaceted importance [5, 6].
Pedigree-based and genomic selection methodologies offer promising avenues for enhancing camel genetics [7, 8]. However, the identification of pivotal genes and genomic regions associated with growth and production traits remains imperative [7]. Such investigations elucidate the intricate genetic underpinnings of these characteristics, thereby refining selection strategies [9]. Genome-wide association studies (GWAS) have emerged as a standard approach for uncovering candidate genes and tightly delineated genomic loci correlated with phenotypic traits of interest [9]. A robust GWAS necessitates not only phenotypic records but also a comprehensive array of genetic markers [10].
The advent of high-density single nucleotide polymorphism (SNP) arrays has revolutionized this landscape, significantly altering breeding programs and disease-mapping endeavors in domesticated animals [11, 12, 13]. Notably, a dromedary camel-specific SNP chip has yet to be developed [14]. Genotyping via whole-genome sequencing (WGS) presents a cost-effective alternative for capturing all SNPs without reliance on SNP chips [15]. Compared to SNP arrays, WGS affords a broader spectrum of genetic information encompassing SNPs, copy number variations, insertions, and deletions [15]. Decreasing sequencing costs have rendered WGS increasingly accessible, facilitating the sequencing and genotyping of entire cohorts and thereby streamlining GWAS [16]. This methodology holds particular appeal for enhancing traits in unconventional species such as camels.
Research investigating genetic associations with traits in camels remains relatively limited in scope. Almutairi et al. [17] conducted a quantitative genetic analysis focusing on growth and milk production traits within a Saudi camel population. Utilizing phenotypic and pedigree data, their study provided insights into heritability estimates and other relevant genetic parameters. Furthermore, several studies have explored associations between specific candidate genes and traits of interest. Afifi et al. [18] investigated the relationship between the growth hormone gene and body weight in dromedary camels, Guo et al. [19] conducted a GWAS focusing on hematological traits in the Bactrian camel population in China, Bitaraf Sani et al. [20] undertook a GWAS targeting an Iranian dromedary cohort, specifically examining birth weight and average growth.
The duration of milk production in camels ranges from 9 to 18 months, contingent upon various factors, including breed, health status, lactation stage, and environmental conditions [21]. Despite possessing an udder structure similar to that of cows, camels typically yield lower milk quantities compared to cows, albeit with a higher consistency in milk quality. However, enhancements in dietary regimen, water provision, and veterinary care have demonstrated efficacy in augmenting camel milk output [22].
The present study was meticulously designed to perform a comprehensive GWAS utilizing WGS-enabled genotyping, thereby elucidating the genetic underpinnings of milk production in dromedary camels. In addition to delineating the genetic diversity within camels contributing to such variations, the study aims to identify specific genetic markers associated with enhanced milk yield, which could be leveraged for breeding programs to improve dairy production in this species.
2. Materials and Methods
2.1. Ethical Statement
The animal study protocol was approved by the Research Ethics Committee of the King Saud University, Riyadh, Saudi Arabia (Ethic Reference No: KSU-SE-23-93, 19/10/2023).
2.2. Animals and Sampling
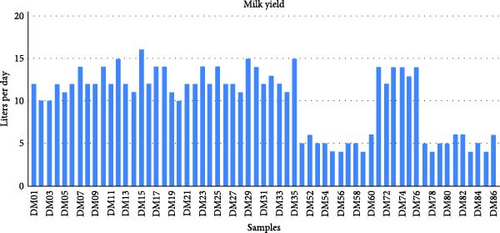
In this study, a cohort of 61 female dromedary camels of the Majaheem breed, raised from birth within a controlled environment at Al-Jawf, situated in northern Saudi Arabia, was meticulously selected and examined. These camels were under the care of Al Watania Agriculture Company, the premier commercial enterprise specializing in camel milk production in Saudi Arabia (https://www.watania-agri.com). To ensure homogeneity, the camels were subjected to consistent environmental conditions, as well as a standardized feeding and management regimen. The animals were primarily of equivalent age, representing a cohesive cohort. Our investigation focused on the lactation cycle corresponding to the second birth of the camels, providing a standardized framework for evaluating milk production. Within this cohort, 41 camels were identified as high milk producers, while the remaining 20 were categorized as low milk producers based on their daily milk yield. Specifically, those producing 10 L or more per day were classified as high milk producers, whereas those yielding 5 L or less per day were designated as low milk producers. Figure 1 illustrates the daily average milk yield per camel.
A total volume of 3 mL of blood was obtained from each dromedary camel via the jugular vein. The blood collection procedure was facilitated using vacutainer tubes containing EDTA as an anticoagulant. Collected blood samples were subsequently stored at −80°C until DNA extraction.
2.3. DNA Extraction
DNA extraction from blood samples was conducted using a semi-automated DNA extraction apparatus (Maxwell, Promega, USA) equipped with Maxwell RSC cartridges (Promega, USA) following the protocol outlined in the study by Wu et al. [23]. Subsequent to the extraction process, the concentration of DNA was quantified utilizing the QuantiFluor dsDNA System (Promega, USA) and Quantus Fluorometer (Promega, USA). Gel electrophoresis was employed to assess the quality and level of degradation of the DNA samples using Gel Electrophoresis Equipment (ThermoFisher Scientific, USA), ensuring their suitability for subsequent analyses.
2.4. WGS
All DNA samples were sent to BGI, China (May 12, 2023; https://en.genomics.cn/) for WGS using Illumina HiSeq 2500. After WGS, we received raw data in FASTQ format for each sample from BGI.
2.5. Bioinformatics Analyses
Our bioinformatics analysis commenced with preliminary steps, which involved assessing each raw sample using the FastQC tool [24] to identify any presence of adapters, unknown sequences, or low-quality nucleotides that could potentially compromise sequencing data integrity. To enhance data quality, the SOAPnuke tool [25] was utilized, employing filtering parameters set as “filter -n 0.1 -l 20 -q 0.5 -Q 2 -G.” Reads containing over 50% adaptor sequences, those with more than 50% of bases having a Phred quality score below 20, and reads containing at least 2% “N” bases were discarded based on these specified criteria. After a stringent filtration process, 3% of the bases in each genome were discarded due to poor sequencing quality. The samples yielded approximately 385 million sequencing reads and approximately 57 billion bases on average. After cleaning, these figures were reduced to 373 million reads and 56 billion bases, marking a 2.95% difference. The average GC content, Q30 quality score, and mapping rate across all samples were 42.40%, 97.07%, and 99.81%, respectively.
The BWA tool, developed by Li and Durbin in 2009 [26], was employed for aligning sequencing reads to the CamDro3 reference genome, available at https://www.ncbi.nlm.nih.gov/assembly/GCF_000803125.2, which represents the genetic assembly of the dromedary camel at the chromosomal level.
The BWA algorithm, known for its accuracy and minimal error rates, facilitated the alignment of short nucleotide sequences to the extensive reference genome. The resulting alignments were stored in the sequence alignment/map (SAM) format for subsequent analysis using SAMtools [27, 28], with alignment parameters set as “-t 66 -M -Y -R.”. 66 threads (-t 66) were used for alignment to speed up the alignment process, -M is used to mark shorter splits as secondary alignment, -Y parameter is used to produce output in the YML format and -R parameter specifies the read group information. The subsequent steps involved processing the alignment data, which included indexing the reference genome, generating binary alignment/map (BAM) files, and sorting these files based on genomic coordinates using SAMtools. The BAM files were structured according to appropriate tags such as “@RG ID:GroupID SM:SampleID PL:ISEQ LB:libraryID.”
For SNP detection and categorization, the GATK program developed by the Broad Institute [29] was employed. The process included marking duplicate entries using Picard, identifying genetic variant call format (GVCF) sites across multiple samples with GATK’s HaplotypeCaller, and subsequent variant calling with GATK’s GenotypeGVCFs, focusing primarily on SNPs and insertions and deletions (InDels). The SNPs and InDels were filtered using specified criteria, and variant annotation was performed using Annovar [30], cross-referencing with the GFF file of the CamDro3 reference genome.
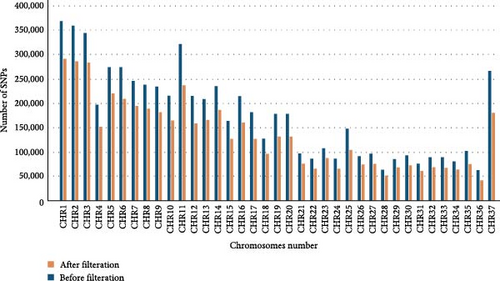
The filtration criteria for SNP calling were defined as follows: variants were filtered if they met any of the following conditions: QD (quality by depth ratio) < 2.0, indicating poor quality relative to the depth of coverage; FS (FisherStrand) > 60.0, suggesting a significant bias towards one strand, potentially indicative of sequencing or mapping artifacts; MQ (mapping quality) < 40.0, reflecting uncertain alignment; MQRankSum < −12.5, indicating discrepancies in mapping quality rank sum; or ReadPosRankSum < −8.0, representing biases in the position of variants within reads. Figure 2 illustrates the comparison of the number of SNPs in each chromosome before and after filtration.
2.6. GWAS
In the GWAS analysis methodology, a critical phase involved quality control (QC) procedures to ensure the integrity and reliability of the data. Each SNP within individual camel genomes underwent meticulous evaluation against stringent criteria. SNPs with a missingness rate exceeding 0.05, a minor allele frequency lower than 0.01, or displaying deviation from Hardy–Weinberg Equilibrium at a threshold of 0.001 were excluded from the dataset. These measures were imperative for eliminating potentially erroneous or low-quality variants. The QC process relied on the capabilities of the PLINK software, as detailed by Chang et al. [31] and Purcell et al. [32].
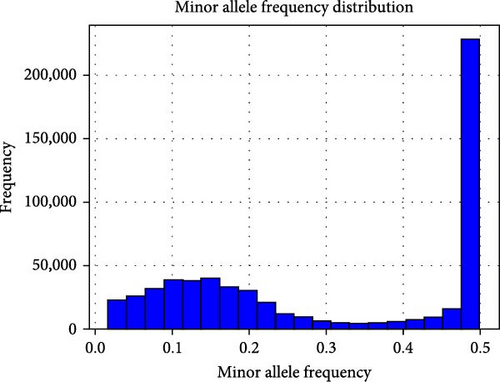
Initially, 8,708,152 SNPs were discovered in the samples. After the filtration process, such as minor allele frequency, as shown in Figure 3(a), a cumulative count of 306,310 SNPs was retained. Of the individual samples examined, 93.63% exhibited homozygosity, while 6.36% displayed heterozygosity. The transition to transversion ratio calculation yielded a value of 1.702. Figure 3 showcases the frequency distribution of minor alleles across the sampled genetic variants.
A SNP-by-SNP approach was used, fitting a model for each SNP individually. The significance threshold used was p < 5 × 10⁻⁴, applying Bonferroni’s correction for multiple tests to control for false positives.
3. Results
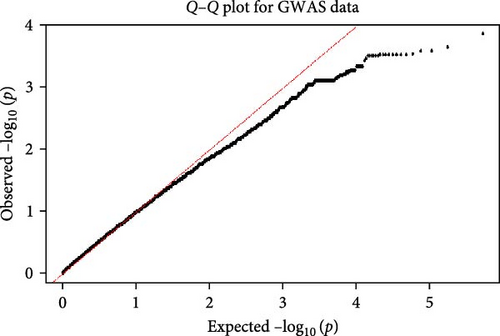
In GWAS, a comprehensive set of 306,310 SNPs passed stringent QC measures. These SNPs were characterized by an average physical distance of approximately 29.78 kilobases (kb) between adjacent markers. Utilizing a logistic regression model, we assessed the association between these SNPs and the high milk production trait. However, only 28 SNPs exhibited statistical significance, reaching a stringent threshold of p < 5 × 10⁻⁴, as depicted in Figure 4. Initial observations indicated a concordance between observed and expected p-values, underscoring the reliability of our statistical analyses, as depicted in Figure 5.
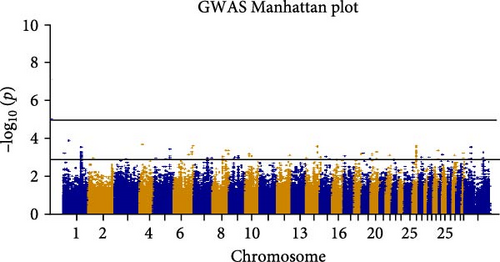
In our investigation, 28 SNPs were identified as having a significant association with milk traits. After annotation, 13 SNPs were found in specific protein-coding genes, whereas the remaining SNPs were located throughout noncoding sections of the genome. These encompass the TYRP1 gene on chromosome 4, the SLC24A4 gene on chromosome 6, the DLC1 gene on chromosome 26, and the multiple SNPs of the SLC14A1 gene on chromosome 30 (Table 1). Meanwhile, specific chromosomes such as chromosomes 8 and 37 exhibited a low frequency of SNPs. Nonetheless, their statistical significance did not meet the thresholds, highlighting their potential genomic relevance.
| SNP no. | Chromosome location | SNP location | Ref | Alt | p-Value | Annotation |
|---|---|---|---|---|---|---|
| 1 | 1 | 28707390 | A | T | 0.000138 | — |
| 2 | 1 | 86876799 | G | C | 0.0002972 | — |
| 3 | 1 | 86881570 | G | A | 0.0002972 | — |
| 4 | 1 | 86894889 | C | A | 0.0002972 | — |
| 5 | 1 | 86900773 | G | A | 0.0002972 | — |
| 6 | 1 | 86901278 | A | C | 0.0002972 | — |
| 7 | 1 | 86946143 | G | C | 0.0002972 | — |
| 8 | 1 | 86949627 | C | T | 0.0002972 | — |
| 9 | 1 | 86950309 | T | C | 0.0002972 | — |
| 10 | 4 | 13545645 | A | G | 0.0002238 | TYRP1 |
| 11 | 5 | 77930069 | T | C | 0.0003746 | NEMP2 |
| 12 | 6 | 91023613 | C | T | 0.0002566 | — |
| 13 | 6 | 86443613 | C | T | 0.0003426 | SLC24A4 |
| 14 | 8 | 76541073 | A | G | 0.0004582 | — |
| 15 | 8 | 65708503 | A | C | 0.0004621 | — |
| 16 | 14 | 54844304 | C | T | 0.0002922 | GPC5 |
| 17 | 26 | 11759465 | T | C | 0.0002625 | DLC1 |
| 18 | 26 | 11726394 | C | A | 0.0003143 | DLC1 |
| 19 | 26 | 11753505 | C | A | 0.0003143 | DLC1 |
| 20 | 26 | 11754149 | A | G | 0.0003143 | DLC1 |
| 21 | 26 | 11769781 | A | G | 0.0003143 | DLC1 |
| 22 | 26 | 11772849 | C | T | 0.0003143 | DLC1 |
| 23 | 26 | 11745912 | C | A | 0.0004674 | DLC1 |
| 24 | 30 | 22679088 | A | G | 0.0004674 | SLC14A1 |
| 25 | 30 | 22680126 | T | C | 0.0004674 | SLC14A1 |
| 26 | 30 | 22691136 | C | T | 0.0004674 | — |
| 27 | 37 | 32854451 | T | G | 0.0003143 | — |
| 28 | NW_022183981.1 | 149 | T | G | 0.0004434 | — |
- The p-value represents a statistical significance (−log10 (p) < 5 × 10⁻⁴).
4. Discussion
The camel stands out as a remarkable source of milk production [33], especially in extremely arid conditions. Enhancing the genetic traits related to milk production is paramount for pursuing greater milk yields and production efficiency from these resilient animals. Thus, identifying key SNPs associated with high milk production is key to future breeding selection efforts. In this study, we embarked on a GWAS focused on milk traits in camels. The results revealed significant associations between specific SNPs and milk traits, offering a crucial foundation for advancing the understanding of camel genetics and their potential for increased milk production. These findings underscore the significance of genetic insights in shaping the future of camel breeding programs, ultimately contributing to enhanced milk production efficiency in challenging environments.
Utilizing a significance threshold of p < 5 × 10⁻⁴, determined via the Bonferroni correction method, facilitated the identification of a considerable cohort of candidate SNPs with putative impacts on milk production. Although this threshold diverges from the conventional standard of p < 5 × 10⁻⁸ in GWAS, it aligns with thresholds observed in analogous investigations within the literature [34], and it is a valuable starting point for hypothesis generation and exploratory analyses. We used a more stringent p-value threshold of p < 5 × 10⁻⁴ for initial SNP identification, setting our study apart from others in the field. For instance, recent studies (e.g., [35, 36]) used less stringent p-value thresholds. Our decision to adopt a more stringent threshold underscores the robustness and reliability of the associations we identified. It is important to recognize that the less stringent threshold increases the possibility of false positives; therefore, any SNP associations identified should be subjected to further validation and scrutiny.
Our investigation led to the identification of 28 significant SNPs, warranting a deeper exploration. These SNPs were traced to six specific genes: tyrosinase-related protein 1 (TYRP1), deleted in liver cancer 1 (DLC1), glypican 5 (GPC5), solute carrier family 24 member 4 (SLC24A4), nuclear envelope membrane protein 2 (NEMP2), and solute carrier family 14 member 1 (SLC14A1). Most of these genes do not have a direct known association with milk production traits. For instance, TYRP1, which is known for its role in pigment production and melanin synthesis, seems unrelated to lactation or milk production processes at first glance [37]. However, insights from local camel owners suggest a different narrative, as black camels are often chosen for milk production. This hints at a possible link between pigmentation genes such as TYRP1 and milk production traits, advocating for further investigation to uncover potential genetic correlations. This raises questions about whether TYRP1 plays a novel role in milk production or if the identified SNPs are in linkage disequilibrium with other functionally relevant regions, indirectly influencing milk production traits.
Similarly, DLC1, a member of the rhoGAP family of proteins, is crucial for cell signaling and cytoskeleton organization [38]. The SNPs identified in the DLC1 gene may suggest a regulatory role in mammary gland development or lactation processes. Given the critical role of the cytoskeletal framework and cell signaling pathways in the proper development and function of mammary glands, the SNPs in DLC1 could potentially modulate lactation-related signaling pathways, thus impacting milk production traits. Moreover, GPC5, a member of the glypican family of heparan sulfate proteoglycans, is known to modulate various signaling pathways [39]. The SNPs in the GPC5 could influence mammary gland development and milk synthesis by impacting cell signaling processes, which are integral for mammary gland morphogenesis and lactogenesis. On the other hand, SLC24A4, which encodes a potassium-dependent sodium/calcium exchanger, plays a vital role in ion transport across cell membranes [40]. The SNPs in the SLC24A4 might affect mammary gland function by modulating ion homeostasis, which is essential for milk production [41].
This extends to NEMP2, which is associated with nuclear envelope structure and function, with potential implications for gene regulation in mammary cells, influencing milk production [42]. Similarly, SLC14A1, which encodes a urea transporter, is implicated in nutrient metabolism and excretion, potentially affecting milk synthesis efficiency [43]. The varied roles of these genes and the SNPs identified make a strong case for further study of their effects on milk production and related biological processes. This initial work sets the groundwork for better genetic strategies to improve milk production in dromedary camels and is a further step toward understanding the genetic factors affecting milk production traits.
In our GWAS, we found many SNPs associated with milk traits in dromedary camels. Even though the significance threshold we chose was less strict than the usual threshold used in GWAS, the identified SNPs, especially the 28 SNPs that exceeded our threshold, provide a good starting point for future studies to discover the genetic mechanisms affecting milk production in these animals. Moreover, investigating how these genes regulate milk traits requires further research. This could include studies on gene expression, epigenetic investigations, and detailed functional analysis.
Understanding how these genes affect milk production can offer important insights for future breeding programs to increase milk yields in dromedary camels and other livestock. More detailed studies and follow-up research are needed to confirm and clarify the roles of these SNPs in milk trait variations. This further research will not only expand the current knowledge but also advance the genetic tools crucial for improving livestock to ensure a more productive and sustainable future for dromedary camel breeding and the management of other livestock.
5. Conclusion
Our research into the genetic factors governing milk production in dromedary camels revealed valuable insights. Through a GWAS, we identified 28 significant SNPs among the vast dataset of 306,310 SNPs associated with milk traits. This study delineated SNPs within six distinct genes, namely TYRP1, DLC1, GPC5, SLC24A4, NEMP2, and SLC14A1. Notably, certain genes among this selection exhibit indirect associations with milk production traits. Comprehensive annotations for these significant SNPs offer a valuable resource for future investigations into the molecular mechanisms behind this crucial agricultural trait. This study represents a significant step toward leveraging the genetic potential of dromedary camels to address the pressing demands for milk in challenging environments.
Conflicts of Interest
The authors declare that there are no conflicts of interest regarding the publication of this paper.
Authors’ Contributions
Conceptualization was done by Mikhlid H. Almutairi, Mohanad A. Abdelwahab, Abdulwahed Fahad Alrefaei, and Faisal M. Alsubaie; methodology was done by Mohanad A. Abdelwahab, Suheel Yousuf Wani, Ashraf Awad, Faisal M. Alsubaie and Mikhlid H. Almutairi; validation was done by Mohanad A. Abdelwahab, Suheel Yousuf Wani, and Faisal M. Alsubaie; formal analysis was done by Faisal M. Alsubaie, Mohanad A. Abdelwahab, and Suheel Yousuf Wani; investigation was done by Faisal M. Alsubaie, Mohanad A. Abdelwahab, Abdulwahed Fahad Alrefaei, and Ashraf Awad; resources were provided by Mikhlid H. Almutairi and Faisal M. Alsubaie; writing—original draft preparation was made by Faisal M. Alsubaie, Suheel Yousuf Wani, Abdulwahed Fahad Alrefaei, and Ashraf Awad; writing—review and editing was made by Mikhlid H. Almutairi and Faisal M. Alsubaie; supervision was done by Mikhlid H. Almutairi and Abdulwahed Fahad Alrefaei; project administration was done by Mikhlid H. Almutairi; and funding acquisition was made by Mikhlid H. Almutairi and Faisal M. Alsubaie.
Acknowledgments
We would like to thank King Saud University, Saudi Arabia (project no. RSP2023R191) and the National Program for Livestock and Fisheries Development, Saudi Arabia, for supporting and funding. We would also like to thank Al Watania Agriculture Company, Saudi Arabia, for providing the samples and phenotypic data.
Open Research
Data Availability
The sequencing data and phenotypic data from the corresponding author are available on our private database upon reasonable request.


