M-ANCHORO: Mobile Anchor Node-Based Path Optimization for Full Coverage Path Planning Algorithm
Abstract
Localization is a key technology in wireless sensor network (WSN) applications. The use of mobile anchor nodes (MANs) to assist in sensor localization is a feasible solution for reducing deployment costs and overcoming geographical limitations. However, real-world environments often contain obstacles with signal-blocking characteristics. Random collision methods cannot guarantee that sensors receive sufficient localization information, resulting in the generation of many redundant beacon points by MANs. To achieve complete localization coverage and improve localization accuracy, we propose a path planning and optimization algorithm called M-ANCHORO. The proposed algorithm divides subregions based on obstacle distribution information and deploys beacon points in equilateral triangles. It then uses the SCAN method to plan a fully localized coverage path and optimizes the number of beacon points using a path simplification procedure to establish a trajectory for full localization coverage. Experimental results showed that M-ANCHORO outperformed Z-curve, SLMAT, and SCAN in terms of localization accuracy and coverage.
1. Introduction
With the advancement of communication and networking technologies, the Internet of Things (IoTs) has become integrated into our daily lives. Wireless sensor networks (WSNs) are at the core of IoT technology. WSNs consist of hundreds or thousands of sensors that sense and gather physical information from the environment and can be deployed under harsh conditions [1]. In many applications of WSNs, localization is a crucial technology [2]. Without knowing the precise location of each sensor, effective operations and rescue efforts, such as forest fire monitoring, military reconnaissance, and target tracking, would not be possible [3]. For instance, after an earthquake, sensors that detect signs of life can only rescue trapped individuals if the locations of the sensor nodes are known. The most direct approach for sensor localization is to use the Global Positioning System (GPS). However, equipping each sensor with a GPS transceiver significantly increases the deployment costs.
An anchor node is a node equipped with a GPS receiver. To reduce deployment costs and overcome geographical limitations, a feasible approach is to assist sensor localization by deploying anchor nodes with mobility, known as mobile anchor node (MAN)-assisted localization (MANAL) [4]. MANs visit all beacon points (locations where MANs broadcast their own position information) and broadcast their location information, thereby reducing deployment costs. However, in real-world environments, there are many obstacles with signal-blocking properties, such as those that cause reflection, diffraction, and scattering along the transmission path of electromagnetic waves [5, 6]. Therefore, path planning has become an important research topic in MANAL.
For environments with obstacles [7–10], a random collision method is used, where the MAN changes its direction and broadcasts its position information when encountering an obstacle. However, in complex terrains, the random collision method cannot guarantee that sensors receive sufficient localization information for positioning, which also leads to multiple redundant paths created by MANs.
In this study, the region was divided into multiple subregions based on the distribution of obstacles. To ensure localization accuracy, the beacon points were deployed in a regular triangular pattern, and redundant beacon points were removed through a simplification procedure. This paper proposes a path planning algorithm called M-ANCHORO, which achieves full localization coverage. The region was divided into subregions with and without obstacles. Subregions without obstacles are traversed using the SCAN method, while subregions with obstacles are traversed using a greedy algorithm when the MAN passes through them. The problem of visiting beacon points is transformed into a problem of determining the minimum length of a Hamiltonian path, which is known to be an NP-complete problem [11–13].
- 1.
Integration of strategies: The proposed M-ANCHORO combines the beacon deployment strategy of LMAT, the traversal pattern of SCAN, and the simplification of beacon points using a path simplification strategy. This integration helps reduce the path length and power consumption of the MANs.
- 2.
Improved performance in obstacle environments: The beacon deployment and simplification strategy of M-ANCHORO outperformed the random collision method in environments with obstacles. This effectively reduces the number of beacon points and path lengths. Additionally, a mechanism was designed to avoid redundant paths. When obstacles obstruct the path, the MANs can decide whether to bypass them, thereby reducing redundant paths and the generation of excessive beacon points.
- 3.
Comparative performance evaluation: M-ANCHORO was compared with several existing algorithms, including Z-curve, SLMAT, and SCAN. It demonstrated good performance in terms of path length, localization accuracy, localization coverage, and number of beacon points.
The remaining sections of this paper are organized as follows: Section 2 presents related research, introducing existing static and dynamic path planning algorithms and analyzing their advantages and disadvantages. Section 3 details the operation of the proposed path planning algorithm in this study. Section 4 presents simulation experiments evaluating the performance of the M-ANCHORO algorithm in terms of path length and localization coverage. The final section concludes and provides future works.
2. Related Work
In the architecture of MANAL, path planning plays a crucial role. Path planning methods can be broadly categorized into static [7–10, 14–22] and dynamic [23–32] approaches. Static path planning methods determine optimal paths based on given constraints, minimizing the number of broadcasts by MANs and reducing power consumption and computational costs for both the MANs and sensors. On the other hand, dynamic path planning methods adjust feasible paths for MANs based on the observed environment or the deployment context of the sensors. While dynamic methods offer greater flexibility, they often achieve only local optima and cannot guarantee the requirement of full-area localization coverage [4]. Additionally, due to the real-time nature of MANs, the computational cost associated with dynamic path planning is higher. Table 1 presents the currently proposed static and dynamic path planning algorithms.
| Static path planning schemes | Dynamic path planning schemes | ||
|---|---|---|---|
| With obstacles | Obstacle-free | With obstacles | Obstacle-free |
| Z-curve [7] | SCAN [14] | Virtual Ruler [27] | MBAL [23] |
| PI Scheme [8] | Double SCAN [14] | Snake-like [28] | DREAMS [24] |
| OTPP [20] | Hilbert [14] | Visibility Binary Tree [29] | BRF and BTG [25] |
| SCAN-based [9] | CIRCLES [15] | FLPPL [30] | MBL (ndc) [26] |
| SLMAT [10] | S-CURVES [15] | DPMB [31] | Online DV-Hop Algorithm [33] |
| M-ANCHORO (our scheme) | MACL [16] | NLA_MB [32] | DAAP [34] |
| GMAN [17] | DMA [35] | ||
| LMAT [18] | |||
| Σ-SCAN [19] | |||
| MLR [36] | |||
| TSAL [37] | |||
| TMAL [38] | |||
| Application fields: Sensor network-assisted localization, floor-cleaning robots, ultraviolet disinfection robots, target tracking, and so on. | Application fields: Autonomous driving, shortest path navigation systems, Mars exploration, and so on. | ||
2.1. Static Path Planning Algorithms
In the context of static path planning algorithms, the authors in [14] introduced a simple implementation algorithm called SCAN. SCAN offers the advantage of simplicity, but it suffers from a severe collinearity issue, resulting in inaccurate localization outcomes. To address the collinearity problem associated with SCAN, the authors proposed a second method called Double SCAN, which mitigates the issue at the expense of longer path lengths. To reduce the collinearity and localization accuracy problems, the authors further presented a third method called Hilbert, which combines the strengths of the previous two algorithms, achieving shorter path lengths and improved localization accuracy.
Another approach to address the collinearity issue was proposed. In [15], the authors introduced two path planning methods, namely, CIRCLES and S-CURVES. In the CIRCLES method, the MAN moves along concentric circles outward from the center of the sensing field. However, as the circles expand, the path gradually becomes more linear, which fails to effectively avoid collinearity issues.
S-CURVES modifies the SCAN method by replacing linear paths with “S”-shaped curves. The method proposed in [14] is less accurate for sensor localization compared to both CIRCLES and S-CURVES. Additionally, to reduce path lengths, the authors introduced MACL, which utilizes a spiral trajectory with the center of the sensing range as the origin. MACL offers shorter path lengths compared to CIRCLES [16].
In [17], the authors addressed the collinearity issue by proposing the GMAN approach. In GMAN, the MANs follow the SCAN path trajectory, and an equilateral triangle’s three angles serve as beacon points, effectively solving the collinearity problem [17]. The authors in [18] introduced LMAT, a beacon deployment strategy that suggests an equilateral triangle deployment pattern, achieving the highest localization accuracy. Both GMAN and LMAT aim to improve localization accuracy and employ the deployment strategy of an equilateral triangle.
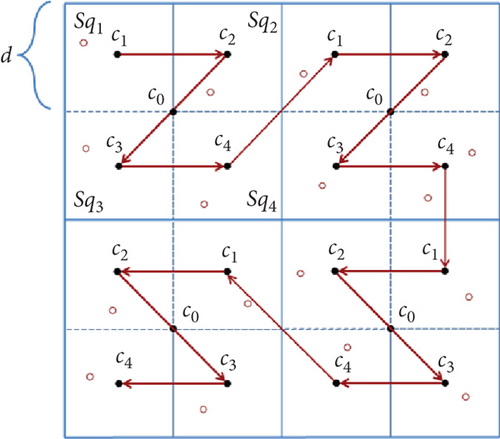
To enhance the localization coverage of Hilbert, the authors introduced a path planning algorithm called Z-curve in [7]. The Z-curve algorithm proposes a zigzag trajectory pattern to optimize path planning, thereby improving localization coverage. The Z-curve divides the sensing field into subregions, similar to Hilbert. Z-curve solves the problem of beacon points colliding with each other well and does a better job of localization accuracy and faster localization than SCAN, Hilbert, and CIRCLES. However, the Z-curve is limited to rectangular sensing fields and is not suitable for scenarios where the sensing field is a different shape, such as the rectangle shown in Figure 1.
Range-free localization techniques rely on estimating distances between nodes based on message exchanges, which often results in lower accuracy compared to range-based techniques. In [8], Guo et al. introduced the perpendicular intersection (PI) path planning method. In this approach, the MAN continuously broadcasts its location information to the sensors. The sensors then select the strongest received signal strength (RSS) value as a reference point. By receiving location information from the MAN in two different path directions, the sensors utilize the perpendicular relationship to calculate their own positions. This method leverages the geometry of PIs to enhance the accuracy of range-free localization techniques.
In [21], the authors introduced a localization method similar in concept to the PI method. The sensors collect the earliest and latest position information sent by the MAN. With these two position values, the sensors can determine a chord, and they calculate their own positions using the perpendicular bisectors of the two different chords and their intersection point.
In [9], Ou and He combined the SCAN path planning method with the localization technique proposed by Ssu, Ou, and Jiau, resulting in the SCAN-based path planning algorithm [21]. The advantages of these two range-free localization methods are that the sensors do not require distance measurement devices. However, a drawback of the PI path planning method is the continuous broadcasting of location information by the MAN, which results in increased power consumption for both the MAN and the sensors. Despite the advancements in range-free localization techniques [5, 39], they still have limitations in terms of localization accuracy when compared to range-based localization techniques. Therefore, this project primarily focuses on employing range-based localization techniques.
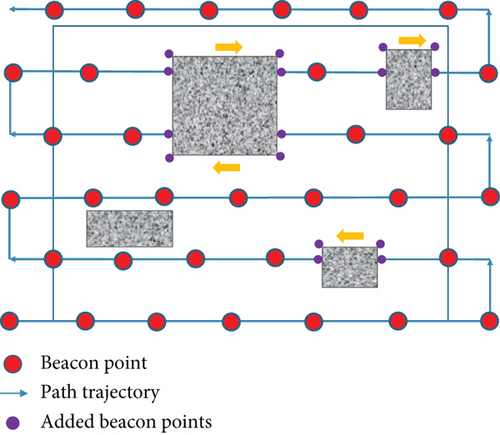
Based on the advantages of shorter path length in the SCAN method and more accurate localization with the LMAT approach, Han et al. proposed SLMAT [10]. The authors employed a random collision method to handle dead zones caused by signal obstacles. In this method, beacon points are set at the positions where the MAN makes turns. While the random collision method is simple, it may not achieve complete localization coverage when the obstacles are long. Figure 2 illustrates the path trajectory of SLMAT, with the “purple” points representing additional beacon points added when encountering obstacles.
In [36], the authors propose a machine-learning-based algorithm that enables sensor nodes to accurately identify their own positions using a single MAN. The MAN moves along a relatively short, straight path, reducing the energy consumption associated with its movement and the total time required to identify the locations of all sensor nodes. The proposed machine learning model is based on the multilinear regression model and is trained offline, alleviating the burden on resource-constrained sensor nodes.
In [37], Tong et al. propose a simple yet effective single-anchor node mobile localization scheme called TSAL as a potential solution when traditional localization methods fail. TSAL uses an existing operational cellular base station (BS) as the only anchor, or deploying a new BS is enough to locate the target. This is done by setting up three Cartesian coordinate systems and using existing methods to measure distance and/or turning angle when the target node moves. Additionally, TSAL can operate with multiple anchor nodes, and we introduce a corresponding scheme named TML to further improve the localization accuracy based on TSAL.
In [38], Ibrahim, Mahdi, and Salman propose a novel distance-based localization algorithm called triple mobile anchors for localization (TMAL). To localize an unknown sensor, this algorithm uses RSS indicators (RSSIs) and relies on three mobile sensors forming a moving triangle.
2.2. Dynamic Path Planning Algorithms
Currently, numerous dynamic path planning methods have been proposed, falling into two categories: obstacle-free and obstacle-aware. Obstacle-free methods include MBAL [23], DREAMS [24], BRF and BTG [25], MBL (ndc) [26], Online DV-Hop Algorithm [33], and DAAP [34]. Methods designed for obstacle environments include Virtual Ruler [27], Snake-like [28], Visibility Binary Tree [29], FLPPL [30], DPMB [31], NLA_MB [32], and DMA [35].
In [27], ultrasound transceivers are equipped at both ends of the MAN. During localization, each sensor independently measures the distance to the MAN. The sensors are also aware of the length of the MAN and the distance relationships with their neighbors, enabling them to calculate their own positions. However, the authors employed a random collision strategy that does not effectively achieve full-area localization coverage.
In [28], Mazinani and Farnia primarily proposed the Snake-like algorithm, but their method is similar to SCAN, resulting in collinearity issues. In [29], Rashid et al. introduced the Visibility Binary Tree Algorithm, aiming to find the shortest path for the MAN from any starting point to any endpoint.
In [35], the study creates a dual-anchor path planning model and suggests an underwater WSN localization algorithm based on dual mobile anchor path planning. This is done to address the low node localization rates and large positioning errors caused by uneven anchor path coverage in these networks. The model utilizes communication collaboration between anchors to gather node information and employs RSSI-ranging algorithms and polygon-based localization algorithms to achieve node localization. Additionally, the authors design anchor trajectories to overcome collinearity issues and achieve a uniform distribution of path coverage.
Dynamic path planning methods are challenging to achieve full localization coverage and are mainly applied in navigation from a specific position (start point) to other positions (end points), as well as in problems involving finding the shortest path between any two points and autonomous driving, among others.
In addition to optimizing or enhancing path planning strategies, improvements in localization techniques and methods can also improve localization accuracy [40–43].
3. Proposed Path Planning Scheme: M-ANCHORO
3.1. Definitions and Assumptions
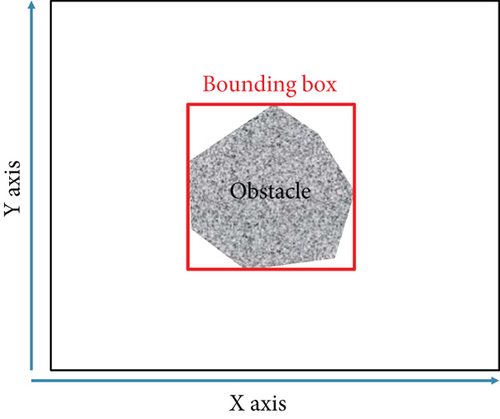
This paper introduces a novel path planning algorithm that integrates the SCAN traversal method with the LMAT beacon deployment strategy. However, in real-world environments, obstacles exist, and using the random collision method can result in numerous redundant paths and duplicated beacon deployments. Before explaining the M-ANCHORO algorithm, we adopt the definition from a previous study [20]. Without loss of generality, we enclose obstacles of any shape within a rectangle, as depicted in Figure 3.
For a sensor to be locatable, it must be situated within a three-covered region, ensuring that it can receive three or more localization packets from the MAN. Therefore, we adopt the k-covered definition from [20].
Definition 1 (see [20].)If a region is referred to as k-covered, it means that all sensors within that region can receive k distinct localization packets.
3.2. Region Partitioning and Deployment of Beacon Points
In M-ANCHORO, there are three main procedures: (1) dividing the area and deploying beacon points, (2) optimizing the number and positions of beacon points, and (3) MAN visiting all beacon points once without forming a cycle.
We divide the area into two different subregions: subregions with obstacles and subregions without obstacles. To eliminate dead zones formed by obstacles, we deploy the minimum number of beacon points around the obstacles, allowing the obstacles and the surrounding areas to form three covered subregions. These subregions are referred to as subregions with obstacles. The remaining subregions, where no obstacles are present, are referred to as subregions without obstacles. Assuming there are n obstacles in a given area, we divide the area into n subregions with obstacles and one subregion without any obstacles. The following describes how the beacon points are deployed around the obstacles to make the area a subregion with obstacles.
Lemma 1. Han et al. showed in SLMAT that placing beacon points in an equal-sided triangle shape gives the target nodes the best localization error [10].
To meet the requirements for high localization accuracy, we need to deploy the beacon points in an equilateral triangle structure. Once we understand how to deploy the beacon points to minimize localization errors, we begin by deploying beacon points in subregions with obstacles using an equilateral triangle configuration. The beacon points are placed around the obstacles, ensuring that the surrounding area is densely covered with beacon points. Here, d represents the length of each side of the equilateral triangle.
Lemma 2 (see [10].)When d = cr, an equilateral triangle formed by three beacon points will result in the maximum three-covered area, where d is the distance between beacon points and cr is the communication range. Therefore, to localize as many target nodes as possible, d should be equal to cr, maximizing the three-covered area.
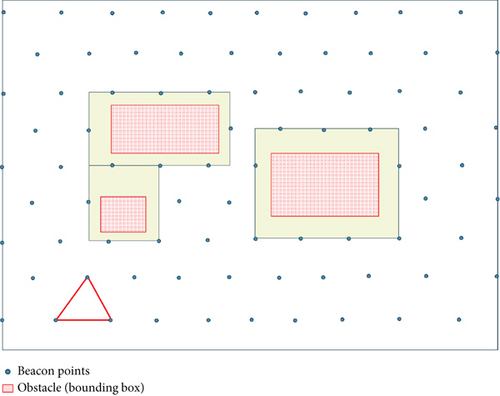
Our reasoning comes from the results of Lemma 1 and Lemma 2. To get full localization coverage (three-covered or above) and better localization accuracy in areas around obstacles that are not adequately three-covered, we place a lot of beacon points in a pattern of three equal triangles around the obstacles. Therefore, we deploy beacon points based on the structure of equilateral triangles, as shown by the blue dots in Figure 4.
Due to the obstructive nature of obstacles, we add beacon points along the edges of the obstacles to ensure maximum coverage within the obstructed areas. In Figure 5, there are three obstacles, and we sequentially deploy beacon points along each obstacle’s four edges. Assuming an obstacle has a side length of L, at least LBP beacon points need to be deployed, where LBP = ⌊L/d⌋. We deploy beacon points clockwise around each of the four corners of the obstacles, resulting in the red dots (additional beacon points) shown in Figure 5.
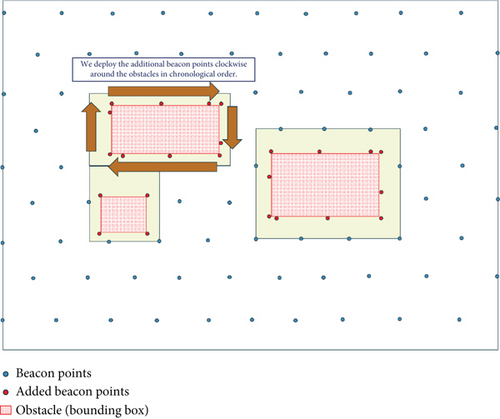
After determining the positions of all beacon points, we begin to implement a simplification strategy for reducing the number of beacon points. We analyze the coverage of each additional beacon point. We need to remove any beacon point with a coverage count exceeding three from the additional beacon points to minimize the power cost of MAN broadcasting and sensor reception of beacon signals.
Considering Figure 6, let us assume there are additional beacon points around the obstacles labeled as A, B, C, D, E, F, G, H, I, and J. Multiple other beacon points may cover each beacon point. In this case, we need to analyze the coverage relationship between the additional beacon points and the surrounding beacon points. We can delete the specific additional beacon point if its removal does not result in the surrounding beacon points having less than 3.
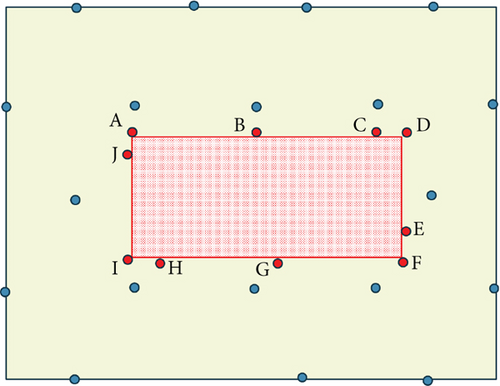
We start by examining Beacon Point A. We consider the possibility of removing Beacon Point A and whether it would result in its neighboring beacon points having less than three coverages. If this is the case, we cannot delete Beacon Point A. On the other hand, we can delete Beacon Point A if its three neighboring beacon points do not depend on it. Once we have examined Beacon Point A, we proceed to examine Beacon Point B, and so on, until we have checked all the additional beacon points surrounding the obstacles. Figure 7 illustrates the completion of the deletion process. After this process, we proceed to the next path planning procedure.
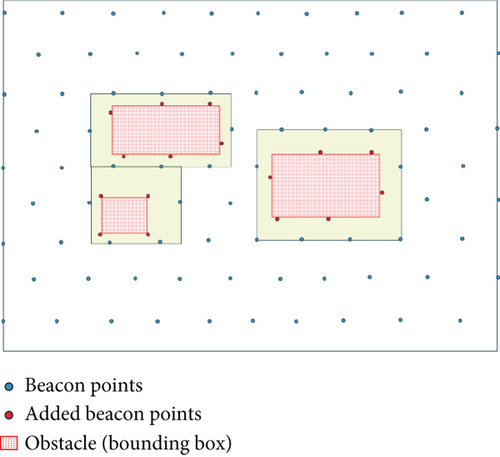
Algorithm 1 is the pseudocode for the simplification strategy of beacon points. The input includes the ID, location, and communication radius (cr) of added beacon points within the overlapping area.
-
Algorithm 1: Simplification strategy.
-
Input: added beacon point ID, added beacon point coordinates, cr
-
Output: retained added beacon point ID, retained added beacon point coordinates
-
1: For all added beacon point i in overlapper area
-
2: coverageCount of i :=0; //initialization
-
3: End for
-
4: For all key beacon point i in overlapper area
-
5: IF the distance of i and neighboring beacon points j ≤ cr
-
6: coverageCount of i + +;
-
7: End if
-
8: IF coverageCount of i > 3
-
9: delete the added beacon point i;
-
10: decrement the coverage count of neighboring beacon point j by 1;
-
11: End if
-
12: End for
-
13: Return the retained added beacon points’ ID and coordinates;
3.3. Path Planning
After determining the positions of the beacon points, the path planning for the MAN focuses on determining the traversal order of these points. The goal is to find the shortest path that minimizes the power consumption of the MAN, which corresponds to finding the Hamiltonian path with the minimum length for visiting all beacon points. This transforms the problem into the task of determining the minimum-length Hamiltonian path [11–13].
Determining the minimum-length Hamiltonian path is known to be an NP-complete problem. Using a brute-force approach to solve this problem is inefficient, with a time complexity of O(n!). As the number of beacon points, denoted by n, increases, the time complexity becomes extremely high, making it almost impossible to find an optimal solution. Hence, it is crucial to optimize the number and positions of beacon points to address this issue effectively and achieve efficient path planning for MANs.
In M-ANCHORO, the entire area is divided into multiple subregions based on the distribution of obstacles. The region is divided into subregions with and without obstacles. In subregions without obstacles, the MAN primarily uses the SCAN method for traversal. SCAN is a path planning algorithm that uses relatively short path lengths [14]. In subregions with obstacles, M-ANCHORO adopts the greedy principle to select the nearest and unvisited beacon point as the next target position for movement.
To address the issue of redundant paths and beacon points generated by the random collision method, we restrict the movement of anchor nodes to bypass obstacles. In the subregions with obstacles, we set a range tr. The robot selects the nearest beacon point within range tr for traversal if it has not been traversed during its movement. If all beacon points within range tr have been traversed, the mobile anchor moves directly towards the corner of the obstacle, bypasses it, and enters a subregion without obstacles, as shown in Figure 8(a). Figure 8(b) illustrates the method of bypassing obstacles using the random collision method, where the moving anchor node turns and broadcasts localization packets when it collides with an obstacle, resulting in longer paths and repeated beacon points. The Pythagorean theorem states that the distance traveled directly along the hypotenuse by the moving anchor node is always shorter than the sum of the adjacent and opposite sides.
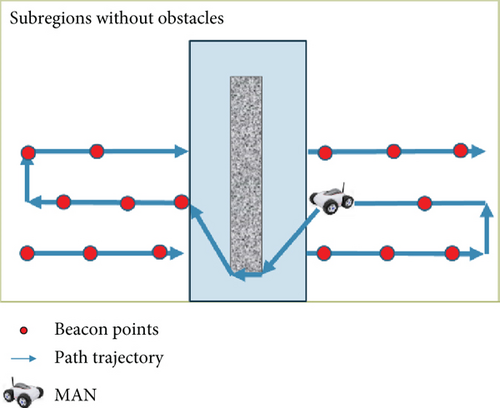
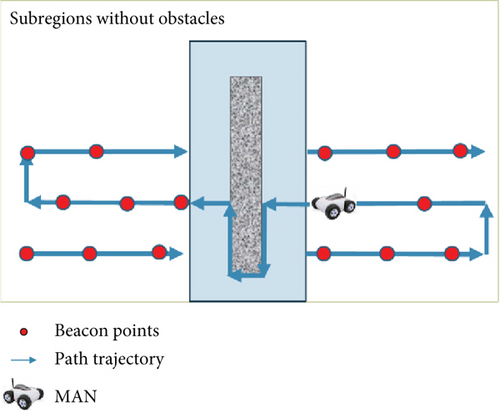
The M-ANCHORO method uses the path trajectory in Figure 9 to traverse the entire area. In obstacle-free regions, the MAN primarily moves in the direction of the SCAN traversal method. The deployment of beacon points across the entire area follows the LAMT strategy, which entails deploying them as equilateral triangles. This strategy aids in effectively covering the entire area, ensuring the connectivity and reliability of communication.
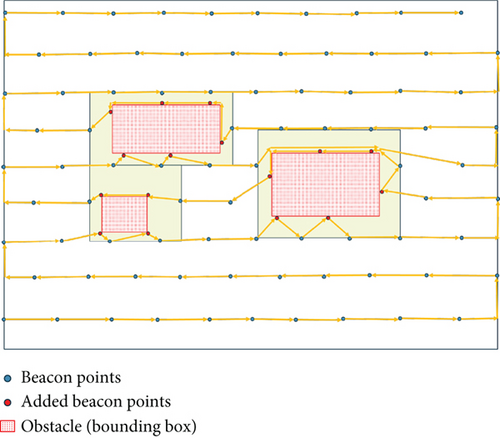
However, when encountering areas with obstacles, the MAN switches to a greedy algorithm. This flexibility in strategy enables the system to quickly adapt when facing obstacles, thereby ensuring the smoothness and reliability of data transmission. When MAN enters areas with obstacles, the system determines which algorithm to traverse based on the position relationship of newly added beacon points relative to regular beacon points and the distance between them.
If the newly added beacon point is above a regular beacon point and the distance between them is less than a critical value, denoted as cr, the system employs the greedy algorithm for traversal. In the absence of these conditions, the system directly traverses regular beacon points to maintain signal connectivity and stability.
4. Performance Analysis
4.1. Scheme Performance Indicators and Analysis
- (a)
Total Path Length of MANs
- (b)
Localization Error and Localization Coverage
- (c)
Total Number of Beacon Points
4.2. Communication Model
The receiving node [44] determines the signal-to-noise ratio (SNR) by utilizing the RSS (Prec) and the noise floor (Pn). The receiving node [44] calculates the SNR using Equations (9) and (10). The noise figure, typically set to 13 dB, is represented by F. The Boltzmann constant (k) represents the thermal noise, while T0 denotes the absolute temperature.
4.3. Environment and Parameter Settings
In this study, we conducted experiments using the Windows 11 operating system running on a system with 16 GB of DDR4-3000 memory. We developed the simulation using the Java programming language and employed Gnuplot as a supplementary tool to plot and perform complex calculations. For comparison, we conducted three sets of experiments to test the performance of the M-ANCHORO, Z-curve [7], SLMAT [10], and SCAN [14] algorithms. We assessed their performance based on metrics such as average path length, localization accuracy, localization coverage, and the number of beacon points.
For localization, we adopted the APT method as the approach for the sensors. This method prioritizes accuracy in the triangulation process with the aim of enhancing the precision of sensor localization. Table 2 presents the environmental parameter settings. We set the environment’s size to 320∗320 grids, with each grid measuring 1 m × 1 m. In this environment, we deploy one MAN and randomly distribute 100 sensors. The sensors’ communication radius ranges from 10 to 100 grids. Furthermore, we introduce 1–10 obstacles, with each obstacle varying in size from 1 to 102 grids.
| Parameter | Value |
|---|---|
| Area size | 320 × 320 |
| Number of mobile anchor node | 1 |
| Number of sensors | 100 |
| Communication radius | 10–100 |
| Number of obstacles | 1–10 |
| Obstacle size | 12–102 |
In the simulation experiment, sensors are initially randomly deployed in the area where the nodes are to be located. The MAN starts in the top left corner of the area, assuming knowledge of all obstacles’ positions. To simplify the simulation, irregularly shaped obstacles are approximated using bounding boxes. Consequently, rectangular obstacles are directly generated and employed to represent the obstacles.
Initially, the area is divided into subregions, and beacon points are deployed within these regions. The number and position of beacon points are then optimized. After determining the beacon points’ positions, the MAN uses the SCAN method to traverse the obstacle-free subregions. In subregions containing obstacles, the M-ANCHORO algorithm adopts a greedy principle to select the nearest unvisited beacon point as the next target for the MAN’s movement. The process continues until the MAN reaches the last beacon point, at which point the procedure terminates.
4.4. Impact of the Number of Obstacles
In an environment with obstacles, it is crucial to accurately determine the actual positions of the sensors, that is, the source location of the data, to ensure the effective operation of the sensors. In this experimental scenario, we varied the number of obstacles between one and 10. We set the size of each obstacle to 4 × 6 m and defined the communication radius as 40 m. To evaluate the performance of the different path planning methods, we employed four distinct approaches in our experimental testing. These methods were used to determine the optimal paths for the MAN in the presence of obstacles, considering factors such as obstacle avoidance and efficient traversal of the sensing area.
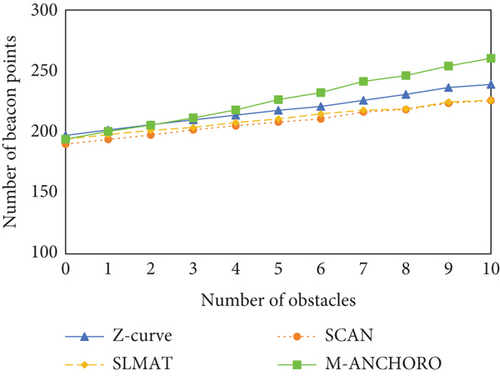
Figures 10(a), 10(b), 10(c), and 10(d) depict the experimental results for four metrics in relation to the number of obstacles. Figure 10(a) illustrates that as the number of obstacles increases, the number of beacon points consumed by all algorithms also gradually rises. This indicates that obstacles have an impact on the path planning process, requiring the algorithms to utilize more beacon points to navigate around or avoid these obstacles effectively. M-ANCHORO consumes fewer beacon points compared to the Z-curve. This indicates that M-ANCHORO has better performance in avoiding redundant paths and beacon point deployment. Z-curve consumes the most beacon points, but it outperforms the SCAN and SLMAT algorithms in terms of localization coverage and accuracy. The beacon point consumption of the SCAN and SLMAT algorithms remains relatively stable and close for different numbers of obstacles.
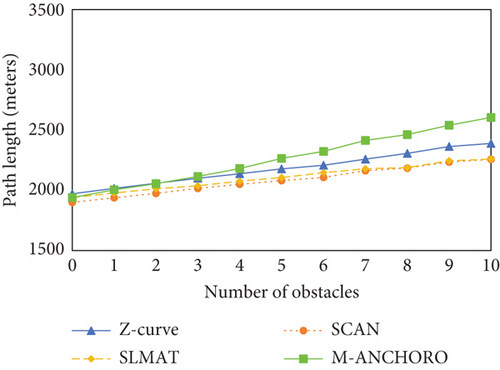
As shown in Figure 10(b), as the number of obstacles increases, the path length also increases. This is because the presence of obstacles increases the complexity of the paths and the difficulty of obstacle avoidance, resulting in longer paths. To ensure full positioning coverage, M-ANCHORO deploys beacon points around obstacles, leading to longer path lengths because of the traversal of these beacon points. The Z-curve algorithm has shorter path lengths for a small number of obstacles; however, as the number of obstacles increases, the path length gradually increases, indicating a weaker limiting capability. The path lengths of the SCAN and SLMAT algorithms remain relatively stable for different numbers of obstacles; however, the SCAN algorithm has shorter path lengths overall.
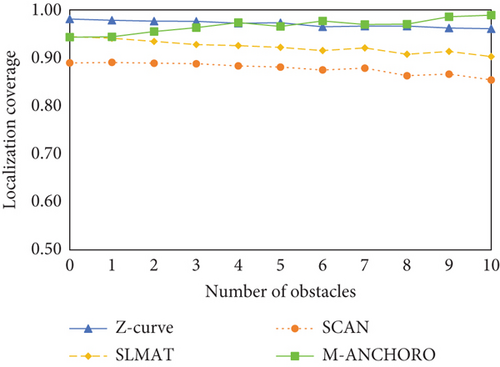
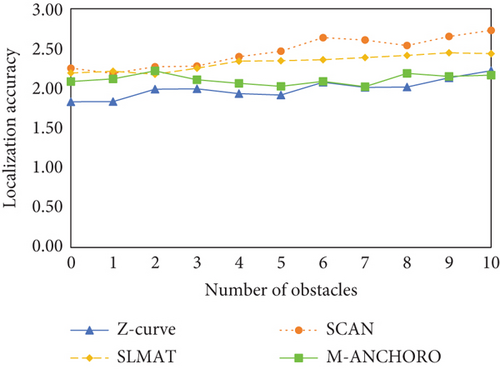
In Figure 10(c), the localization coverage of M-ANCHORO is close to that of the Z-curve; however, as the number of obstacles increases, the localization coverage of M-ANCHORO gradually increases, indicating that the beacon point deployment strategy of M-ANCHORO can effectively avoid a decrease in positioning coverage. In contrast, the localization coverages of SCAN and SLMAT decreased gradually as the number of obstacles increased. In Figure 10(d), when the number of obstacles is zero, the Z-curve algorithm has a higher localization accuracy owing to the shorter distances between neighboring beacon points and a larger number of beacon points, resulting in lower localization errors. However, as the number of obstacles increases, the performance of M-ANCHORO approaches that of Z-curve. The performances of SCAN and SLMAT remained approximately the same, but SLMAT gradually exhibited a better localization error because it used triangular beacon points.
In conclusion, based on the experimental results, it is evident that the number of obstacles has a notable influence on the performance of localization algorithms. Among the tested algorithms, M-ANCHORO demonstrated superior performance in optimizing the number of beacon points and achieving high localization accuracy. By contrast, the Z-curve algorithm outperformed the other algorithms in terms of localization coverage and accuracy. The performances of the SCAN and SLMAT algorithms remained relatively stable across different numbers of obstacles; however, these algorithms may have some limitations in terms of localization coverage and accuracy compared to M-ANCHORO and Z-curve.
4.5. Impact of the Size of Obstacles
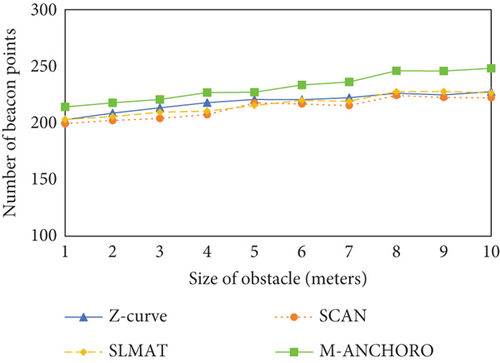
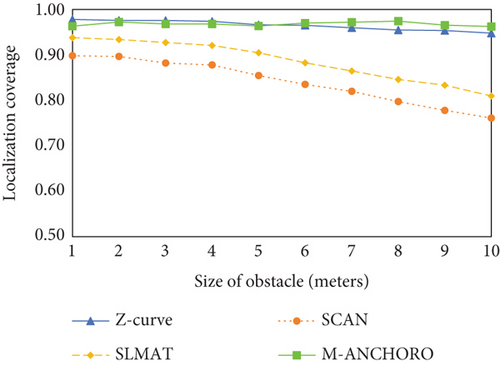
Localization accuracy is particularly important when determining the correct localization of an event. In this experimental scenario, we attempted to vary the size of the obstacles and analyze their impact on the algorithm. The sizes of the obstacles ranged from 1 × 1 to 10 × 10 m, with a fixed number of five obstacles and a communication radius of 40 m. Figures 11(a), 11(b), 11(c), and 11(d) present the experimental results of the four metrics in relation to obstacle size. Figure 11(a) displays the experimental results of the four metrics with respect to obstacle size, revealing that as the obstacle size increases, the number of beacon points consumed by all algorithms gradually increases. This is because larger obstacles result in more complex paths and require more beacon points. Compared with the Z-curve algorithm, the M-ANCHORO algorithm consumes fewer beacon points, indicating that M-ANCHORO has a more effective strategy for optimizing the number of beacon points. The Z-curve algorithm consumes fewer beacon points when obstacles are small; however, as the obstacle size increases, its consumption also increases, indicating a weaker limiting capability. The beacon point consumption of the SCAN and SLMAT algorithms remained relatively stable across different obstacle widths; however, overall, SLMAT consumed fewer beacon points than SCAN.
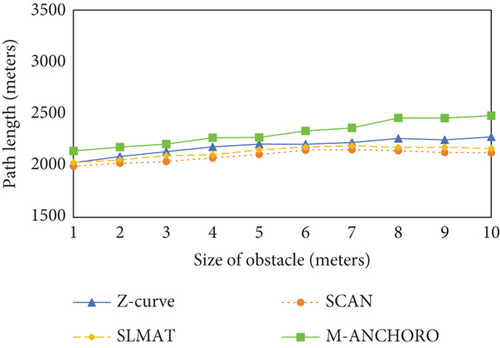

As shown in Figure 11(b), as the size of obstacles increases, the total path length gradually increases for all algorithms, with M-ANCHORO consuming the longest path length. Because SLMAT’s traversal method is based on SCAN, the path length of SLMAT is closer to that of SCAN, while Z-curve, after partitioning into multiple subsquares, requires the traversal of five beacon points in each subsquare, resulting in a longer path length compared to the SCAN and SLMAT algorithms.
As shown in Figure 11(c), as the number of obstacles increased, only M-ANCHORO and Z-curve maintained a coverage ratio of over 98%. Meanwhile, the coverage ratios of the SCAN and SLMAT algorithms decreased, which means that they do not have sufficient communication radius, which causes the localization coverage to decrease slowly. As the size of the obstacles increases, as shown in Figure 11(d), the M-ANCHORO algorithm performs similarly to the Z-curve. This shows that M-ANCHORO’s strategy for deploying beacon points is better than Z-curve’s because it allows for positioning errors similar to those of Z-curve with fewer beacon points being used. SCAN and SLMAT show similar performances, but SLMAT’s deployment strategy using equilateral triangles provides better localization accuracy than SCAN.
In conclusion, the experimental results indicate that different obstacle sizes have a significant impact on the performance of localization algorithms. Among the tested algorithms, the M-ANCHORO algorithm stood out for its ability to optimize the number of beacon points and achieve high localization accuracy. The SLMAT algorithm also performed well in terms of beacon point consumption and localization accuracy. However, the Z-curve algorithm showed relatively weaker performance in terms of its limiting capabilities and may require further improvements to enhance its effectiveness.
Overall, these results show the importance of considering obstacle size when choosing and improving localization algorithms because they can have a significant effect on performance measures like the number of beacon points used, accuracy of localization, path length, and coverage.
4.6. Impact of Communication Radius
To achieve full localization coverage, the communication radius affects the number of required beacon points. Ensuring that sensors in the entire area receive three or more localization packets necessitates the use of additional beacon points by the MANs. In this specific set of experiments, we maintained a fixed number of obstacles at five, with each obstacle measuring 22 × 42 m.
The experiments focused on varying the communication radius, ranging from 10 to 100 m. By increasing the communication radius, the range of signal transmission is expected to expand, potentially reducing the number of beacon points required to achieve full localization coverage. The purpose of these experiments was to explore the relationship between the communication radius and the required number of beacon points to ensure comprehensive localization coverage in the presence of obstacles.
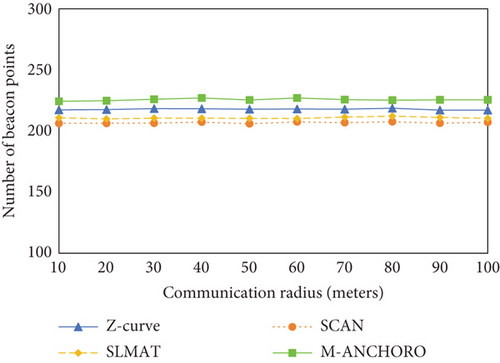
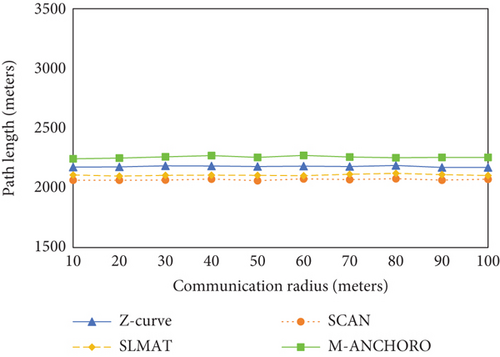
Figures 12(a), 12(b), 12(c), and 12(d) show the experimental results of the four metrics regarding the size of the communication radius. Figure 12(a) presents the experimental results for the four metrics with respect to the size of the communication radius. It can be observed that as the communication radius increases, the M-ANCHORO algorithm gradually reduces the number of beacon points due to its strategy of optimizing beacon points. The other three algorithms use a random collision method, and the deployment of beacon points is fixed; thus, the number of beacon points does not change significantly. As shown in Figure 12(b), as the positions of the beacon points are fixed, the path length does not change. Although the number of beacon points decreases in M-ANCHORO, all beacon points must be traversed, resulting in a longer path length compared with the other three algorithms. SLMAT is based on the traversal method of SCAN, so the path lengths of both algorithms are relatively close. Z-curve requires the traversal of five beacon points, resulting in a longer path length compared with the SCAN and SLMAT algorithms.
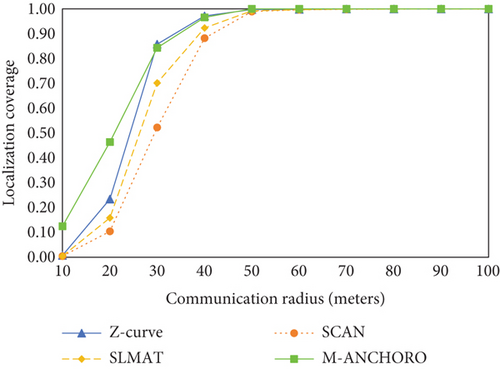
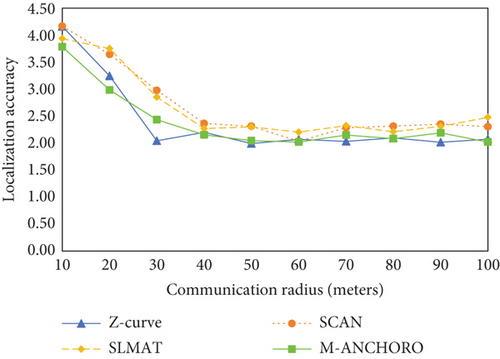
As shown in Figure 12(c), increasing the communication radius leads to a gradual improvement in the localization coverage of the four algorithms. When the communication radius is below 50 m, the M-ANCHORO algorithm demonstrates the highest localization coverage. However, none of the tested methods achieved 100% localization coverage, suggesting that the communication radius is insufficient. However, when the communication radius exceeds 50 m, all algorithms achieve full coverage. As shown in Figure 12(d), increasing the communication radius results in a gradual decrease in localization errors for all four methods. A larger communication radius allows for stronger and more reliable signals, leading to improved sensor localization accuracy.
In conclusion, according to the experimental results, the size of the communication radius significantly affects the performance of the algorithms. The M-ANCHORO algorithm demonstrates advantages in optimizing the number of beacon points and achieving high localization accuracy. The Z-curve algorithm is similar to the M-ANCHORO algorithm in terms of localization coverage and accuracy. However, in environments without obstacles, more beacon points are required, and the paths are more complex. The SCAN and SLMAT algorithms perform poorly in terms of localization coverage and accuracy. It is challenging for them to achieve assisted localization in an environment with obstacles.
5. Conclusions
Existing path planning algorithms often use random collision methods to deal with environments with obstacles, but they lack optimized beacon point deployment, resulting in the generation of many redundant beacon points. Additionally, poor deployment of beacon points can lead to inaccurate localization. To overcome these issues, we propose the M-ANCHORO algorithm. It uses a divide-and-conquer approach to divide the region into obstacle and nonobstacle subregions. M-ANCHORO combines the beacon point deployment strategy of LMAT, the traversal algorithm of SCAN, and a beacon point simplification procedure to reduce the number of beacon points while improving localization accuracy and achieving high localization coverage. M-ANCHORO’s localization accuracy, localization coverage, and total number of beacon points are compared favorably with Z-curve, SLMAT, and SCAN. This study provides an effective path planning solution, and future research can explore further performance optimization and applications of M-ANCHORO.
Conflicts of Interest
The authors declare no conflicts of interest.
Funding
Rong-Guei Tsai and Di Lin were supported by the Putian City Science and Technology Project, China (Grant Nos. 2023NJJ008 and 2022GZ2001ptxy14), while Rong-Guei Tsai received support from the Science Foundation of the Fujian Province Project, China (Grant Nos. 2020J01924, 2023J011015, and 2021J05243). The Putian College Research Project in 2023 (Grant No. 2023043) provided support to Yicong Yu. Additionally, Yicong Yu received support from the Fujian Provincial Department of Education’s 2023 Undergraduate College Education Teaching Research Project (general project) (Grant No. FBJY20230216) and the Fujian Provincial Young and Middle-aged Teacher Education Research Project (science and technology) (Grant No. JAT220300). The Quanzhou Ocean Institute Research Project (Grant No. QH202327) provided support for Delin Luo.
Open Research
Data Availability Statement
The data used to support the findings of this study are included within the article.


