An Integrated Approach for the Assessment of Hydrocarbon Potential in Carbonate Reservoirs: Potwar Plateau, Pakistan
Abstract
The Potwar Plateau region of the Upper Indus Basin in Pakistan is known for its complex carbonate reservoirs, which pose significant challenges for hydrocarbon exploration and production. The integrated reservoir simulation study can help mitigate these challenges by better understanding the reservoir behavior and optimizing production strategies. The reservoir characterization of this region has essential importance in Pakistan because tight limestone and fractures (with vugs and leached features) may provide a zone of high porosity, permeability, and reservoir properties with isolated distribution in tight carbonates. The seismic and well log data were integrated to get the reservoir characterization and mark targeted reservoirs (Chorgali and Sakesar Formations) in Balkassar Oil Field. The study utilized 3D seismic interpretation, petrophysics analysis, rock physics analysis, and seismic inversion techniques to evaluate the subsurface properties of the carbonate reservoir. The time grid and depth contour map generation for Chorgali and Sakesar Formations show less time, about 1.2–1.3 s for Chorgali and 1.32–1.488 s for Sakesar which reveal clearly that the central part between the two faults is a shallow portion which is the crest of Balkassar anticline forming the suitable structural trap for hydrocarbon accumulation. Three reservoir zones with certain depths are marked based on petrophysics and rock physics analysis. The cross-plot between mu–rho versus lambda–rho value indicates a high porosity value at 2,460–2,580 m. From seismic inversion, low impedance values are observed in that reservoir zone (2,400–2,500 m).
1. Introduction
Seismic exploration and interpretation aim to create a geological map of hydrocarbon reservoir features and analyze petrophysical parameters. 3D seismic interpretation is essential to understand the reservoir’s geometry and identify hydrocarbon migration pathways. Understanding subsurface configurations is crucial to accurately identify structures with high hydrocarbon potential [1, 2, 3]. Thorough seismic and petrophysical data analysis can reduce drilling risks and increase productivity. Reservoir characterization provides valuable information and improves understanding of geological and petrophysical parameters, aiding decision-making for field development [4]. Seismic data gives interface information of the subsurface over time, while well log data provides layer details but is limited in coverage. Combining seismic and well log data through seismic inversion provides a detailed subsurface model by using high-frequency well log data to extract properties from low-resolution seismic reflection data [5, 6, 7].
Attock Oil Company, in 1945, discovered an exclusive lease of Pakistan Oilfields Limited at Balkassar (Figure 1). This structure is situated on the southern appendage of Soan syncline. This study discusses problems involving the analysis of subsurface fractures and reservoir properties to enhance future production and commercial exploration. Natural fractures arise as a systematic set of specific and random orientations that cause continuous mud loss, ultimately filling the microcanals and resulting in formation damage. Seismic data (2D and 3D) and earlier vintages reveal that Balkassar consists of two folds that create a heart-shaped structure. This structural complexity is responsible for the variation in hydrocarbon properties within the same petroleum play, indicating structural failure. 3D seismic data interpretation attribute analysis and visualization for deeper prospects carried out in time, and depth contour maps show potential for deeper prospects in Balkassar oil field [10]. To test hydrocarbons, the drilling of two wells along the forelimb of a north-/south-oriented structure in the Chorgali and Sakesar reservoirs of the Potwar Plateau [11] proved Chorgali Formation is a tight reservoir with 0–0.3 mD matrix permeability and fracture permeability, approximately 3,500–4,200 mD, calculated in the well test analysis. Fractures occurred in the two wells because of tensional and shear stress. Well 1 was a producer, whereas well 2 was a dry hole manifesting no apparent reason [11, 12, 13].
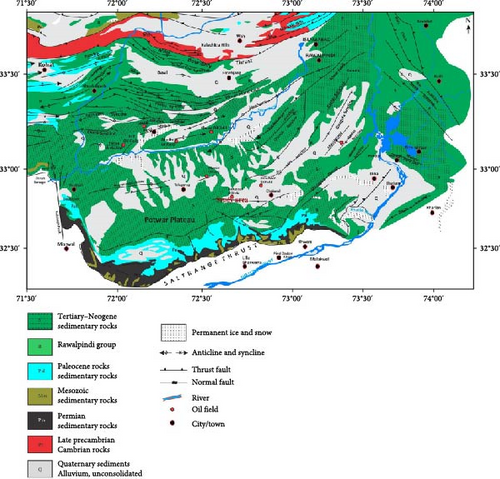
This study focuses on the challenges associated with analyzing subsurface fractures in carbonate reservoirs located in Northern Pakistan, which are predominantly composed of tight limestone. Fractures play a crucial role in reservoir modeling and production within carbonate reservoirs. Natural fractures can be categorized into systematic and unsystematic sets based on orientation. Electrical and acoustic image logs were used to differentiate between natural and induced fractures. The connection and availability of hydrocarbons could be influenced by the interconnection and continuity of fractures, affecting their connectivity to storage reservoirs. In this case, systematic fractures were interpreted as dominantly tensional, developed perpendicular to the bedding strike [14]. The evaluation of the petrophysical properties showed that the Sakesar Limestone in Balkassar Oil Field has good petrophysical properties and the potential to produce hydrocarbons [15, 16, 17, 18]. The Balkassar Oil Field in the Potwar Plateau has explored the Chorgali/Sakesar fractured carbonate reservoirs and Lockhart Formation. This study focused on the Chorgali/Sakesar Formations and used a 3D seismic dataset and well data to identify potential reservoir domains with increased permeability due to fractures. Structural validation methods and data integration were applied to reduce uncertainty in the interpretation.
In Northern Pakistan, detailed studies of carbonate reservoirs are crucial to overcome the challenges geoscientists face. These challenges include reservoir zonation and layering and the presence of fractured carbonate reservoirs. The producing Chorgali and Sakesar Formations are mapped and marked by two geological layers. The top of the Chorgali Formation acts as a seal top, as it is mainly composed of fractured limestone and has a high shale content at the top, as identified in rock physics analysis. Fractured carbonate reservoirs, such as those in the Sakesar and Chorgali Formations, provide essential porosity and permeability. The aperture of fractures plays an important role in the permeability variation, as Belhaj et al. [19] noted. Therefore, a thorough understanding of carbonate reservoir zonation, its layering presence, and characteristics of fractures is critical for the effective exploration and production of hydrocarbons in Northern Pakistan.
The Potwar Basin witnessed its first commercial discovery of oil in 1915 at the Khaur Field, which held approximately 1,600 million barrels of oil equivalent (MMBOE) in reserves. However, many of the region’s oilfields have reached a mature production stage. The discovery pattern in the area has followed a “creaming curve” as shown in Figure 2, where larger ones followed small initial discoveries on anticlines. Advances in seismic technology and exploration techniques have made the Mesozoic sections more accessible. Recent developments in 3D seismic technology, advanced processing, and structural restoration techniques have made it possible to explore the deepest parts of the stratigraphy, leading to a more comprehensive exploration of the region. This has opened up new opportunities for exploration in the area, despite the mature production stage of many oilfields, providing a significant boost to the industry. However, there have been some significant discoveries in recent years, indicating that there is still significant potential for further exploration in the basin [20, 21].

Therefore, high permeability in carbonate reservoirs often depends on natural or induced fractures with limited porosity. This poses challenges for geoscientists, such as understanding fracture behavior, approximating production, and estimating economically viable hydrocarbon reserves. Therefore, it is essential to integrate seismic interpretation, petrophysical analysis, rock physics analysis, and seismic inversion techniques to reduce uncertainty in interpretation and overcome the costly nature of hydrocarbon exploration and drilling in the Potwar Basin. By utilizing these integrated approaches, geoscientists can improve their understanding of the subsurface and make more informed decisions regarding hydrocarbon exploration and production. This can lead to more accurate production estimates, reduced exploration and drilling costs, and improved economic viability of hydrocarbon reserves in the Potwar Basin. An integrated reservoir simulation study was conducted in carbonate reservoirs in Pakistan’s Potwar Plateau region. The study used various techniques to accurately characterize the reservoirs and optimize their production.
2. Tectonic Setting and Stratigraphy
The Himalaya is considered as one of the best known latest examples of the continent-to-continent collision which formed around 50 Ma [22]. The convergence of the Eurasian and Indian plates at 2,000 km can be revealed by the seafloor spreading. In formation of Himalayan belt and other narrowly situated mountain ranges, a range of geodynamical processes are involved, i.e., collision and movement of continents, expansion of sea floor, and the continuous northward movement of the Indian Plate below the Eurasian Plate during the Eocene [23, 24]. The Himalaya is divided into Tethyan, Higher, Lesser, and sub-Himalayas based on the series of south-verging thrusts [23]. The series of major thrusts from north to south includes Main Karakoram Thrust (MKT), Main Mantle Thrust (MMT), Main Central Thrust (MCT), Main Boundary Thrust (MBT), and Salt Range Thrust (SRT).
The collision of the Indian and Eurasian plates influences the tectonic setting of the Potwar Plateau. This collision resulted in the formation of the Himalayan Mountain range and the uplift of the Tibetan Plateau. The Potwar Basin in northern Pakistan’s western foothills of Himalaya comprises the Salt Range, Potwar Plateau, and Jhelum Plain [25]. The northern, western, eastern, and southern boundaries of the basin are represented by MBT, Kalabagh strike-slip fault, Jhelum strike-slip fault, and SRT, respectively. The Potwar Plateau was subjected to significant deformation and uplift during this process [23]. The study area is dominated by thin-skinned deformation during the Himalayan orogeny, resulting in structural traps in the plateau.
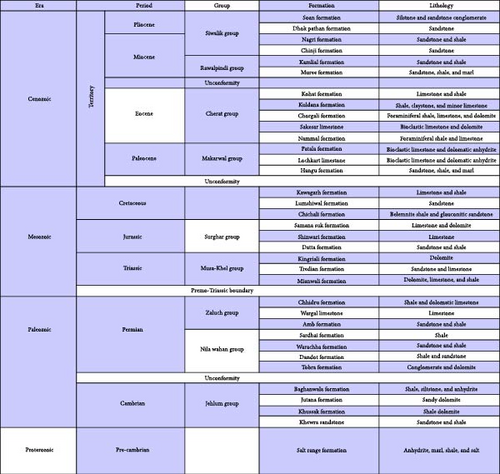
Stratigraphically, the study area is part of a foreland basin that contains a thick sequence of sedimentary rock ranges from Eocambrian to Tertiary age. The Eocambrian Salt Range Formation predominantly comprises thick halite sequences, while subordinate includes marl, dolomite, and shale units. Thin Cambrian overlies the Salt Range Formation (1–2.5 km thick) to Tertiary platform deposits [13]. The Cambrian units include Khewra Sandstone and Kussak Formation which were deposited in littoral to shallow marine environments. A break in deposition was observed during the Ordovician to Carboniferous due to the uplifting of the basin. The Permian sequence in the basin includes Tobra Formation, Dandot Formation, Warcha Sandstone, and Sardahi Formation. The Pre-Paleocene sediments are missing due to uplifting, while thick sequences of Paleocene to Eocene include Lockhart Formation, Patala Formation, Sakesar Limestone, and Chorgali Formation which are deposited. During the late Eocene to Oligocene, the Himalayan mountain-building process was started due to which the Oligocene succession was missing, and molasse deposits were formed. Murree, Kamlial, Chinji, Nagri, and Dhok Pathan Formations are the main product of the uplifting and erosion during the Himalayan orogeny. Figure 3 shows a stratigraphic column of the Potwar Basin [26].
3. Materials and Methods
The necessary datasets for this research were provided by the Directorate General Petroleum Concessions (DGPC), including geophysical data such as well logs (LAS format) and a 3D seismic cube (SEG-Y format). Three wells BLK-OXY-01, BLK-07, and BLK-B2 were analyzed in this study. A database was created before data processing, analysis, quality control, and editing were performed. Seismic structural interpretation was carried out using structural modeling. Petrophysical analysis was conducted on well BLK-OXY-01 to estimate reservoir characterization since it was the only well with a complete set of logs.
A systematic workflow was used to perform a structural interpretation of 3D Balkassar seismic cube data on Petrel software. The cube data was loaded, and a base map was generated. A synthetic seismogram was generated based on a well-to-seismic tie. Horizons were interpreted, and faults were marked in different colors to differentiate their structural interpretation. Based on horizon interpretation, grid maps were generated for the given reservoir rocks, and eventually, these grid maps were converted into time and depth surfaces. Digital wireline logs (gamma ray, sonic log, density, resistivity, porosity, and spontaneous logs) were used as the primary source to estimate petrophysical and reservoir properties. Petrophysical zonation was performed on BLK-OXY-01 based on petrophysical properties such as volume of shale, total porosity, effective porosity, water saturation, and hydrocarbon saturation using Geo-Graphix software.
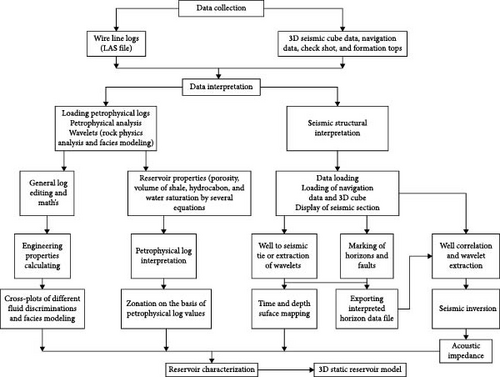
Rock physics analysis was conducted using K-tron Wavelet software on the same BLK-OXY-01 well. Cross-plots were generated to investigate the correlation of rock physics models, fluid discriminators, and the complexity of the subsurface nature of the earth. Eventually, a 3D static reservoir model was generated by integrating the reservoir properties obtained from different techniques, including the structural interpretation and reservoir characterization, as shown in Figure 4.
Integrating seismic, well, and geological data is a reliable technique for subsurface geological interpretation used in the exploration industry. It helps identify surface geological structures in the subsurface and establish correlations, providing insight into a basin’s framework and structural styles, which is crucial for successful hydrocarbon exploration. The integration of seismic and well data interpretations is necessary to evaluate hydrocarbon resources qualitatively [26, 28, 29]. The reflection continuity of geological events was used to map out the structures, and the seismic-to-well tie method with sonic and density logs was employed to identify and map the horizons of interest corresponding to reservoirs of the study area [30]. Petrel was utilized to interpret the seismic data, and the identified faults were validated through consultation with existing literature and surface geological maps [31].
This study used a systematic workflow to perform seismic structural interpretation of the Balkassar area. Interpretation of faults or horizons was based on well to seismic to well tie, and different time and depth surfaces were generated. Conventional logs were the primary source for estimating reservoir properties, and petrophysical zonation was conducted based on properties such as volume of shale, total porosity, effective porosity, water saturation, and hydrocarbon saturation in BLK-OXY-01. Rock physics analysis was also performed in BLK-OXY-01, and cross-plots were generated to establish a correlation between the rock physics model, fluid discriminator, and the complex subsurface nature of the earth. The seismic inversion technique was utilized to convert the time-dependent reflectivity of the earth into impedance data. The integration of reservoir properties was conducted to characterize the reservoir, as shown in Figure 4.
4. Results and Discussions
4.1. Fault Identification and the Horizon Marking
The Potwar region represents the most significantly deformed area of the Potwar fold-and-thrust belt, featuring large low-angle detachment faults that have accommodated more shortening than other parts of the belt. The tectonic framework of the region is mainly influenced by the Salt Range and Domeli thrusts [21, 35]. We used 3D seismic data interpretation and constructed structural cross-sections to determine the subsurface structure. The area’s reverse faults are attributed to its compression regime, resulting in significant structural disruption. To identify and locate these faults, the tectonic history of the Balkassar Oil Field was reviewed, and well data and literature were used to recognize horizons. Faults were identified by analyzing the discontinuity in the horizontal continuity of seismic reflection data. Due to the existence of a compression regime, reverse faults are present in this area, causing severe structural disturbance. The tectonic history of the Balkassar Oil Field is reviewed, which helps in marking and identifying faults tracking and horizon identification. Horizons are recognized by using well data and literature review. The horizons (Figure 5(a)) and faults interpreted due to discontinuity over the horizontal continual of seismic reflection data is shown in Figure 5(b).
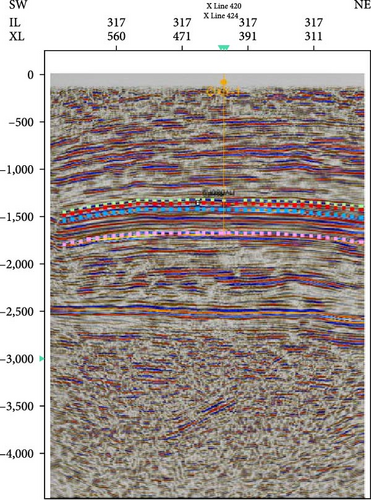
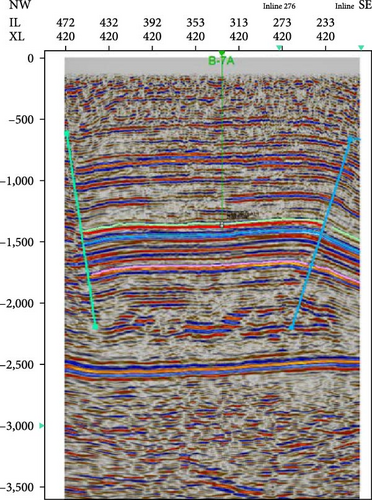
Two major reverse faults are marked around the crest of the Balkassar anticline, as shown in Figure 5(b). The compression regime in the geological formation has led to the development of favorable structures for hydrocarbon accumulation, such as pop-up and anticline traps. In a top-to-bottom order, the four major horizons are the (1) Chorgali Formation (green color), Sakesar Limestone (red color), and Patala Formation (blue color), Khewra Formation (yellow color), respectively. The reverse fault line is marked with beryline color. The time-depth contour map of Chorgali Formation and Sakesar are constructed to generate better compatibility of reflection events. The basic interpreted area consists of two-way reflection times depicting the pop-up structure and demon strata faults.
4.2. Seismic Contour Maps of the Chorgali and Sakesar Limestone
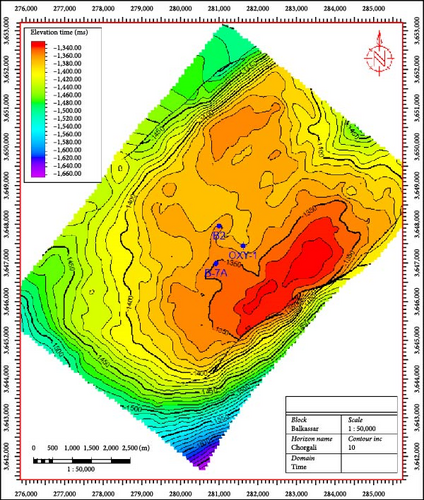
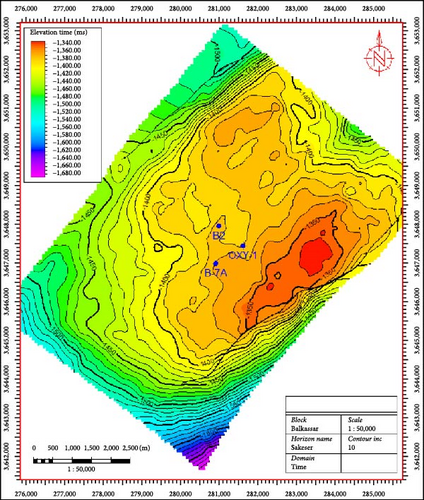
Contour maps are the variation in different geophysical quantities on a full base map in time, depth, and amplitude units. Contour maps extrapolate the seismic data at blank spaces among the different seismic survey lines where data are not acquired. The contour maps constructed at the Chorgali Formation and Sakesar Limestone in time horizons are shown in Figure 6. Both limbs of the anticline are steeply dipping and terminate d by regionally extended thrust faults. These maps clearly give us an indication of back thrusting in the study area. Closed contours in central crest part can be considered as favorable structural trap for hydrocarbon accumulation. The contours’ maps of the formations (Chorgali and Sakesar) show the same pattern as anticline structures. In Figure 6(a), for the Chorgali Formation contour map, the value of time is decreased in the central portion (representing with pale yellow color and there we have the value of time ∼1,3501,450 ms), while it goes increase when toward SE or NW direction (representing with green to blue color and here the values are varying from ∼1,500 to 1,800 ms). The time contour map of the Chorgali Formation is shown in Figure 6(a). The time contour map of Sakesar Limestone is shown in Figure 6(b).
4.3. Depth Contour Maps of the Chorgali and Sakesar Formations
The depth contour map of the Chorgali and the Sakesar Formations is shown in Figure 7. In these depth contour maps, central part in the NW-SE direction of the contour between two faults (blackish line) is represented by the light colors showing less depth than away from faults.
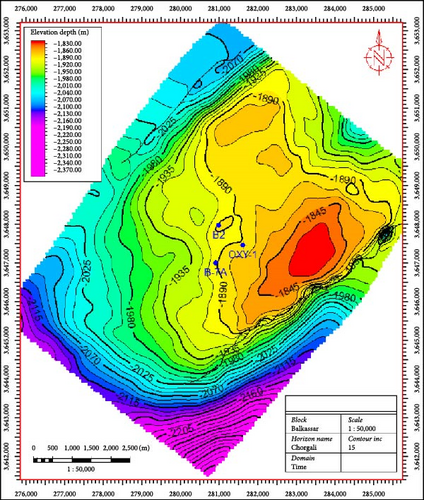
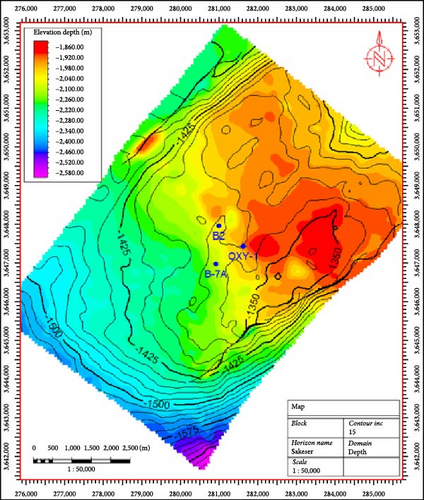
Depth contour maps (Figure 7) are generated through mathematical calculations. The time values are extracted from the seismic section using the time locator tool in the software at the well location. For instance, the two-way travel time (TWT) for the Chorgali Formation is 1.30 s at the well location.
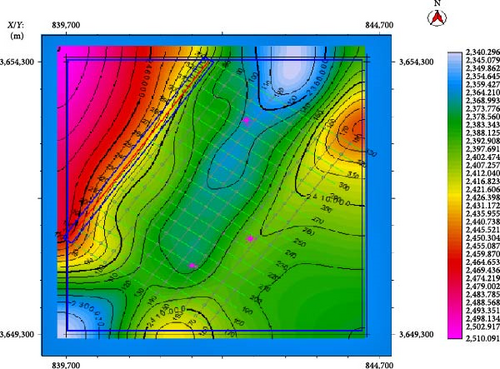
The inline 80-220 and cross-line 160-320 views provide detailed images of the contour map of the Chorgali Formation, as shown in Figure 8. The contour values decrease as we move toward the north, indicating that the formation is shallower in that direction. Seismic data interpretation and well data confirm that the Balkassar area has an anticlinal structure. An anticline is a structural trap formed by the folding of rock strata into an arch-like shape. The rock layers in an anticlinal trap were originally laid horizontally, but earth movement caused them to fold into an arch-like shape. This particular anticlinal structure is a complete structural trap with two faults running northwest to southeast.
4.4. Petrophysical Analysis
It has been observed that carbonate reservoirs hold around 50% of the global oil and gas reserves [36]. However, the characterization of carbonate reservoirs presents more significant challenges than clastic reservoirs. Characterizing carbonate reservoirs has been a longstanding challenge due to their complex and heterogeneous nature. However, applying rock physics techniques has proven advantageous in improving the characterization of carbonate reservoirs [37]. Induced fractures can adversely affect carbonate reservoir quality and geomechanical properties, leading to formation damage. Developing fractures in carbonate reservoirs can introduce elastic anisotropy that makes velocity interpretation more complex [38]. So, to address the above-mentioned issues, rock physics modeling is applied to enable a better understanding of fracture propagation and its impact on carbonate reservoirs.
Petrophysical analysis plays a crucial role in reservoir evaluation by differentiating productive and nonproductive zones. Using geophysical logs and performing petrophysical analysis makes it possible to identify reservoir zones [39]. Well logging data interpretation is an established technique in the oil industry used to anticipate the distribution of petrophysical properties within reservoirs. It can provide comprehensive information about pore size distribution and porosity measurements. The petrophysical properties are quantitatively estimated using well log analysis. The petrophysical study focuses on determining essential parameters such as the shale volume within the reservoir rock and the porosity and saturations [40]. Moreover, carbonate reservoirs require a comprehensive understanding of mechanical and petrophysical properties. This knowledge may help to understand the impact of hydrocarbon recovery from carbonate reservoirs.
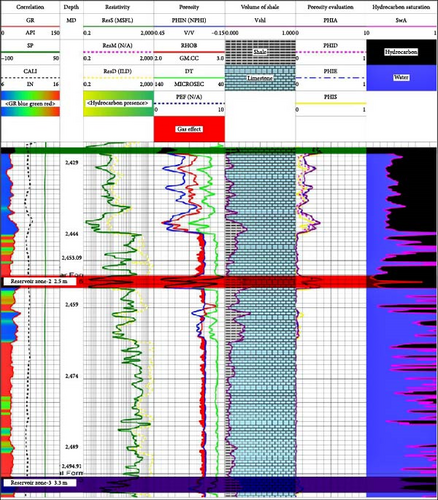
Characterizing carbonate reservoir rocks is crucial for effective reservoir management and production forecasting. However, this can be challenging due to the hydrocarbon-bearing carbonate rocks’ complex pore structure and rock heterogeneity. Standard core analysis techniques may be inadequate for assessing tight carbonate rocks, and special core analysis techniques are needed for more accurate measurements of petrophysical properties and permeability. The essential petrophysical properties of carbonate rock include permeability, porosity, pore size distribution, and relative permeability, which significantly impact reservoir performance predictions [41, 42]. Wireline log analysis techniques estimate the approximate quantities of hydrocarbon and water throughout the formation [43]. In this research, three reservoir zones were identified which further validate by using engineering properties of rock physics, and results are displayed in Table 1.
| Petrophysical property | Volume of shale (Vsh) | Total porosity (Փt) | Effective porosity (Փe) | Water saturation (Sw) | Hydrocarbon saturation (SHC) |
|---|---|---|---|---|---|
| Chorgali limestone Zone-1 green color (2,426–2,427.4 m), BLK OXY-1 | |||||
| Units | v/v | v/v | v/v | v/v | v/v |
| Value (%) | 18 | 6.10 | 4.95 | 32 | 68 |
| Sakesar limestone Zone-2 red color (2,453.2–2,455.7 m), BLK OXY-1 | |||||
| Value (%) | 22 | 4.3 | 3 | 20 | 80 |
| Sakesar limestone zone-3 blue color (2,495.3–2,498.7 m), BLK OXY-1 | |||||
| Value (%) | 33 | 6 | 4 | 34 | 66 |
The effective porosity value ranges from 3% to 6%. As we can see, the total porosity value is genetically classified based on the defined sedimentologic representation of reservoir rock, as shown in Table 1 and interpreted in Figure 9.
4.5. Rock Physics Analysis
Interpreting well log data involves multiple steps that should not be evaluated randomly to avoid errors. To identify hydrocarbon-bearing zones, the reservoir characterization uses petrophysical and rock physics properties, such as shale volume, water saturation, permeability, elasticity, and wave velocity. These properties are interrelated, and methods like RHOB-NPHI cross-over, reflectivity coefficient, and acoustic impedance (AI) anomaly can be used for analysis [5, 44].
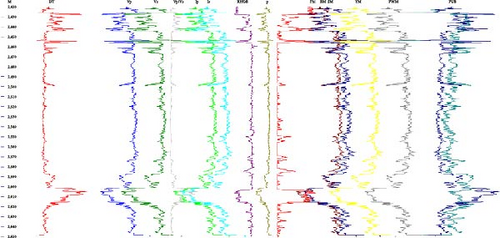
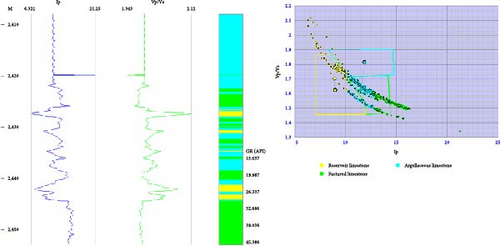
The well logs were analyzed in the reservoir zone between 2,420 and 2,550 m to obtain rock physics properties that integrate petrophysical and rock physics analyses, as shown in Figure 10. Cross-plots, such as Vp–Vs ratio to acoustic impedance, were generated to depict lithological information. Additionally, cross-plots of mu–rho and lambda–rho were created to identify rock physics properties, including porosity, lithological characteristics, and the presence of hydrocarbons. These analyses helped to identify abnormalities and other features in the subsurface.
4.6. Reservoir Characterization
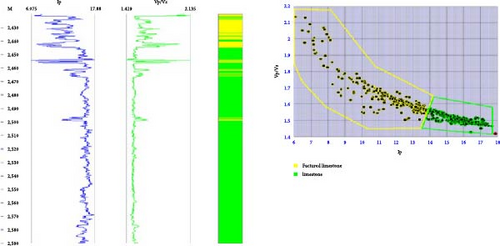
Here, we can easily differentiate and represent limestone and fracture limestone from the logs of the Chorgali Formation. The depth varies from 2,430 to 2,450 m; the Vp/Vs ratio ranges from 1.5 to 2.1; the AI is 6–13 (Pa·cm3), which describe a good range of porosity, i.e. at a depth of 2,450–2,590 m; the Vp/Vs ranges from 1.45 to 1.59 (Figure 11); and the AI (13.5–17.8 Pa·cm3) tells the area of hard limestone in the Chorgali Formation. Figure 12 displays the P-wave velocity–density cross-plot.
Cross-plots visualize correlations between different attributes and identify anomalies that could indicate the presence of hydrocarbons or other fluids in a reservoir. Rock physics examines the physical properties of a reservoir that influence seismic wave propagation, such as porosity, rigidity, and compressibility, to develop a predictive theory for detecting these properties through seismic means. By using cross-plots and rock physics, it is possible to understand the characteristics of a reservoir better and identify potential hydrocarbon indicators [45].
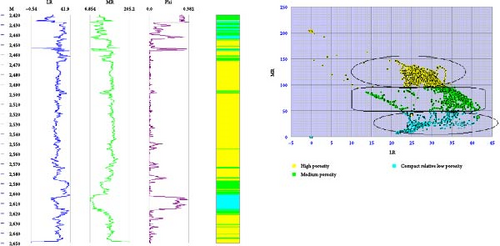
Lambda–rho (incompressibility) versus mu–rho: It is the cross-plots of (λρ) vs. (μρ), an implicit separation into the three zones that can be inferred to be probable high porosity to compact relative low velocity confirmed by the highest porosity log curve value (Figure 13). The plot indicates that λρ is more robust than μρ in the analysis of reservoir zone and fluid identification and that μρ values are relatively low for the multiple correlations which is always more preferred. At the same time, opt for an input parameter or editing log in rock physics analysis among the multiple parameters. However, the correlation by the analysis is mostly done by trial-and-error fashioned when a model is calibrated in accordance with data.
Rock physics is the most appropriate tool to evaluate seismic data interpretation and rock properties. It depends on the reservoir parameter like porosity, permeability, fluid, and lithology to depositional and heterogeneous trends of limestone, shale, and fractured limestone. In influence to rock physics analysis, statistical model has been generated based on the log curves, which are the relationships of compressed and shear velocity and wireline logs, including bulk density, sonic log, and gamma ray. Then, using Gassmann’s fluid formulation method, a model was generated, which ultimately generated the relationship to get the output for different values, including impedance log, young modulus, bulk modulus, shear modulus, lambda–rho, and mu–rho. The above compaction study in Table 2 revealed at a depth of approximately 1.5 km; the limestone value of primary waves is high compared to shale and fractured limestone.
| Curves | Units | Upper values | Lower values | Difference values | Calibrated value | ||
|---|---|---|---|---|---|---|---|
| Minimum values | Maximum values | Mean values for reservoir zone | |||||
| DT | µs (ft) | 147 | 24 | 123 | 40 | 105 | 55.43 |
| Vp | m/s | 7,460 | 2,978 | 4,482 | 2,978 | 7,460 | 5,200 |
| Vp/Vs ratio | — | 2.1345 | 1.419 | 0.7155 | 1.419 | 2.1345 | 1.59 |
| Ip | Pa·cm3 | 17.08 | 6.07 | 11.01 | 6.07 | 17.08 | 11.49 |
| RHOB | gm/cc | 2.95 | 1.95 | 1 | 1.95 | 2.95 | 1.99 |
| SM | Pa | 29.46 | 3.23 | 26.23 | 3.23 | 29.46 | 23.72 |
| BM | Pa | 80.91 | 8.85 | 72.06 | 8.85 | 46.59 | 21.34 |
| YM | — | 80.91 | 8.85 | 72.06 | 29.7 | 85 | 59.7 |
| Phi | Dec | 0 | 0.398 | 0.398 | 0 | 0.398 | 0.398 |
| Lambda–rho | — | 41.9 | 0.58 | 41.32 | 12.03 | 39.30 | 34.67 |
| Mu–rho | — | 205.2 | 6.8 | 198.8 | 6.059 | 110.56 | 26.55 |
4.7. Model Based Seismic Inversion
The wave extraction process involves identifying a signal and requires seismic inversion. The inversion is performed at the center of a strong wave, and the scene spectrum and amplitude are crucial for extracting the spatial repetition of the wave. The extracted cycle is easily measurable and deterministic based on wave extraction, which can also provide information for well log analysis, while correlation or analysis between seismic information and logs can also be made [46, 47]. The initial model provides the missing frequency of seismic information for low- and high-segment structures. Another use of the model is to reduce the uniqueness of the layout.
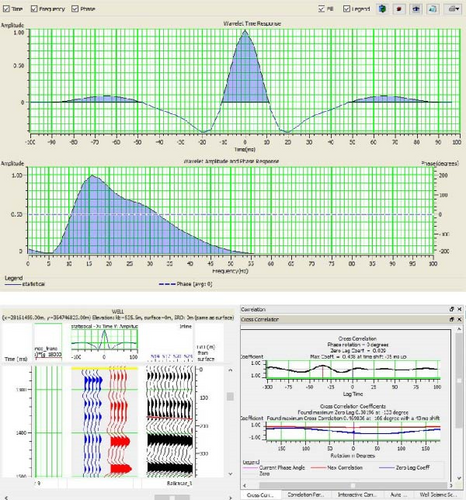
Subsequent inversion of the seismic pile requires the number of seismic logs and density in the pile, in addition to the well logs. In addition to equipment, the proposed approach generally improves synthetic tracing and seismic data acquisition. A highly reflective setup has achieved the expected minimization of seismic traces and observed seismic traces [47]. The Hampson Russel Software (HRS) was used in the survey to facilitate seismic inversion. The model-based inversion artifact is shown in the block diagram as calculated. Figure 14 shows a statistically generated wavelength that indicates both time interval and frequency using seismic data entered near the well.
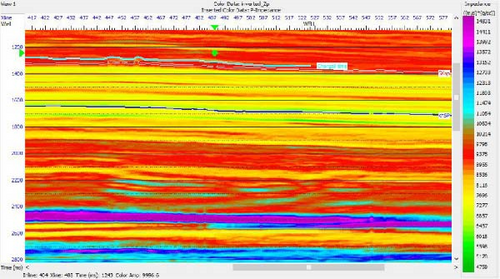
After generating the first model, a repetitive practice was performed to acquire the best fit between the synthetic traces and the seismic data. Subsequently, applying 20 repetitions, the correlation of the fit will be close to 0.978, which is 97.8%, with an error of 0.22, which is 2.2%. This high percentage of correspondence results in a good impedance model, as shown in Figure 15.
Now, using the impedance curve generated by the probe data, an initial model is created between 1,300 and 1,450 ms, including the studied formation. Here, the first map assists to convalesce mislaid low frequencies for data mislaid throughout data processing and aggregation, which are important parameters for model-based inversion.
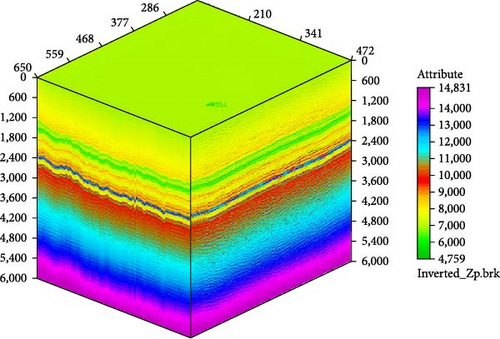
The 3D cube used in the above analysis of the Balkassar block shows the change in impedance at the horizon of the Chorgali and Sakesar (Figure 16). High impedance values are observed in the seismic cube of 2,600 m, and these values decrease slightly as we move upward.
After the impedance estimate for the affected area, a porosity estimate was performed using the above impedance model. For this, the porosity logo of the probe generated during the petrophysical analysis of the BLK-OXY-1 probe and the impedance logo generated during the model-based inversion were drawn. For this analysis, a 200 ms window was selected for targeted formation. The log value between these window areas is displayed graphically and is related to the amount of slate in that area. We then crossed the most appropriate line in all the points presented to obtain the equation calculated for the whole area, with the maximum correlation of the logs. The correlation of the presented values is 0.84% or 84%.
Using the impedance graph spawned from the well data, we create a preliminary model in the range between 1,300 and 1,450 ms. These original sculpts helps to recover mislaid low frequencies for data mislaid throughout data processing and aggregation. It is a major consideration for model-based inversion.
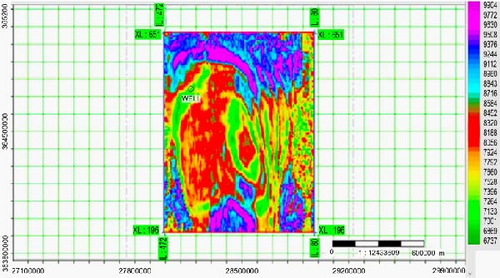
The full 3D cube of the Balkassar block used in the study shows the modification in impedance along the Chorgali horizon. The above time interval shows low impedance in the east-west direction, but values rose in a north-south direction, as shown in Figure 17.
5. Integration of Research Work
To evaluate the quality, quantity, and recoverability of hydrocarbons in reservoirs, combining subsurface data, particularly well log and seismic data, is essential as they offer valuable insights. The petrophysical parameters of porosity, permeability, and fluid saturation are critical to determining a reservoir’s potential and performance [44, 48, 49]. To achieve precise characterization of the reservoirs and create a template for future research and producibility determination, we integrated four techniques: seismic interpretation, petrophysical analysis, rock physics analysis, and seismic inversion. We identified two major reverse faults, generated fault polygons directed toward the NW and SE, and confirmed them through gridding. Based on the petrophysical analysis, the reservoirs showed good pore interconnectivity, with an average effective porosity of 3%–6%.
We carried out a quality check of the seismic interpretation and modeling and the petrophysical analysis using qualitative rock physics analysis. Additionally, the seismic cube displayed high impedance values at 2,600 m, with a slight decrease as we moved up.
6. Conclusions
The seismic structural interpretation confirmed the presence of thrust faults, indicating that the area is in a compression tectonic regime that resulted in the formation of an anticlinal structure. Seismic sections, interpreted in both time and depth, revealed the presence of two major thrust faults. The results showed that the central area between two faults is a suitable structural trap for hydrocarbon accumulation, with marked reservoir zones indicating high porosity values. Porosity and density confirm the reservoir zone. The three reservoir zones are designated Zone 1 (2,426–2,427.4 m), Zone 2 (2,453.2–2,455.7 m), and Zone 3 (2,495.3–2,498.7 m) based on petrophysical data using various electrical logs. This integrated reservoir simulation study in the Potwar Plateau region has better understood complex carbonate reservoirs, specifically in the Balkassar Oil Field (study area). Techniques such as 3D seismic interpretation, petrophysical analysis, rock physics analysis, and seismic inversion were used to develop a future reservoir characterization. In a nutshell, it has been concluded that the integrated study is an effective tool for assessing the hydrocarbon potential of carbonate reservoirs.
Conflicts of Interest
The authors declare that they have no conflicts of interest.
Acknowledgments
The authors would like to express their utmost gratitude to the Directorate General of Petroleum Concession (DGPC) of Pakistan for providing the essential data required for this research. Furthermore, our special thanks and appreciation to LMK Resources Pakistan (Private) Limited (LMKR), Islamabad, Pakistan, GeoSoftware (HampsonRussell and PowerLog), and Petrel software. Thanks are also due to K-tron and the Geophysical Lab of the Department of Earth and Environmental Sciences, Bahria University Islamabad, Pakistan, for providing the necessary platform and software to successfully conduct this research within the stipulated timeframe.
Open Research
Data Availability
The seismic and well data used to support the findings of this study are restricted by DGPC to protect data confidentiality. The datasets presented in this article are not readily available because the data used for this research are highly confidential and are the property of the DGPC. It can only be provided to university students for research purposes with permission from the DGPC.


