The Performance and Robustness of Power Protection Schemes for Grid-Connected PV Systems Under Varied Smart Inverter Controllers
Abstract
The increasing use of inverter-based distributed generation requires a comprehensive study of its effects on fault analysis and the effectiveness of protection systems in distribution networks. This study examines the impact of different inverter control modes on multiple types of protective relay schemes. These include different overcurrent relay (OCR) schemes, both standard and nonstandard tripping characteristics, optimal coordination approaches, and different grid operation scenarios. The investigation is conducted through the utilization of grid-connected and islanding operation modes, with fault resistance values of 0 and 5 Ω. The study is carried out on a 14-bus CIGRE network which includes two photovoltaic (PV) farms with a capacity of 10 MVA each. The research provides several significant contributions, including the analysis of fault current contributions, examination of issues in OCR protection, investigation of the influence of fault impedance levels on OCR performance, evaluation of ideal coordination methods, and carrying out a comparative analysis utilizing optimization technique by using the water cycle optimization algorithm (WCA) and the particle swarm optimization algorithm (PSO). In addition, to guarantee the robustness of the suggested protection strategy, this work adopts a hardware-in-the-loop approach. The OMICRON-256 system is utilized to carry out real-time testing on a SIPROTEC 7SJ62 multifunction protection relay, which validates the effectiveness of the proposed method in protecting microgrids under different PV control strategies. The total operating time for the nonstandard tripping scheme was 12.077–12.3003 s for PSO and WCA, respectively, while for the standard tripping scheme, it was 12.1226 and 12.1564 s. Moreover, these findings offer practical insights that can assist operators in effectively designing the power networks with grid-connected PV systems by showing OCR miscoordination and no tripping events in power systems with PVs under inverters controllers.
1. Introduction
1.1. Motivation
In recent years, the power system has been undergoing a gradual transition from the conventional system dominated by synchronous generators (SGs) to a highly interconnected system with a significant presence of photovoltaic (PV) sources. To mitigate the power fluctuations caused by the intermittent nature of PV sources, these sources are integrated with the grid through inverters [1]. To ensure the reliability of the interconnected inverter-based distributed generation (IIDG), many countries have implemented grid codes that take into account the thermal capabilities of semiconductor switches. These grid codes incorporate requirements such as fault ride-through (FRT) capabilities at both low and high frequencies [2] to limit the fault current. However, the fault current characteristics can be influenced by different control techniques employed by IIDG [3]. It has been reported in the literature that the fault current, IF, contributed by IIDG is generally within the range of 1.1–2 times the rated current, IR [3, 4]. This low fault current magnitude makes it challenging to detect faults using conventional overcurrent relay (OCR) in distribution systems [2, 4]. Moreover, the fault current level depends on factors such as real-time power generation capacity and the location of PV sources [5]. The cumulative effect of these factors can lead to relay misoperation, compromising the security of the system, as well as loss of relay coordination and relay blinding, causing dependability issues. Therefore, it is vital to address the influence of the evolving distribution power system on fault detection and protection. This necessitates the investigation of the impact of different control techniques employed by IIDG on identifying faults, developing a sensitive power protection system, and ensuring the robustness and stability of the power grid during its transition to a more sustainable and renewable energy-based system. This paper attempts to be one of the first to investigate the challenges of OCR protection proposals and coordination associated with defect detection in the context of the changing dynamics of power systems under different control techniques on PV inverters.
1.2. Literature Review
PV-connected systems have a significant impact on the short-circuit current in power systems, thereby influencing their overall short-circuit capacity [6, 7]. In different studies, the individual contribution of a single PV system to the fault current is negligible due to its small size and the current limitations of the inverter, a high penetration of PV systems in the power networks can substantially alter the fault currents, leading to adverse effects on the protection system’s operation [3, 8]. Therefore, it is crucial to model the contribution of PV systems to the fault current and extend the traditional short-circuit analysis to accommodate power networks with PV system integration. The short-circuit analysis serves various purposes, such as evaluating fault current magnitudes to determine the breaking capacity of interrupting devices and establishing a basis for protection system coordination such as OCR to ensure selectivity. Several factors influence the contribution to the short-circuit current, including environmental conditions, maximum inverter current flow, self-protections of PV systems, fault location and type, and the behavior of the PV system during faults, primarily governed by the inverter control system [9, 10]. The short-circuit current computation (SCC) plays a crucial role in relay protection settings and coordination, fault location, and supply restoration. SCC results are also essential for selecting protection equipment and designing busbars, ensuring overall system safety and differentiation. Consequently, real-time SCC must have two essential qualities: speed and high accuracy [11]. However, during faults, the behavior of IIDGs differs significantly based on internal logic control. The SCC contribution of IIDGs is typically within the range of 1.06–1.2 p.u. on the base rating [8, 12–14], or 1.1–1.5 p.u. according to other studies [15, 16]. Furthermore, the SCC waveform exhibits a fast initial spike lasting a few 100 μs or less, potentially exceeding 2.0 p.u. on the IIDG’s base rating, followed by a regulation period of a few 100 ms, which varies based on technology and manufacturer control [17].
In addition, IIDGs operate as grid-following devices, independent of the distribution grid operator (DGO) or consumer unit, and are commonly associated with variable renewable energy sources, such as PV [18, 19]. For example, the control strategy employed by IIDGs significantly influences the characteristics of the fault current, particularly when considering the low voltage ride-through (LVRT) control strategy. The LVRT requirements necessitate the adjustment of IIDG control strategies, including constant power, FRT, and off-grid modes [20, 21]. Previously, the contributions of inverter-based distributed generators (IIDGs) to fault currents were typically disregarded in steady-state fault calculations due to their limited magnitude, usually within 50% of the rated current of the inverter [22–24]. However, modern grid code standards increasingly require IIDGs to remain connected during faults to support grid voltages by injecting positive-sequence reactive current and aid in fault recovery through reactive power injection [25–27]. This is particularly significant in microgrid applications where IIDGs may serve as the primary energy source. With the implementation of grid code standards, such as LVRT and reactive current injection (RCI) requirements, as well as the growing integration of IIDGs in power systems, the fault current contributions from IIDGs can no longer be neglected. Furthermore, advanced grid code requirements for microgrid operation may mandate IIDGs to inject negative sequence current as well, serving as a fault detection signal for microgrid controllers [28–30]. Accurate modeling of IIDGs for fault current calculations is crucial for applications such as adaptive and new relay protection schemes [31, 32]. However, the widely adopted IEC 60909 standard for fault calculations has not been updated to adequately consider these essential aspects of IIDGs, initially neglecting their contributions to fault currents [24]. The most recent revision of the standard [33] acknowledges the fault current magnitude but overlooks the active and reactive components that rely on voltage dip and specific LVRT and RCI requirements. Nevertheless, in cases where faults occur near the IIDG’s connection point with significant voltage dips, the IIDG’s fault current consists primarily of reactive components, rendering the standard models inaccurate. Inaccurate IIDG models derived from the IEC 60909 standard can lead to flawed fault calculation results, particularly concerning fault current distribution, thereby compromising the appropriate configuration of relay settings and coordination. This issue is particularly critical in microgrids with high IIDG penetration, especially during islanded operation [34], where IIDGs serve as the primary source of power generation.
As smart inverter-based distributed energy resources become more important, automation and system integration are increasingly crucial for real-time monitoring of key variables at both distribution substations. These real-time data enable distribution system operators to respond to ensure the reliable and continuous operation of smart inverters while coordinating with transmission system operators during steady-state, dynamic, and transient events [35]. The study [35] has reported that faults have led to the loss of a substantial amount of PV generation. These incidents were recorded by a supervisory control and data acquisition system, which operates at a sampling rate of one sample every 4 s. Improved visibility would enhance the understanding of distributed energy resource responses across local electrical power systems, and even wider networks. Additionally, the growing presence of smart inverters in the distribution network (DN) is replacing a significant share of the reactive power resources traditionally connected to the transmission network. However, with the high penetration of distribution generations (DGs), the system dynamics and interdependence between the distribution and transmission networks have strengthened, making it necessary to treat them as interconnected systems. This growing interconnection means DNs now play a more active role in supporting transmission network operations during both normal and abnormal conditions [36]. This highlights the importance of studying and investigating the impact of PV systems and inverter control models on the power system and short-circuit calculations.
1.2.1. The Short-Circuit Calculation Standards in the Presence of Renewable Energy Resources
The IEC standards and software simulations before 2003, used for fault calculations did not take into account the significant contributions of software IIDGs to fault currents. As shown in Table 1, which references [37–55], the gap in the research is highlighted. The short-circuit calculations in [37–39, 56] conducted in 2000 and 2001 were based on IEC 60909, disregarding the contributions of IIDGs, as well as inverter limits and grid support. Furthermore, enhancements to the procedures were made in [40, 41] in 2011; however, they did not account for the contribution of IIDGs to fault current. In [42, 43] studies, published in 2016, IIDG presence and its contribution to fault current were considered using calculations based on IEC 60909-2016, without the use of additional software. By IEEE 1547-2018 [44], assumed that all factors related to IIDG would be concealed during short-circuit calculations when an IIDG is present. The inclusion of IIDG in the DIgSILENT PowerFactory software was introduced in 2019 [45]. In Li and Wang’s [47] and Kim’s [48] studies, calculations were performed using MATLAB software and based on the IEEE standards. A new standard, IEEE 2800, was developed in [52] for 2022, considering IIDG’s contribution to fault current, inverter limits, and grid support. To further enhance their results, Mabote et al. [50] and Davi et al. [51] utilized PowerModels and PSCAD/EMTDC based on IEEE 2800-2022. Subsequently, in 2023, the IIDG’s short-circuit contribution was incorporated into the ETAP program [54]. Table 1 highlights substantial progress in inverter control during fault scenarios. While there is a growing emphasis on this area of research to enhance grid support, traditional overcurrent protection devices have been remained underdeveloped. These conventional devices face challenges in detecting or isolating faults because the fault current differs based on the type of smart inverter control. Furthermore, traditional protection systems were designed for fault currents from conventional grids, but with the introduction of solar energy, both the magnitude and direction of fault currents have changed significantly.
| Ref. no. | Short-circuit calculation model | IIDG contributions to the fault current | Inverter limits | Voltage support (grid code) | ||
|---|---|---|---|---|---|---|
| Standards | Software | |||||
| 38 | 2000 | IEEE 929-2000 | ✘ | ✘ | ✘ | ✘ |
| 39 | 2001 | IEC 60909-2001 | ✘ | ✘ | ✘ | ✘ |
| 40 | 2001 | IEEE 242-2001 | ✘ | ✘ | ✘ | ✘ |
| 41 | 2003 | IEEE 1547-2003 | ✘ | ✘ | ✘ | ✘ |
| 42 | 2006 | ✘ | MATLAB | ✓ | ✘ | ✘ |
| 43 | 2011 | IEEE 1547.2011 | ✘ | ✓ | ✘ | ✘ |
| 44 | 2016 | IEC 60909-2016 | ✘ | ✓ | ✘ | ✘ |
| 45 | 2018 | IEEE 3002.3-2018 | ✘ | ✘ | ✘ | ✘ |
| 46 | 2018 | IEEE 1547-2018 | ✘ | ✓ | ✓ | ✓ |
| 47 | 2019 | IEC 60909 | DIgSILENT PowerFactory | ✓ | ✓ | ✓ |
| 48 | 2021 | IEC 60909-2021 | ✘ | ✓ | ✓ | ✓ |
| 49 | 2021 | ✘ | MATLAB | ✓ | ✓ | ✓ |
| 50 | 2021 | IEEE 1547-2018 | MATLAB | ✓ | ✓ | ✓ |
| 51 | 2022 | IEEE 2800 | ✘ | ✓ | ✓ | ✓ |
| 52 | 2023 | ✘ | PowerModels.jl (PMs) | ✓ | ✓ | ✓ |
| 53 | 2023 | IEEE 2800-2022 | PSCAD/EMTDC | ✓ | ✓ | ✓ |
| 54 | 2023 | ✘ | MATLAB | ✓ | ✓ | ✓ |
| 55 | 2023 | IEEE 2800-2022 | PSCAD/EMTDC | ✓ | ✓ | ✓ |
| 56 | 2023 |
|
ETAP | ✓ | ✓ | ✓ |
1.3. Contributions
- •
Investigating the contribution of fault current from different PV systems under five PV control strategies employed by IIDGs. By analyzing the impact of control strategies and fault locations on fault current contributions, the study highlights the significance of these factors in understanding the behavior of IIDG systems during faults at a 14-bus CIGRE network with two 10 MVA PV farms.
- •
Early exploration of challenges in OCR protection: The paper addresses the research gap by conducting an early exploration of the challenges associated with defect detection and coordination of OCR protection schemes in evolving power systems. Specifically, the focus is on examining the influence of different control techniques utilized in PV inverters. This investigation contributes to the understanding of OCR protection within the context of evolving power systems and light on the implications of various control techniques employed in PV inverters.
- •
The study validates the microgrid protection scheme through hardware-in-the-loop (HIL) testing, utilizing OMICRON-256 with SIPROTEC 7SJ62 to confirm the effectiveness of the proposed protection schemes under different PV inverter control strategies in real-time scenarios.
- •
Investigating the impact of different levels of fault impedance on OCR performance under various PV control models and penetration scenarios, including islanded operation.
- •
Optimal coordination schemes utilizing the nonstandard and standard tripping characteristics are tested, evaluated, and compared under different IIDG control systems in terms of minimizing total tripping time.
- •
Finally, a comparative analysis of the proposed optimal coordination approaches is performed under different fault and PV operation scenarios by using the water cycle optimization algorithm (WCA) and the particle swarm optimization algorithm (PSO). This analysis provides network operators with initial insights into the potential impact of PV inverter control strategies on fault contribution and relay setting, aiding in decision-making and network planning.
1.4. Outline of Paper
The paper follows a structured approach to address the research objectives. Section 2 provides an overview of the power distribution grid characteristics with IIDG during fault occurrence. In Section 3, the problem statement of OCRs coordination for power networks with IIDGs is illustrated. The simulation results and discussion are presented in Section 4. Finally, Section 5 presents the conclusions drawn from the study.
2. Distribution Grid Characteristics With IIDG During Fault Occurrence
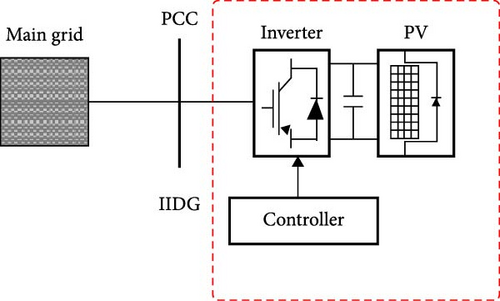
As described in Equation (1), the fault current magnitude in IIDGs is influenced by the intermittent renewable energy source and the variation of positive-sequence voltage at the PCC () and based on behavior a control function, f. During fault conditions, PV plants operate under different control strategies [55, 57], which can lead to faulted phase currents being smaller than healthy phase currents. This complicates the identification of the faulty phase based on the phase’s current magnitude. In the subsequent section, the impact of various operating modes (five main IIDG control categories) on the contribution of fault current by a PV plant is described and presented.
2.1. Control Strategy A
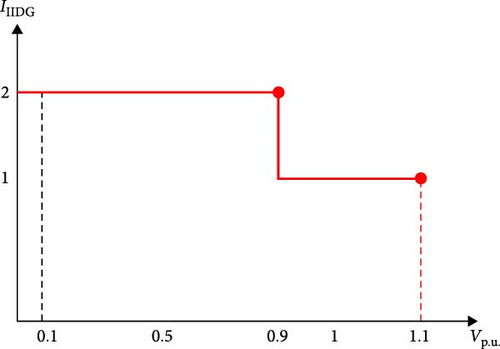
The control strategy, mode A, described by Equation (2) imposes a limitation of 2.0 p.u. on the controlled fault current, determined by the PCC voltage, . Figure 2 demonstrates the relationship between the current supplied by the IIDG (IIIDG) and . Specifically, if the bus voltage falls within the range of 0.9–1.1 p.u., the current is reduced to 1.0 p.u. This control characteristic ensures that the fault current remains within specified limits based on the PCC voltage:
2.2. Control Strategy B
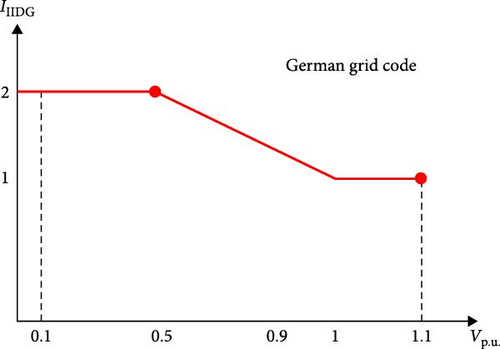
Following the guidelines outlined in the German grid code [55, 57], it is mandatory for PQ for DGs, including turbine generations and PVs, within a microgrid to possess the LVRT capability. This feature enables these DGs to support voltage levels during fault conditions by injecting reactive power. The fault current, IIIDG, as depicted in Figure 3 and determined by Equations (3), is categorized into three distinct areas based on the level. These divisions allow for a better understanding of the fault current behavior and assess the impact of the LVRT capability on voltage stability within the microgrid. This control characteristic implemented for fault current regulation ensures that if the falls between 1 and 1.1 p.u., the current is limited to 1 p.u. In case, the recorded level under 0.5 to 0 p.u., the IIIDG is limited to 2 p.u. In addition, this control strategy effectively maintains the fault current when by using a linear limits relationship between the voltage and current level at the PCC () for ensuring the stability and reliability of the system:
2.3. Control Strategy C
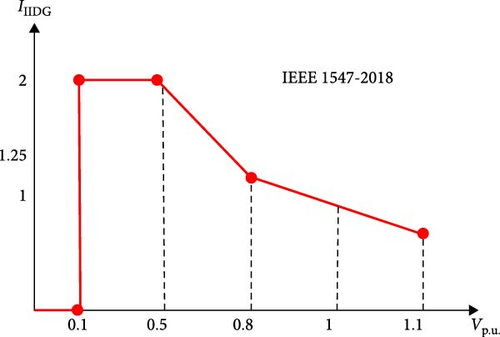
As per the guidelines specified in IEEE 1547-2018 [10, 55], IIDGs are required to withstand fluctuations in voltage while facilitating the exchange of active and reactive power with the grid. Therefore, it is required to support multiple operational modes such as Volt–Watt, Volt–VAR, Watt/VAR, constant power factor, and constant reactive power. The control strategy, mode C, is employed to enable the flow of fault current through different stages. The IIIDG is limited under five areas, as described in Equation (4) and shown in Figure 4. This flexibility in controlling the fault current, IIIDG, behavior allows for effective adaptation and optimization of the IIDG’s response to various grid conditions, enhancing the overall stability and performance of the system:
2.4. Control Strategy D
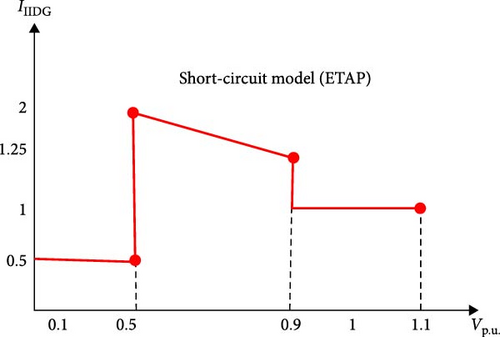
The current-limiting effect and operational modes of the inverter, as specified by the equations in the IEEE 1547 standard, were analyzed using the transient analysis software ETAP. The behavior of the inverter during fault conditions, generation mode, and shutdown was visually represented on the inverter SC model page, providing a comprehensive understanding of its response. This study employed a combination of numerical simulations and graphical illustrations to investigate the current-limiting capabilities and diverse operating scenarios of the inverter, aligning with the requirements outlined in the IEEE 1547 standard, as described in Equation (5) and shown in Figure 5:
2.5. Control Strategy E
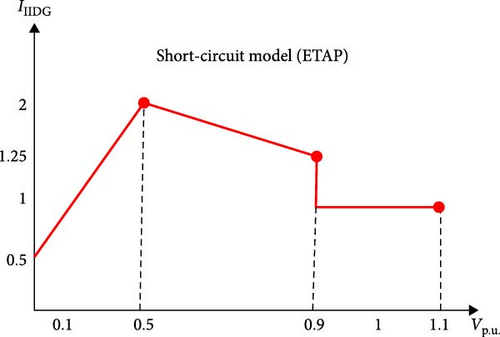
In the IEEE 1547 standard and ETAP [10, 55], the presented control strategy, mode E, is more flexible compared to mode D, as shown in Figure 6. The control mode E is implemented based on three areas for fault current regulation. First, if the falls between 0.9 and 1.1 p.u., the current is limited to 1 p.u. In case, the the recorded level between 0.5 to 0.9 p.u., the IIIDG is limited based on the linear limits relationship between the voltage and current level (). In addition, this control strategy effectively maintains the fault current when by using a linear limits relationship between the voltage and current level at the PCC ():
3. Problem Statement: OCRs Coordination for Power Network With IIDGs
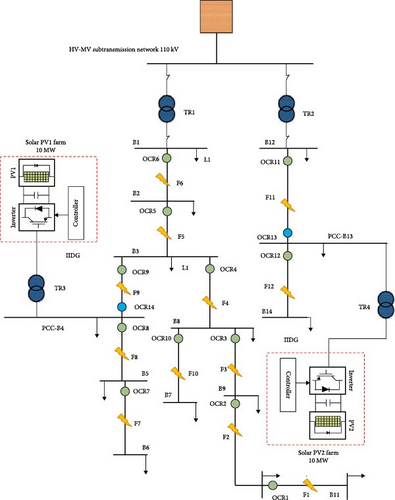
The OCR protection scheme for a power network equipped with IIDGs encounters various challenges, especially during fault conditions. As previously discussed, inverter control plays a crucial role in the control strategy, as emphasized by IEEE 1547 and grid code specifications. Figure 7 illustrates the power distribution system that receives power from the main grid and IIDGs, which is then distributed through lines and protected using OCRs. In the absence of PV1 and PV2, if a fault occurs at point F1, the fault current contribution is only from the main grid, and primary protection operation by R1 is necessary to safeguard the line. In case of R1 delay or failure to detect the fault, R2 acts as a backup with coordination time interval (CTI) considerations between the two relays. However, when PV1 and PV2 are connected to the grid, the fault current contribution involves the main grid as well as PV1 and PV2, and the magnitude of the fault current depends on the control strategy employed by PV1 and PV2. First, when both inverters 1 and 2 operate under control strategy A, the fault current contribution from PV1 and PV2 is twice their full-rated current. R1 and R4 act as primary protection relays, detecting and isolating the fault, while R2 serves as a backup. However, in compliance with IEEE 1547-2018 and IEEE 2008-2022, inverters must support the grid and consider its requirements and limitations. Second, advanced control strategies (B, C, D, and E) are now widely employed in practical applications and research, and they are also integrated into electromagnetic transient programs. The fault characteristics differ between distribution systems with different control strategies, causing challenges to conventional protection schemes.
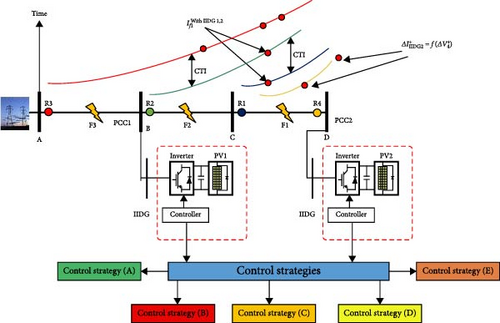
The control strategy employed by the IIDG significantly influences its output current and the behavior of its output current. However, the implementation of a positive-sequence control strategy in IIDG offers benefits such as enhanced stability and simplified control system architecture. By adopting this strategy, the IIDG focuses solely on providing positive-sequence current, streamlining its operation, and ensuring a more stable performance. During its current-limiting modes, as described in Section 2, the inverter is designed to inject a consistent current into the network, adhering to the maximum limit set by the current-limiting curve. Consequently, it can be viewed as a constant-current source in relation to its current magnitude, although not in terms of its active and reactive components. The distribution of the inverter current’s active and reactive components is dictated by one of three operating modes: reactive current priority, real power priority, or user-defined power factor. These modes determine the prioritization and control of the inverter’s active power and reactive power contributions. Therefore, it is vital to investigate the influence of the evolving control strategies on fault detection and OCR protection schemes. Figure 7 shows the impact of the fault component’s voltage (ΔV+) and current () on the OCR schemes for OCRs (R1–R4). The fault components, ΔV+ and are described as the difference between the prefault and postfault voltages and current, respectively. As shown in Figure 7, when control strategy B is implemented in PV1 and PV2 and a fault occurs (F1) at 30% of line 3 (L3), PV1 contributes approximately twice its rated current, while PV2′s contribution is less than 1.4 times its rated current. The variation in fault contributions between IIDGs and the low current levels observed across different voltage regions, as depicted by Equations (3)–(6), directly influences the performance of OCRs in terms of their selectivity and sensitivity.
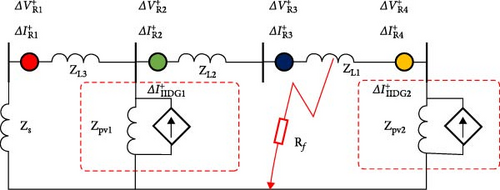
Figure 8 provides a clearer representation of the positive network during fault case F1. The line impedance is represented by ZL, and ZS denotes the equivalent impedance of the power supply. The represents the fault current at the fault point (F1), while ΔIIIDG1 and ΔIIIDG2 represent the fault current components contributions of the IIDG at PV1 and PV2 to the fault point. The fault current magnitude and are determined by multiple factors, including the intermittent nature of renewable energy sources, variations in positive-sequence voltage and , respectively, by the control function f. By applying Kirchhoff’s current law and considering Equations (7)–(12), it becomes evident that the fault current contributed by IIDG directly impacted the fault characteristics, where , , , and are the fault current components at OCR1–4, respectively, while Rf is the fault resistance:
3.1. The Problem Formulation of Optimum OCRs Coordination
- •
Selectivity constraints:
- •
Relay settings constraints:
The constraints for the optimization problem include the minimum and maximum operational times (tmin and tmax) for the OCRs, as shown in Equation (15), where trrepresents the operational time of relay r. The time multiplier setting (TMS) also imposes constraints, as presented in Equation (16), with TMSminand TMSmax representing the minimum and maximum values, respectively. Each relay r has its assigned TMS value (TMSr). In this study, the TMS is treated as a continuous variable, and the OCRs must operate within the prescribed protection scheme’s time limits. Thus, the TMS needs to be set within the allowable range for various fault conditions and even during light overloads. The TMS limits typically span from 0.01 to 3 [60], encompassing the majority of industrial and microgrid OCRs.
3.1.1. Current–Time Characteristics for OCRs
- •
Standard OCRs characteristic: The IEC255-3 standard characteristic equation, represented by Equation (17), as a reference and common scheme [59, 60]:
- •
Nonstandard OCR characteristics: The nonstandard time–current characteristic equation, represented by Equation (18), as an advanced and new scheme compared to inverse standard characteristic. The proposed nonstandard OCR characteristics incorporate a logarithmic function [57] as their fundamental element:
The primary objective of using nonstandard OCR characteristics is to minimize the tripping time associated with different fault currents. The performance of the proposed nonstandard characteristic scheme will be compared to the standard OCR scheme, specifically the inverse definite minimum time characteristic [61]. The applicability of the nonstandard OCR characteristics extends beyond OCR coordination and can be useful in addressing thermal stress concerns in equipment such as transformers and cables.
3.1.2. Optimization Algorithms
In this section, the coordination problem of OCRs in a DN equipped with PVs is formulated as an optimization task with specific constraints. To solve this coordination problem and minimize the tripping time of OCRs, the WCA and PSO have demonstrated effectiveness in solving complex power network and protection problems. The choice of these two optimization algorithms is based on their reputation as powerful and effective methods for tackling complex problems in engineering. Extensive research has shown that these algorithms have the capability to address intricate engineering challenges and deliver promising results. They have demonstrated their effectiveness in various applications and are well-regarded for their ability to handle complex optimization tasks. Their selection for this study is driven by their proven track record in solving intricate engineering problems, providing confidence in their potential to tackle the specific optimization challenges at hand.
The WCA draws inspiration from the natural water cycle and has been found to outperform standard optimization algorithms. The optimization process is implemented using the MATLAB/SIMULINK toolbox. The application of the WCA approach for microgrid protection coordination is described in previous works [62]. In our study, the WCA is utilized to achieve the minimum tripping time for all OCRs (primary and backup) by solving Equation (13) while considering the relay constraints presented in Equations (14)–(16). On the other hand, PSO is a contemporary and efficient heuristic optimization method that offers computational efficiency and memory conservation due to its inherent simplicity. It draws inspiration from human social behavior and the swarming behavior of animals. The fundamental principle of PSO involves managing and guiding a population of particles (referred to as a swarm), with each particle representing a potential solution. By utilizing the collective intelligence of the swarm, PSO aims to find optimal solutions to complex problems. The swarm population in PSO serves as the solution space, and individual particles within the swarm represent potential solutions that undergo iterative improvements throughout the optimization process [63].
4. Simulation Results and Discussion
In the results section, the evaluation of the OCR protection schemes for the PV inverters contribution problem in the power network discussed in Sections 2 and 3 is presented. The assessment is conducted using a 14-bus DN based on the CIGRE network model. The objective of this study is to test and evaluate the effectiveness of the proposed OCR scheme under different modes of DN operation, including islanding mode. Furthermore, the investigation in this section focused on examining the fault current contribution of incorporated two 10 MVA PV farms operating under five distinct control strategies employed by IIDGs. The findings contribute to a deeper understanding of fault current dynamics in IIDG systems, offering valuable guidance for the development of effective fault management strategies and enhancing the overall stability and reliability of the OCR protection system in the DNs. In addition, a comparison is made between the proposed scheme utilizing nonstandard and standard tripping curves. The evaluation provides valuable insights into the performance and superiority of the proposed OCR scheme in various operational PV scenarios, highlighting its potential challenges over traditional protection methodologies. Then, the impact of different levels of fault impedance on OCR performance under various PV control models and penetration scenarios is discussed. A comparative analysis of the proposed optimal OCR coordination approaches is performed under different fault, and PV operation scenarios by using the WCA and the PSO are shown. Finally, the HIL testing results are presented.
4.1. Description of the DN
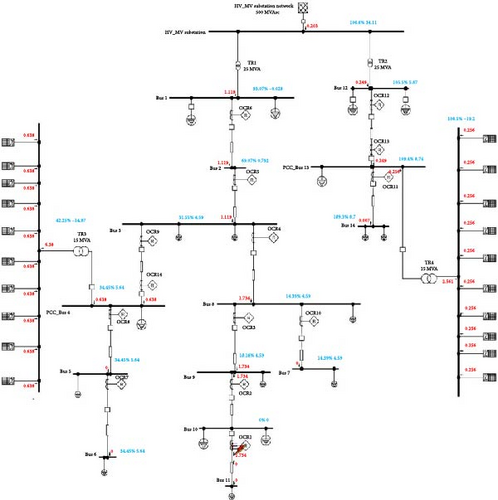
The proposed CIGRE network utilized in this study is a 14-bus DN with specific details provided in [64]. It operates with a high-voltage/medium-voltage (HV/MV) utility source and incorporates two 10 MW PV farms connected through a set-up transformer with a rating of 0.4/12.49 kV, as outlined in [64]. Each 10 MW farm consists of 10 1 MW PV systems. The CIGRE network is protected by a total of 12 OCRs, with primary and backup OCRs assigned to each of the 12 fault locations labeled from F1 to F12. These fault locations represent near- and far-end locations from the sources to evaluate the impact and contribution of the different PV operating control scenarios on the fault detection and protection schemes. The details of the OCRs at the CIGRE network are presented in Table 2 and depicted in Figure 9. To ensure accurate performance, initial load flow and fault calculations were conducted to determine the current transformer ratio and pickup current for each OCR, adhering to the IEC 60909 standard. In this study, the TMS for each OCR is calculated optimally based on the maximum load currents in the line and various fault scenarios, including LLL faults. To ensure the prompt operation of the primary OCRs, the CTI is selected to be 0.3 s [57]. Additionally, the pickup current for the OCRs is set at 1.2 times the full load current. These parameter settings are crucial in achieving fast and reliable operation of the OCRs, taking into account the load characteristics and fault scenarios.
| OCR | CT ratio | Pickup current (A) |
|---|---|---|
| OCR1–4 | 200/1 | 50 |
| OCR5 and OCR6 | 200/1 | 150 |
| OCR7–12 | 200/1 | 50 |
| OCR13 and OCR14 | 300/1 | 300 |
4.2. Simulation Results
- •
Scenario A: The power sources of the CIGRE network consist of a main HV/MV utility feeder and two 10 MVA PV farms, as illustrated in Figure 9. The objective of this grid operation is to assess the performance and power grid and the OCR scheme in the presence of utility supply and under different PV control modes. As explained in Sections 2 and 3, the introduction of PVs introduces complexities in changing the fault contributions characteristics and achieving optimal coordination of OCRs. In addition, by studying the grid performance under different levels of fault impedance (0 and 5 Ω), this evaluation of the CIGRE network aims to provide valuable insights into the challenges for achieving optimal OCR coordination in modern power network configurations with PV integration.
- •
Scenario B: In islanding mode, a specific section of the DN remains energized by only the PV systems, even in the presence of internal faults. By operating the CIGRE network in islanding mode and evaluating the performance of the OCR scheme and fault contributions characteristics across different levels of fault impedance (0 and 5 Ω), the research highlights the challenges of developing OCR protection schemes and maintaining power supply during fault conditions and enhancing the stability of the grid in case of islanding mode.
- •
Network configuration: Setup the CIGRE network, as shown in Figure 9, according to the configurations for Scenarios A and B.
- •
Inverter control methods: Implement the five control methods (Control A, B, C, D, and E) in the network. These methods include those outlined in the Germany grid code and IEEE 1547:2018, as well as other prevalent control approaches.
- •
Fault injection: Simulate fault conditions with varying impedances (0 and 5 Ω) to observe the impact on fault contributions and OCR performance. Fault resistance values can lead to significant miscoordination or nontripping events in OCR protection systems. Fault resistance, which occurs when there is an impedance at the fault point, reduces the magnitude of the fault current. As the resistance increases, the fault current decreases, which may cause the OCR to delay tripping or, in some cases, fail to trip altogether. This is because OCRs are designed to operate based on detecting a threshold current value, and if the fault current is reduced due to high resistance, the relay may not identify the situation as a fault, leading to miscoordination. High-resistance faults, particularly those involving arcing, cause a major challenge to traditional OCRs because they produce fault currents that are often too low for detection by conventional settings. In such scenarios, the relay may struggle to differentiate between fault conditions and normal load fluctuations, resulting in either delayed operation or complete failure to trip. This miscoordination can also compromise the reliability of the overall protection scheme, especially in systems with renewable energy sources (PVs), where inverter control methods further complicate fault detection by altering fault current characteristics based on control settings.
- •
Data collection: Collect data on fault contributions, OCR response times, system voltage and current profiles, and overall grid performance.
- •
Analysis: Compare the performance of the OCR schemes across different control methods and fault scenarios to evaluate their effectiveness and identify any issues related to fault coordination and grid stability.
4.2.1. Test Results for Scenario A
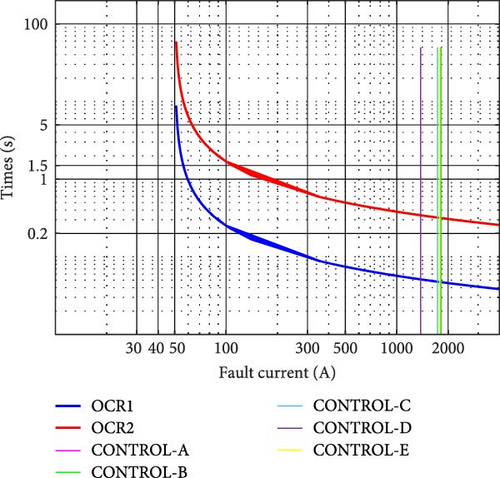
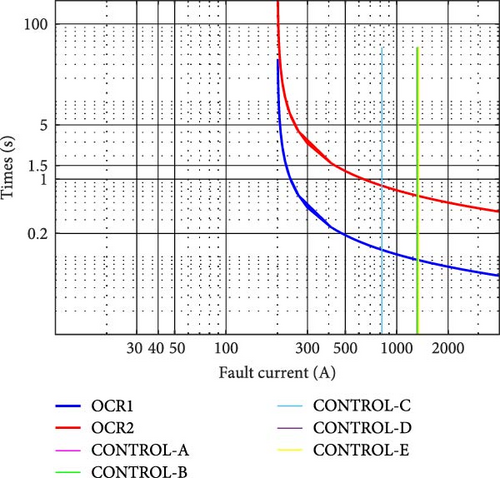
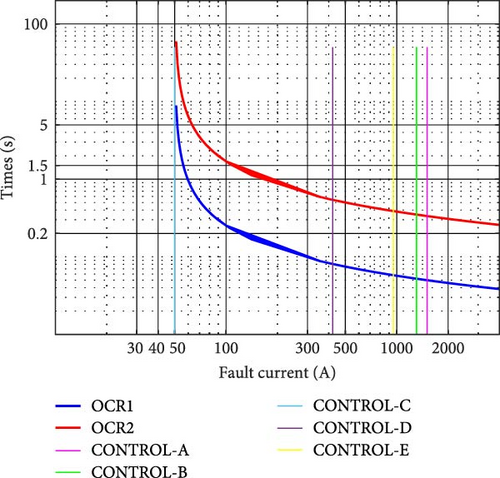
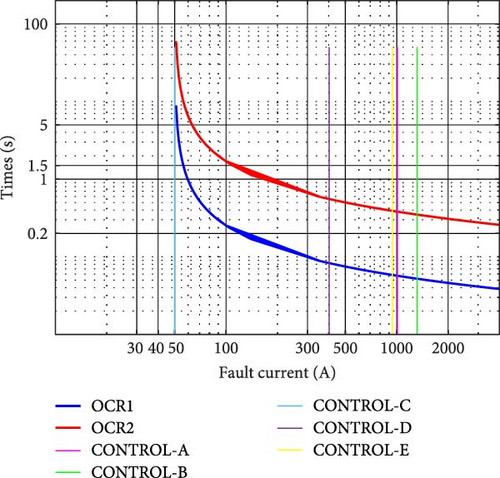
Table 3 presents the results of the fault currents for different scenarios (locations and fault resistance) and PV control modes, namely Control A, B, C, D, and E. Each fault is protected mainly by primary and backup OCR. The results in Table 3 show a variation in fault currents across various fault locations and PV control modes. For example, in fault F1, OCR1 and OCR2 exhibit lower fault currents under Control D compared to the other controls for Rf = 0 Ω, as shown in Figure 10. In Control D, the current-limiting modes of the inverter at , as outlined in the IEEE 1547 standard and described in Equation (5), helped to minimize the high fault values with Rf = 0. This trend continues at most of the other fault locations except the F11 and F12 at OCR11 and OCR13, where Control C shows a lower fault current. Additionally, Control C shows significantly minimum fault currents compared to other control models in the case of the Rf = 5 Ω. For example, Control C recorded a minimum fault current (818 A) compared to other controllers at F1, as shown in Figure 11 and Table 3. The control strategy, mode C, is employed to enable the flow of fault current through five different stages, as described in Equation (4). This flexibility in controlling the fault current, IIIDG, behavior allows for effective adaptation and optimization of the IIDG’s response to various grid conditions, enhancing the overall stability and performance of the system.
Fault location |
Relays pairs |
Control A | Control B | Control C | Control D | Control E | |||||
|---|---|---|---|---|---|---|---|---|---|---|---|
| Fault current (A) | |||||||||||
| Rf = 0 | Rf = 5 | Rf = 0 | Rf = 5 | Rf = 0 | Rf = 5 | Rf = 0 | Rf = 5 | Rf = 0 | Rf = 5 | ||
| F1 | OCR1 | 1820 | 1317 | 1820 | 1317 | 1734 | 818 | 1380 | 1342 | 1783 | 1342 |
| OCR2 | 1820 | 1317 | 1820 | 1317 | 1734 | 818 | 1380 | 1342 | 1783 | 1342 | |
| F2 | OCR2 | 1956 | 1172 | 1956 | 1172 | 1827 | 1061 | 1476 | 1354 | 1814 | 1743 |
| OCR3 | 1956 | 1172 | 1956 | 1172 | 1827 | 1061 | 1476 | 1354 | 1814 | 1743 | |
| F3 | OCR3 | 2014 | 1198 | 2014 | 1198 | 1892 | 1206 | 1520 | 1198 | 1824 | 1198 |
| OCR4 | 2014 | 1198 | 2014 | 1198 | 1892 | 1206 | 1520 | 1198 | 1824 | 1198 | |
| F4 | OCR4 | 2299 | 1199 | 2299 | 1199 | 2209 | 1183 | 1733 | 589 | 1784 | 624 |
| OCR5 | 1566 | 504 | 1566 | 504 | 1568 | 508 | 1568 | 508 | 1568 | 508 | |
| F5 | OCR5 | 2949 | 831 | 2949 | 831 | 2949 | 832 | 2949 | 832 | 2949 | 826 |
| OCR6 | 2949 | 831 | 2949 | 831 | 2949 | 832 | 2949 | 832 | 2949 | 826 | |
| F6 | OCR6 | 6711 | 6697 | 6711 | 6697 | 6711 | 6711 | 6711 | 6711 | 6711 | 6711 |
| F7 | OCR7 | 2082 | 1684 | 2082 | 1684 | 1395 | 315 | 1548 | 1319 | 1668 | 1730 |
| OCR8 | 2082 | 1684 | 2082 | 1684 | 1395 | 315 | 1548 | 1319 | 1668 | 1730 | |
| F8 | OCR8 | 2198 | 1912 | 2198 | 1912 | 1479 | 316 | 1634 | 1363 | 1672 | 1397 |
| OCR9 | 1470 | 1223 | 1470 | 1223 | 1479 | 316 | 1470 | 1222 | 1470 | 1222 | |
| F9 | OCR9 | 1568 | 507 | 1568 | 507 | 1568 | 341 | 1568 | 508 | 1568 | 508 |
| OCR5 | 1568 | 701 | 1568 | 701 | 1568 | 341 | 1568 | 508 | 1568 | 508 | |
| OCR14 | 779 | 779 | 779 | 779 | 686 | 650 | 195 | 195 | 253 | 254 | |
| F10 | OCR10 | 2014 | 1198 | 2014 | 1198 | 1892 | 733 | 1520 | 1198 | 1824 | 1198 |
| OCR4 | 2014 | 1198 | 2014 | 1198 | 1892 | 733 | 1520 | 1198 | 1824 | 1198 | |
| F11 | OCR11 | 3422 | 1178 | 3422 | 1178 | 2666 | 499 | 2804 | 558 | 2837 | 734 |
| OCR13 | 2663 | 501 | 2663 | 501 | 2663 | 499 | 2663 | 500 | 2663 | 468 | |
| F12 | OCR12 | 6709 | 6709 | 6709 | 6709 | 6709 | 6709 | 6706 | 6709 | 1220 | 6709 |
| OCR13 | 802 | 364 | 802 | 364 | 48 | 47 | 237 | 379 | 413 | 412 | |
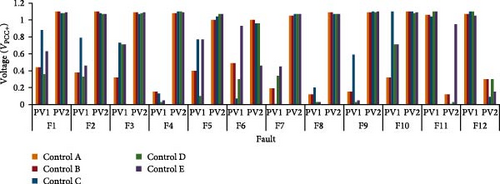
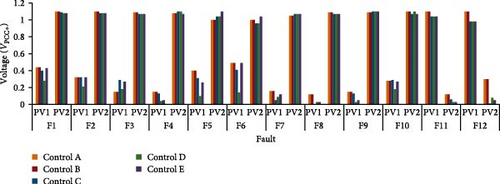
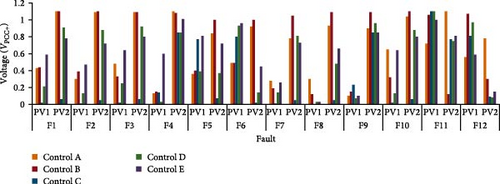
The fault currents for Control A and B show similar behavior and results, this is mainly related to the did not record a value between 0.5 and 0.9, as shown in Table 4, where both controllers worked in the same zone (IIIDG equal to 2 p.u.), as presented in Figures 2 and 3. Furthermore, Control A and B demonstrates a higher fault current under Rf = 0 Ω compared to Control C, D, and E. The PVs contribution to the fault currents is directly related to the which is varied between the PV system location and control mode, as shown in Table 4. Therefore, Control A and B, as presented in Figures 2 and 3, are fed the grid with maximum fault current from PVs (double the rated current). The PV2 shows significantly higher voltage compared to PV1 in all fault locations except F11 and F12, as these faults are closer to PV1, as shown in Figures 12 and 13. A detailed simulation example, as shown in Figure 14, presents the fault calculation for F1 under Control C and Rf = 0 where the PV1 and PV2 contributes with 638 A ( = 0.4 p.u.) and 256 A ( = 1.09 p.u.), respectively, at the secondary side of the transformer. The total PVs contribution in the fault F1 is 894 A out of the 1734 A. This showed that the control strategies, modes A and B, described by Equations (2) and (3), included a limitation of 2.0 p.u. on the controlled fault current; therefore, they showed similar performance when . In addition, if the bus voltage falls within the range of 1–1.1 p.u., the current is reduced to 1.0 p.u. for both control modes.
Fault location |
IIDGs | Control A | Control B | Control C | Control D | Control E | |||||
|---|---|---|---|---|---|---|---|---|---|---|---|
| (p.u.) | |||||||||||
| Rf = 0 | Rf = 5 | Rf = 0 | Rf = 5 | Rf = 0 | Rf = 5 | Rf = 0 | Rf = 5 | Rf = 0 | Rf = 5 | ||
| F1 | PV1 | 0.44 | 0.44 | 0.44 | 0.44 | 0.4 | 0.88 | 0.28 | 0.36 | 0.43 | 0.63 |
| PV2 | 1.1 | 1.1 | 1.1 | 1.1 | 1.09 | 1.08 | 1.08 | 1.08 | 1.08 | 1.09 | |
| F2 | PV1 | 0.32 | 0.38 | 0.32 | 0.38 | 0.32 | 0.79 | 0.21 | 0.33 | 0.32 | 0.46 |
| PV2 | 1.1 | 1.1 | 1.1 | 1.1 | 1.08 | 1.08 | 1.08 | 1.07 | 1.08 | 1.07 | |
| F3 | PV1 | 0.15 | 0.32 | 0.15 | 0.32 | 0.29 | 0.73 | 0.18 | 0.71 | 0.27 | 0.71 |
| PV2 | 1.09 | 1.09 | 1.09 | 1.09 | 1.07 | 1.07 | 1.07 | 1.08 | 1.07 | 1.09 | |
| F4 | PV1 | 0.15 | 0.15 | 0.15 | 0.15 | 0.13 | 0.13 | 0.04 | 0.03 | 0.05 | 0.05 |
| PV2 | 1.08 | 1.08 | 1.08 | 1.08 | 1.1 | 1.1 | 1.1 | 1.1 | 1.07 | 1.09 | |
| F5 | PV1 | 0.4 | 0.4 | 0.4 | 0.4 | 0.31 | 0.77 | 0.1 | 0.1 | 0.26 | 0.77 |
| PV2 | 1 | 1 | 1 | 1 | 1.04 | 1.04 | 1.04 | 1.07 | 1.1 | 1.07 | |
| F6 | PV1 | 0.49 | 0.49 | 0.49 | 0.49 | 0.41 | 0.07 | 0.14 | 0.3 | 0.49 | 0.93 |
| PV2 | 1 | 1 | 1 | 1 | 0.96 | 0.96 | 0.96 | 0.96 | 1.04 | 0.46 | |
| F7 | PV1 | 0.16 | 0.19 | 0.16 | 0.19 | 0.05 | 0.006 | 0.09 | 0.34 | 0.12 | 0.45 |
| PV2 | 1.05 | 1.05 | 1.05 | 1.05 | 1.07 | 1.07 | 1.07 | 1.07 | 1.07 | 1.07 | |
| F8 | PV1 | 0.12 | 0.12 | 0.12 | 0.12 | 0.005 | 0.2 | 0.03 | 0.03 | 0.03 | 0.03 |
| PV2 | 1.09 | 1.09 | 1.09 | 1.09 | 1.07 | 1.07 | 1.07 | 1.07 | 1.07 | 1.07 | |
| F9 | PV1 | 0.15 | 0.15 | 0.15 | 0.15 | 0.13 | 0.59 | 0.03 | 0.03 | 0.05 | 0.05 |
| PV2 | 1.09 | 1.09 | 1.09 | 1.09 | 1.1 | 1.1 | 1.1 | 1.09 | 1.1 | 1.1 | |
| F10 | PV1 | 0.28 | 0.32 | 0.28 | 0.32 | 0.29 | 1.1 | 0.18 | 0.71 | 0.27 | 0.71 |
| PV2 | 1.1 | 1.1 | 1.1 | 1.1 | 1.07 | 1.1 | 1.1 | 1.08 | 1.07 | 1.09 | |
| F11 | PV1 | 1.1 | 1.06 | 1.1 | 1.06 | 1.04 | 1.04 | 1.04 | 1.1 | 1.04 | 1.1 |
| PV2 | 0.12 | 0.12 | 0.12 | 0.12 | 0.06 | 0.006 | 0.03 | 0.03 | 0.03 | 0.95 | |
| F12 | PV1 | 1.1 | 1.07 | 1.1 | 1.07 | 0.98 | 1.1 | 0.98 | 1.1 | 0.98 | 1.05 |
| PV2 | 0.3 | 0.3 | 0.3 | 0.3 | 0.01 | 0.09 | 0.08 | 0.3 | 0.05 | 0.15 | |
This variation in fault currents and voltage levels among OCRs, as shown in Table 4 and Figures 13 and 14, within different fault locations emphasizes the impact of the control model on OCR performance. Table 5 provides the results of the operation time for each OCR under different fault locations and PV control modes. The operation time is measured in seconds and is presented for two fault resistances, Rf = 0 and Rf = 5 Ω. Analyzing the results, variations in the operation times across different fault locations and PV control modes are observed. For instance, OCRs at Rf = 0 scenario consistently demonstrates shorter operation times compared to Rf = 5 for all PV control modes. The OCRs operation time for Control A and B shows similar behavior and results, this is mainly related that both modes recorded the same fault level as presented in Table 3. Additionally, Control A and B demonstrate slightly shorter operation times compared to other PV controls. In terms of power protection sensitivity, Control C, D, and E recorded many miscoordination events. For example, Control C at F12 recorded that the backup OCR did not trip and detected the fault at both Rf = 0 and Rf = 5 Ω scenarios. This trend continues in Control D and E, where OCR14 did not detect the fault (F9) at both Rf = 0 and Rf = 5 Ω scenarios. This is basically due to that the control modes A and B, included a limitation of 2.0 and 1 p.u. on the controlled fault current. The findings emphasize the significance and impact of PV control strategies in achieving optimal operation times for OCRs, thereby improving the overall protection and reliability of power systems. Understanding these variations contributes to the development of efficient and effective control schemes for OCRs, enabling enhanced fault detection and response in power networks.
Fault location |
Relays pairs |
Control A | Control B | Control C | Control D | Control E | |||||
|---|---|---|---|---|---|---|---|---|---|---|---|
| Operational time for OCR (s) | |||||||||||
| Rf = 0 | Rf = 5 | Rf = 0 | Rf = 5 | Rf = 0 | Rf = 5 | Rf = 0 | Rf = 5 | Rf = 0 | Rf = 5 | ||
| F1 | OCR1 | 0.05 | 0.05 | 0.05 | 0.05 | 0.05 | 0.06 | 0.05 | 0.05 | 0.05 | 0.05 |
| OCR2 | 0.33 | 0.37 | 0.33 | 0.37 | 0.34 | 0.43 | 0.36 | 0.36 | 0.36 | 0.36 | |
| F2 | OCR2 | 0.33 | 0.38 | 0.33 | 0.38 | 0.33 | 0.39 | 0.35 | 0.36 | 0.35 | 0.36 |
| OCR3 | 0.59 | 0.69 | 0.59 | 0.69 | 0.60 | 0.71 | 0.64 | 0.66 | 0.64 | 0.66 | |
| F3 | OCR3 | 0.59 | 0.69 | 0.59 | 0.69 | 0.60 | 0.68 | 0.64 | 0.69 | 0.64 | 0.69 |
| OCR4 | 0.85 | 1.00 | 0.85 | 1.00 | 0.87 | 1.00 | 0.93 | 1.00 | 0.93 | 1.00 | |
| F4 | OCR4 | 1.01 | 1.00 | 1.01 | 1.00 | 1.03 | 1.00 | 1.12 | 1.81 | 1.12 | 1.81 |
| OCR5 | 1.45 | 2.85 | 1.45 | 2.85 | 1.45 | 2.83 | 1.45 | 2.83 | 1.45 | 2.83 | |
| F5 | OCR5 | 1.14 | 2.00 | 1.14 | 2.00 | 1.14 | 2.00 | 1.14 | 2.00 | 1.14 | 2.00 |
| OCR6 | 1.43 | 2.53 | 1.43 | 2.53 | 1.43 | 2.53 | 1.43 | 2.53 | 1.43 | 2.53 | |
| F6 | OCR6 | 1.12 | 1.12 | 1.12 | 1.12 | 1.12 | 1.12 | 1.12 | 1.12 | 1.12 | 1.12 |
| F7 | OCR7 | 0.05 | 0.05 | 0.05 | 0.05 | 0.05 | 0.09 | 0.05 | 0.05 | 0.05 | 0.05 |
| OCR8 | 0.31 | 0.33 | 0.31 | 0.33 | 0.35 | 0.64 | 0.34 | 0.35 | 0.34 | 0.35 | |
| F8 | OCR8 | 0.31 | 0.32 | 0.31 | 0.32 | 0.34 | 0.64 | 0.33 | 0.35 | 0.33 | 0.35 |
| OCR9 | 0.64 | 0.68 | 0.64 | 0.68 | 0.64 | 1.19 | 0.64 | 0.68 | 0.64 | 0.68 | |
| F9 | OCR9 | 0.63 | 0.94 | 0.63 | 0.94 | 0.63 | 1.14 | 0.63 | 0.94 | 0.63 | 0.94 |
| OCR5 | 0.98 | 1.29 | 0.98 | 1.29 | 0.98 | 1.78 | 0.98 | 1.47 | 0.98 | 1.47 | |
| OCR14 | 0.18 | 0.18 | 0.18 | 0.18 | 0.21 | 0.22 | No tripping | No tripping | No tripping | No tripping | |
| F10 | OCR10 | 0.05 | 0.05 | 0.05 | 0.05 | 0.05 | 0.06 | 0.05 | 0.05 | 0.05 | 0.05 |
| OCR4 | 0.85 | 1.00 | 0.85 | 1.00 | 0.87 | 1.19 | 0.93 | 1.00 | 0.88 | 1.00 | |
| F11 | OCR11 | 0.05 | 0.07 | 0.05 | 0.07 | 0.05 | 0.11 | 0.05 | 0.10 | 0.05 | 0.09 |
| OCR12 | 0.35 | 0.72 | 0.35 | 0.72 | 0.35 | 0.72 | 0.35 | 0.72 | 0.35 | 0.75 | |
| F12 | OCR12 | 0.33 | 0.33 | 0.33 | 0.33 | 0.33 | 0.33 | 0.33 | 0.33 | 0.56 | 0.33 |
| OCR13 | 0.18 | 0.9 | 0.18 | 0.9 | No tripping | No tripping | No tripping | 0.75 | 0.55 | 0.55 | |
4.2.2. Test Results for Scenario B
Fault currents for different fault scenarios at Scenario B (islanding grid operation mode), including fault locations and fault resistances, under PV control modes A, B, C, D, and E are detailed in Table 6. The results show high variations in fault currents across fault locations over the different control modes at scenario B compared to scenario A, as presented in Table 6. For example, in fault F1, OCR1 and OCR2 exhibit lower fault currents under Control C with 50 A compared to the other controls for Rf = 0 and 5 Ω, as shown in Figures 15 and 16, respectively. This shows that the fault current, IF, contributed by IIDG is generally within the range of 1.1–2 times the rated current. Moreover, the fault current level depends on factors such as real-time power generation capacity and the location of PV sources. The cumulative effect of these factors can lead to relay misoperation, compromising the security of the system, as well as loss of relay coordination and relay blinding, causing dependability issues.
Fault location |
Relays pairs |
Control A | Control B | Control C | Control D | Control E | |||||
|---|---|---|---|---|---|---|---|---|---|---|---|
| Fault current (A) | |||||||||||
| Rf = 0 | Rf = 5 | Rf = 0 | Rf = 5 | Rf = 0 | Rf = 5 | Rf = 0 | Rf = 5 | Rf = 0 | Rf = 5 | ||
| F1 | OCR1 | 1505 | 1012 | 1307 | 1317 | 50 | 50 | 422 | 402 | 955 | 943 |
| OCR2 | 1505 | 1,012 | 1307 | 1317 | 50 | 50 | 422 | 402 | 955 | 943 | |
| F2 | OCR2 | 1221 | 1203 | 1354 | 1699 | 50 | 50 | 423 | 424 | 858 | 1125 |
| OCR3 | 1221 | 1203 | 1354 | 1699 | 50 | 50 | 423 | 424 | 858 | 1125 | |
| F3 | OCR3 | 1590 | 924 | 1524 | 1179 | 50 | 50 | 423 | 394 | 772 | 868 |
| OCR4 | 1590 | 924 | 1524 | 1179 | 50 | 50 | 423 | 394 | 772 | 868 | |
| F4 | OCR4 | 1350 | 1119 | 1541 | 1199 | 717 | 1049 | 429 | 452 | 714 | 761 |
| OCR5 | 726 | 1119 | 651 | 504 | 46 | 342 | 230 | 342 | 533 | 260 | |
| F5 | OCR5 | 773 | 443 | 773 | 831 | 47 | 50 | 233 | 231 | 637 | 443 |
| OCR6 | 773 | 443 | 773 | 831 | 50 | 50 | 233 | 231 | 509 | 443 | |
| F6 | OCR6 | 726 | 650 | 726 | 6697 | 47 | 50 | 234 | 234 | 725 | 727 |
| F7 | OCR7 | 1220 | 1205 | 1433 | 1684 | 50 | 50 | 424 | 484 | 708 | 961 |
| OCR8 | 1220 | 1205 | 1433 | 1684 | 50 | 50 | 424 | 484 | 708 | 961 | |
| F8 | OCR8 | 1280 | 998 | 1415 | 1912 | 50 | 50 | 424 | 422 | 690 | 660 |
| OCR9 | 1508 | 298 | 1415 | 1223 | 46 | 50 | 229 | 422 | 521 | 494 | |
| F9 | OCR9 | 726 | 1272 | 624 | 507 | 46 | 342 | 230 | 275 | 533 | 342 |
| OCR5 | 726 | 1272 | 624 | 701 | 46 | 342 | 230 | 275 | 533 | 342 | |
| OCR14 | 779 | 490 | 701 | 779 | 686 | 713 | 195 | 195 | 253 | 312 | |
| F10 | OCR10 | 1590 | 924 | 1524 | 1179 | 50 | 50 | 423 | 424 | 772 | 868 |
| OCR4 | 1590 | 924 | 1524 | 1179 | 50 | 50 | 423 | 424 | 772 | 868 | |
| F11 | OCR11 | 1500 | 538 | 1390 | 1178 | 517 | 571 | 390 | 553 | 679 | 612 |
| OCR12 | 500 | 226 | 685 | 501 | 515 | 249 | 195 | 223 | 515 | 266 | |
| F12 | OCR12 | 683 | 520 | 672 | 6709 | 571 | 359 | 195 | 276 | 578 | 547 |
| OCR13 | 779 | 364 | 390 | 364 | 48 | 46 | 237 | 236 | 416 | 413 | |
- •
First, the fault currents for Control A and B at scenario B did not show similar behavior and results as scenario A, which can be attributed to the fact that the record values between 0.5 and 0.9, as shown in Table 7.
- •
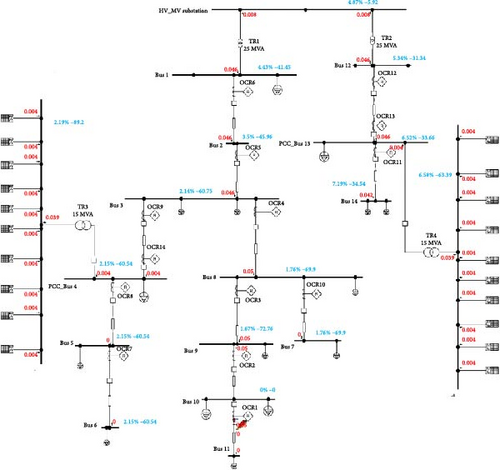
Second, Control D and E show significantly lower fault currents compared to Control A and B at Rf = 0 and Rf = Ω, as presented in Table 6. Control C demonstrates minimum fault currents at Rf = 0 Ω and Rf = 5 compared to Control A, B, D, and E. These variations are influenced by the contribution of PV systems, indicated by , as detailed in Table 7, which differs based on the PV system location and control mode. Except F11 and F12, which are closer to PV1 than PV2, as seen in Figures 17 and 18, PV2 shows a significantly higher voltage than PV1 in all fault sites. A detailed simulation example, as shown in Figure 19, presents the fault calculation for F1 under Control C and Rf = 5 where the PV1 and PV2 contributes with 4 A ( = 0.02 p.u.) and 46 A ( = 0.06 p.u.), respectively, at the secondary side of the transformer. The total PVs contribution in feeding the system and the fault F1 is 50 A. The PVs contribution to the fault currents by Control C is directly related to the which is at the most fault locations are lower than 0.1 p.u. This leads to having a minimum IIIDG and close to zero based on the Control C model, as described by Equation (4) and Figure 4.
Fault location |
Relays pairs |
Control A | Control B | Control C | Control D | Control E | |||||
|---|---|---|---|---|---|---|---|---|---|---|---|
| (p.u.) | |||||||||||
| Rf = 0 | Rf = 5 | Rf = 0 | Rf = 5 | Rf = 0 | Rf = 5 | Rf = 0 | Rf = 5 | Rf = 0 | Rf = 5 | ||
| F1 | PV1 | 0.36 | 0.43 | 0.36 | 0.44 | 0.009 | 0.02 | 0.11 | 0.21 | 0.27 | 0.59 |
| PV2 | 0.66 | 1.1 | 0.66 | 1.1 | 0.057 | 0.06 | 0.33 | 0.91 | 0.7 | 0.78 | |
| F2 | PV1 | 0.29 | 0.3 | 0.29 | 0.39 | 0.006 | 0.01 | 0.08 | 0.13 | 0.18 | 0.47 |
| PV2 | 0.62 | 1.09 | 0.62 | 1.1 | 0.05 | 0.05 | 0.31 | 0.88 | 0.66 | 0.72 | |
| F3 | PV1 | 0.26 | 0.48 | 0.26 | 0.33 | 0.056 | 0.02 | 0.07 | 0.25 | 0.14 | 0.64 |
| PV2 | 0.61 | 1.09 | 0.61 | 1.09 | 0.053 | 0.06 | 0.3 | 0.92 | 0.65 | 0.8 | |
| F4 | PV1 | 0.15 | 0.13 | 0.15 | 0.15 | 0.13 | 0.14 | 0.038 | 0.03 | 0.05 | 0.6 |
| PV2 | 0.54 | 1.1 | 0.54 | 1.08 | 0.04 | 0.85 | 0.26 | 0.85 | 0.62 | 1.01 | |
| F5 | PV1 | 0.4 | 0.36 | 0.4 | 0.4 | 0.31 | 0.77 | 0.1 | 0.39 | 0.26 | 0.81 |
| PV2 | 0.44 | 0.84 | 0.44 | 1 | 0.03 | 0.07 | 0.19 | 0.37 | 0.53 | 0.72 | |
| F6 | PV1 | 0.49 | 0.49 | 0.49 | 0.49 | 0.41 | 0.8 | 0.14 | 0.93 | 0.49 | 0.96 |
| PV2 | 0.35 | 0.92 | 0.35 | 1 | 0.02 | 0.02 | 0.14 | 0.14 | 0.45 | 0.45 | |
| F7 | PV1 | 0.17 | 0.28 | 0.17 | 0.19 | 0.002 | 0.01 | 0.04 | 0.14 | 0.07 | 0.26 |
| PV2 | 0.59 | 0.78 | 0.59 | 1.05 | 0.052 | 0.05 | 0.14 | 0.81 | 0.64 | 0.73 | |
| F8 | PV1 | 0.12 | 0.3 | 0.12 | 0.12 | 0.0006 | 0.0006 | 0.03 | 0.03 | 0.03 | 0.03 |
| PV2 | 0.63 | 0.93 | 0.63 | 1.09 | 0.02 | 0.05 | 0.27 | 0.48 | 0.63 | 0.66 | |
| F9 | PV1 | 0.15 | 0.1 | 0.15 | 0.15 | 0.13 | 0.23 | 0.03 | 0.07 | 0.05 | 0.1 |
| PV2 | 0.62 | 0.9 | 0.62 | 1.09 | 0.048 | 0.85 | 0.26 | 0.96 | 0.62 | 0.85 | |
| F10 | PV1 | 0.27 | 0.65 | 0.27 | 0.32 | 0.005 | 0.02 | 0.07 | 0.13 | 0.14 | 0.64 |
| PV2 | 0.67 | 1.04 | 0.67 | 1.1 | 0.053 | 0.06 | 0.3 | 0.88 | 0.65 | 0.8 | |
| F11 | PV1 | 0.62 | 0.72 | 0.62 | 1.06 | 0.62 | 1.1 | 0.23 | 1.1 | 0.62 | 1 |
| PV2 | 0.12 | 1.1 | 0.12 | 0.12 | 0.006 | 0.77 | 0.03 | 0.75 | 0.03 | 0.81 | |
| F12 | PV1 | 0.57 | 0.56 | 0.57 | 1.07 | 0.55 | 0.81 | 0.19 | 0.97 | 0.15 | 0.59 |
| PV2 | 0.3 | 0.78 | 0.3 | 0.3 | 0.013 | 0.09 | 0.08 | 0.08 | 0.56 | 0.15 | |
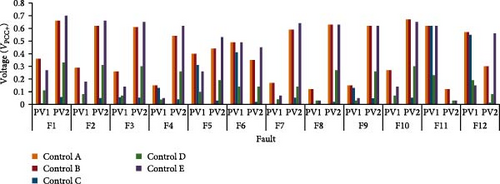
The variation in fault currents and voltage levels among OCRs, as depicted in Tables 6 and 7, highlights the influence of control models on OCR performance. Table 8 presents operation time results for each OCR under different fault locations and PV control modes, measured in seconds for Rf = 0 and Rf = 5 Ω scenarios. OCRs at Control A and B outperform the other controllers in terms of high protection sensitivity with minimum miscoordination events, as shown in Table 8. The fault current values for Control C at Rf = 0 and Rf = 5 Ω was significantly low, which resulted in difficulties in fault detecting and led to instances of no tripping and miscoordination events. The control mode C, is developed to enable the flow of fault current through five different stages, as described in Equation (4). This flexibility in controlling the fault current, IIIDG, behavior allows for effective adaptation and optimization of the IIDG’s response to various grid conditions, enhancing the overall stability and performance of the system. This trend continues with Control D and E where OCR14 fails to detect the fault (F9) at Rf = 0. These findings underscore the significance of PV control strategies in achieving optimal OCR operation times and enhancing the protection and reliability of power systems. In addition, OCRs at Rf = 0 consistently exhibits shorter operation times compared to Rf = 5 across all PV control modes.
Fault location |
Relays pairs |
Control A | Control B | Control C | Control D | Control E | |||||
|---|---|---|---|---|---|---|---|---|---|---|---|
| Operational time for OCR (s) | |||||||||||
| Rf = 0 | Rf = 5 | Rf = 0 | Rf = 5 | Rf = 0 | Rf = 5 | Rf = 0 | Rf = 5 | Rf = 0 | Rf = 5 | ||
| F1 | OCR1 | 0.05 | 0.06 | 0.05 | 0.05 | No tripping | No tripping | 0.08 | 0.08 | 0.06 | 0.06 |
| OCR2 | 0.35 | 0.40 | 0.37 | 0.37 | No tripping | No tripping | 0.57 | 0.58 | 0.41 | 0.41 | |
| F2 | OCR2 | 0.35 | 0.38 | 0.36 | 0.34 | No tripping | No tripping | 0.57 | 0.57 | 0.42 | 0.39 |
| OCR3 | 0.63 | 0.69 | 0.66 | 0.62 | No tripping | No tripping | 1.03 | 1.03 | 0.77 | 0.70 | |
| F3 | OCR3 | 0.63 | 0.75 | 0.64 | 0.69 | No tripping | No tripping | 1.03 | 1.07 | 0.80 | 0.77 |
| OCR4 | 0.91 | 1.09 | 0.93 | 1.00 | No tripping | No tripping | 1.50 | 1.55 | 1.16 | 1.11 | |
| F4 | OCR4 | 1.14 | 1.32 | 1.16 | 1.00 | 1.63 | 1.36 | 2.21 | 2.14 | 1.63 | 1.58 |
| OCR5 | 2.18 | 1.70 | 2.34 | 2.85 | No tripping | 4.2 | 8.13 | 4.20 | 2.72 | 6.31 | |
| F5 | OCR5 | 2.09 | 3.19 | 2.09 | 2.00 | No tripping | No tripping | 7.89 | 8.05 | 2.38 | 3.19 |
| OCR6 | 2.64 | 4.02 | 2.64 | 2.53 | No tripping | No tripping | 9.95 | 10.15 | 3.56 | 4.02 | |
| F6 | OCR6 | 2.75 | 2.96 | 2.75 | 1.12 | No tripping | No tripping | 9.86 | 9.86 | 2.75 | 2.75 |
| F7 | OCR7 | 0.05 | 0.05 | 0.05 | 0.05 | No tripping | No tripping | 0.08 | 0.08 | 0.06 | 0.06 |
| OCR8 | 0.34 | 0.36 | 0.35 | 0.33 | No tripping | No tripping | 0.55 | 0.52 | 0.44 | 0.39 | |
| F8 | OCR8 | 0.34 | 0.39 | 0.35 | 0.32 | No tripping | No tripping | 0.55 | 0.55 | 0.44 | 0.45 |
| OCR9 | 0.64 | 1.23 | 0.65 | 0.68 | No tripping | No tripping | 1.45 | 1.03 | 0.93 | 0.96 | |
| F9 | OCR9 | 0.82 | 0.67 | 0.87 | 0.94 | No tripping | 1.14 | 1.45 | 1.29 | 0.92 | 1.14 |
| OCR5 | 1.27 | 1.04 | 1.35 | 1.29 | No tripping | 1.78 | 2.25 | 2.01 | 1.44 | 1.78 | |
| OCR14 | 0.18 | 0.35 | 0.20 | 0.18 | 0.21 | 0.2 | No tripping | No tripping | No tripping | 4.46 | |
| F10 | OCR10 | 0.05 | 0.06 | 0.05 | 0.05 | No tripping | No tripping | 0.08 | 0.08 | 0.06 | 0.06 |
| OCR4 | 0.91 | 1.09 | 0.93 | 1.00 | No tripping | No tripping | 1.50 | 1.50 | 1.16 | 1.11 | |
| F11 | OCR11 | 0.06 | 0.10 | 0.06 | 0.07 | No tripping | 0.1 | 0.13 | 0.10 | 0.09 | 0.09 |
| OCR12 | 0.58 | 1.43 | 0.60 | 0.72 | No tripping | 1.28 | 1.75 | 1.45 | 0.71 | 1.19 | |
| F12 | OCR12 | 0.71 | 0.86 | 0.74 | 0.33 | 0.81 | 1.1 | 2.14 | 1.40 | 0.80 | 0.83 |
| OCR13 | 0.18 | 0.9 | 0.67 | 0.9 | No tripping | No tripping | No tripping | No tripping | 0.53 | 0.55 | |
4.3. Discussion
4.3.1. Miscoordination Events
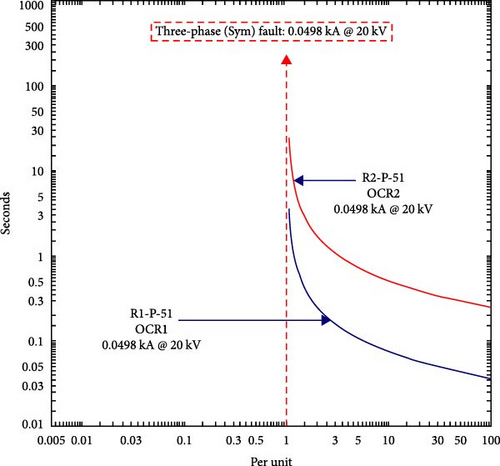
The results obtained from the analysis showed instances of OCR miscoordination and no tripping events, highlighting the significance of proper coordination among OCRs in power systems with PVs. Particularly, Control C, D, and E demonstrated a challenge in fault detecting at Rf = 0 and 5 Ω for both grid operation Scenarios A and B, where the no tripping events have occurred many times. This is mainly attributed to the low fault current values observed when employing these controllers, which limit the contribution of PV currents and lead to difficulties in accurately detecting and isolating faults, resulting in no trip events. For example, Figure 20 illustrates the misoperation of OCRs event for OCR1 and OCR2 in Scenario B when a fault occurs at location F1, under Control C and Rf = 0. In this scenario, the primary relay OCR1 and backup relay OCR2 failed to operate as the fault current (49.8 A) was lower than the OCR scheme setting. These events heighten the danger of equipment damage and system instability.
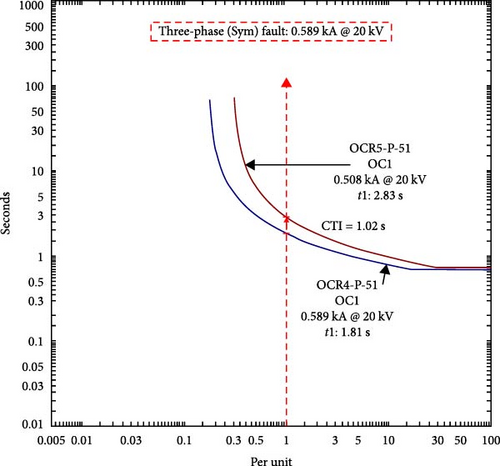
Additionally, Control C, D, and E posed challenges in maintaining the CTI at Scenario A within an acceptable range of 0.2–0.5 s, leading to miscoordination events. In Scenario B, all PV inverter controllers caused the same miscoordination events with a CTI of more than 0.5. For instance, in Scenario A with a fault occurring at location F4 under Control D and Rf = 5 Ω, the misoperation of OCRs, specifically OCR4 and OCR5, is evident as depicted in Figure 21. In this situation, the backup relay OCR5 failed to activate within the standard CTI and was delayed by 1.02 s. The CTI is a critical parameter that determines the time delay between the operation of primary and backup OCRs. In this case, the CTI exceeded the recommended range, indicating a deviation from the desired coordination scheme. These miscoordination events can result in delayed fault clearing, false tripping, and overall compromise of the system’s reliability and security. It is essential to address these challenges and optimize the control strategies to ensure effective coordination and timely fault response of OCRs in power systems with PVs.
In general, as renewable energy integration into the grid continues to expand, managing both active and reactive power during fault conditions has become increasingly important. Various control methods, as outlined in Table 1, have been developed to improve grid flexibility. This study examined the most widely used control methods, Control A, B, C, D, and E, including those implemented in the Germany grid code and IEEE 1547:2018, as well as other commonly employed techniques. The results showed that the inverter control schemes have a substantial impact on the performance of OCR schemes in both grid connected and islanding operation modes. The contribution of fault current from inverter-based systems is heavily influenced by the control strategy employed. In grid-connected mode, the fault current is a combination of contributions from both the utility grid and inverter-based resources. Different control schemes influence the magnitude of this contribution. OCR schemes, which rely on fault current detection, may struggle to adapt to this variability. This results in unreliable operation, leading to unnecessary or missed disconnections, thereby affecting system reliability. In islanding mode, where only PV systems are powering the network, the role of the inverter control becomes even more critical. Since the grid is disconnected, the entire fault current contribution relies on the inverters. If the control scheme of the inverter limits or eliminates the fault current, the OCR may completely fail to detect the fault due to insufficient current to trigger a response. This creates a higher risk in islanding scenarios, where protection systems are already more vulnerable due to the absence of grid support. In such cases, the OCR may not trip at all, leaving the system in an unsafe state. Inverter control schemes play a crucial role in determining fault current contributions, with control strategies that reduce or eliminate fault currents significantly impacting OCR performance. The variability introduced by different inverter control schemes presents challenges for traditional OCR systems, especially in islanding mode, where fault detection relies entirely on inverter-generated current. Adaptive OCR schemes are needed to address these challenges and ensure effective protection across varying control modes.
4.3.2. Modern OCR Schemes
Several optimization techniques have been explored in the literature to address the challenge of coordinating overcurrent protection schemes, as discussed in Sections 1 and 3. The WCA and PSO have demonstrated effectiveness in solving complex power network and protection problems. The choice of these two optimization algorithms is based on their reputation as powerful and effective methods for tackling complex power protection problems. PSO is a popular and well-established method due to its simplicity and effectiveness. However, PSO has its limitations, particularly its tendency to become trapped in local minima, which can limit its ability to find global optimal solutions in complex optimization problems. Despite these limitations, PSO remains widely used because of its robustness and efficiency in many engineering applications, including OCR coordination. It provides a good balance between computational complexity and solution quality, making it a reliable benchmark for comparison. On the other hand, the WCA is a relatively newer approach that mimics the natural water cycle process. WCA has gained attention due to its ability to explore and exploit the search space more effectively than standard PSO. The main advantage of WCA is its dynamic adaptation mechanism, which allows it to avoid local minima by directing its search toward the global optimum. This makes WCA particularly suitable for complex optimization problems with large search spaces, such as OCR coordination with renewable energy integration. In this study, WCA was chosen alongside PSO to compare their performance in handling various inverter control schemes and grid operation scenarios. While PSO serves as a reliable reference point, WCA was selected for its enhanced global search capability and adaptability, addressing some of PSO’s well-known limitations. By comparing both PSO and WCA, the study aims to provide insights into their effectiveness in achieving optimal OCR coordination under different fault conditions and inverter control modes, helping to identify the most suitable approach for modern power grids with distributed generation.
By employing these algorithms, the potential impact of PV inverter Control A on fault contribution and relay settings is evaluated. Control A showed higher performance in terms of minimum miscoordination events. Specifically, the focus is on minimizing the total tripping time, a critical metric for assessing the performance of coordination schemes. The results presented in Table 9 display the total operating time for OCRs under Scenario A with Control A and Rf = 0, considering both nonstandard and standard tripping characteristics. The optimization algorithms, PSO and WCA, are employed to determine the TMS values for each OCR. When examining the TMS values, it is observed that for OCRs 1, 7, 10, and 11, consistent TMS values of 0.025 are achieved across both the nonstandard and standard tripping schemes by both PSO and WCA. This indicates the effective coordination and minimal time margin required for these relays. For other OCRs, the TMS values vary between the nonstandard and standard tripping schemes. The optimization algorithms successfully determine TMS values that provide efficient coordination and minimize the operating time for these relays under both schemes. Analyzing the total operating time, the total operating time for the nonstandard tripping scheme was 12.077–12.3003 s for PSO and WCA, respectively, while for the standard tripping scheme, it was 12.1226 and 12.1564 s. By selecting the most appropriate coordination approach, network operators can enhance the overall performance and reliability of the power system, ensuring effective fault detection and response.
| Relay | TMS of OCRs at Scenario A under Control A and Rf = 0 | |||
|---|---|---|---|---|
| Nonstandard | Standard | |||
| PSO | WCA | PSO | WCA | |
| OCR1 | 0.025 | 0.025 | 0.025 | 0.025 |
| OCR2 | 0.2837 | 0.228252 | 0.1771 | 0.177594 |
| OCR3 | 0.4999 | 0.444859 | 0.321561 | 0.322452 |
| OCR4 | 0.7221 | 0.667741 | 0.467565 | 0.468651 |
| OCR5 | 0.686 | 0.643163 | 0.498621 | 0.499809 |
| OCR6 | 0.8523 | 0.809807 | 0.629037 | 0.630587 |
| OCR7 | 0.025 | 0.025115 | 0.025 | 0.025 |
| OCR8 | 0.2499 | 0.250679 | 0.171311 | 0.171699 |
| OCR9 | 0.488 | 0.489533 | 0.32016 | 0.320953 |
| OCR10 | 0.0251 | 0.025 | 0.025045 | 0.025 |
| OCR11 | 0.0251 | 0.025 | 0.025 | 0.025821 |
| OCR12 | 0.2369 | 0.240647 | 0.168004 | 0.169203 |
| Total operating time | 12.077 | 12.3003 | 12.1226 | 12.1564 |
4.4. HIL Testing Results
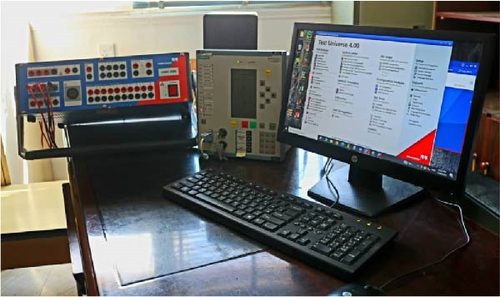
HIL testing is a powerful method for evaluating hardware components in simulated conditions, especially in power systems and control engineering. This research uses HIL testing to tackle the issue of fault currents in microgrids with different PV control modes. It proposes a unique protection scheme with nonstandard characteristics for industrial relays, offering adaptability for different manufacturers. IL testing involves integrating physical hardware components like SIPROTEC 7SJ62 multifunction protection relay and OMICRON-CMC-365 with simulation software, as shown in Figure 22. The key steps are as follows:
- •
Simulation software: Models power system components using ETAP and ATP/EMTP simulations and performs load flow and short-circuit calculations.
- •
Hardware components: Connects SIPROTEC 7SJ62 and OMICRON-CMC-365 to the HIL setup, with ATP simulations sending test data to these devices for real-world validation.
- •
Real-time simulation platform: Uses OMICRON Test Universe software for control and synchronization, and Digsi Software for OCR programing and validation.
This setup allows to assess the effectiveness of the protection scheme, providing a robust platform to ensure safety and reliability in microgrid environments. In the HIL testing, fault currents for different fault scenarios at Scenario B (islanding grid operation mode), including fault location (F1) and fault resistances (5 Ω), under PV control modes A, B, C, D, and E are detailed in Table 10.
| Fault location | Relays pairs | Fault current (A) | ||||
|---|---|---|---|---|---|---|
| Control A | Control B | Control C | Control D | Control E | ||
| F1 | OCR2 | 1012 | 1317 | 50 | 402 | 943 |
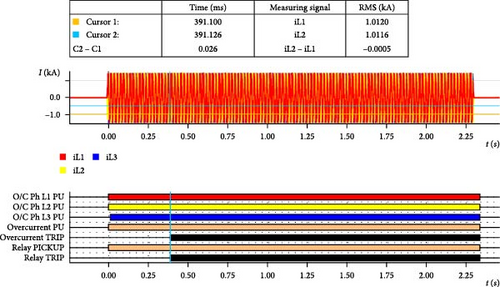
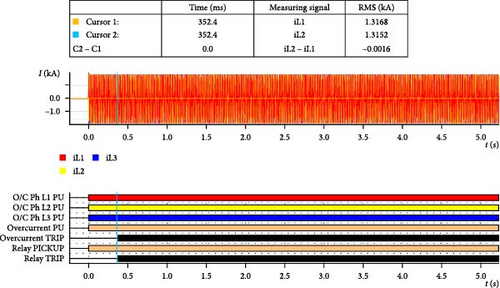
In this study, we utilized HIL testing to evaluate the performance of a protection scheme in a microgrid environment. Table 10 details fault currents observed in Scenario B, which represents an islanded grid operation mode. The data include fault location (F1) with a fault resistance of 5 Ω, under different PV control modes: A, B, C, D, and E for OCR2. The results from HIL testing discovered how these varying PV control modes influenced fault currents in the microgrid, providing insights into the effectiveness of the industrial OCR. Figure 23 shows the HIL results for PV control modes A, B, D, and E are matched to the simulation results and time tripping, as presented in Table 8. In the contrast, the OCRs in Control C with significantly low fault, resulting in fault detection difficulties and nontripping and miscoordination events, as shown in Figure 24 and Table 8. These findings further lay much emphasis on the importance of adopting proper PV control strategies that will ensure the optimal operation of OCR and its corresponding times for efficient power system protection.
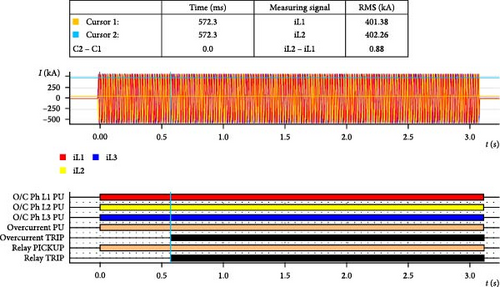
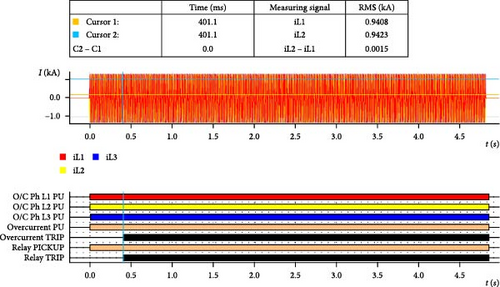

Overall, when comparing simulated results with real-time testing outcomes for different PV control strategies. First, simulations using software, ETAP, can model various scenarios and control strategies with high accuracy based on predefined parameters and assumptions. These models allow for extensive testing under controlled conditions, which can provide valuable insights into the theoretical performance of different PV control strategies. Second, real-time testing involves practical equipment and actual fault scenarios, with the Siemens 7SJ631 device and fault injections through OMICRON. This real-time testing provides the opportunity to detect how PV control strategies interact with other system components and external factors that may not be perfectly replicated in simulations. This includes variability in solar irradiance, temperature effects on PV modules, and the impact of network disturbances, which can all influence the performance of the control strategies and the protection devices. The results showed that the OCR with several different types of control, using ETAP software, which is considered one of the most powerful industrial programs. The protection device was also tested practically by using the Siemens 7SJ631 device and fault injection through the OMICRON testing device, and the results were identical. In summary, while simulations provide a valuable theoretical framework for evaluating PV control strategies, real-time testing is crucial for identifying practical challenges and ensuring that the strategies work effectively in real-world scenarios.
5. Conclusions and Recommendations
- •
Detection and isolation challenges: OCR may struggle to detect or isolate faults in certain cases, leading to either incorrect disconnections or delays in response times.
- •
Voltage term in OCR protection: Adding voltage to the OCR scheme may be necessary to effectively detect and isolate faults.
- •
Comprehensive testing: Extensive testing is required for all types of control methods with other protection devices, such as distance protection and differential protection, to understand how they detect and isolate faults under various inverter control strategies.
Nomenclature
-
- OCR:
-
- Overcurrent relay
-
- PV:
-
- Photovoltaic
-
- WCA:
-
- Water cycle optimization algorithm
-
- PSO:
-
- Particle swarm optimization algorithm
-
- SGs:
-
- Synchronous generators
-
- PV:
-
- Photovoltaic
-
- IIDG:
-
- Interconnected inverter-based distributed generation
-
- FRT:
-
- Fault ride-through
-
- SCC:
-
- Short-circuit current computation
-
- DGO:
-
- Distribution grid operator
-
- LVRT:
-
- Low voltage ride-through
-
- RCI:
-
- Reactive current injection
-
- VSI:
-
- Voltage source inverters
-
- P:
-
- Active power
-
- Q:
-
- Reactive power
-
- Vd:
-
- d-axis voltage
-
- IIIDG:
-
- Inverter current
-
- Id and Iq:
-
- Active and reactive current
-
- :
-
- Positive-sequence voltage
-
- ΔV+:
-
- Fault component’s voltage
-
- :
-
- Fault component’s current
-
- ZL and ZS:
-
- Line and source impedance
-
- :
-
- Fault current at F1
-
- :
-
- Fault current components at OCR1
-
- Rf:
-
- Fault resistance
-
- CTI:
-
- Coordination time Interval
-
- tprimary and tbackup :
-
- Operational time for both the primary and backup OCRs
-
- TMS:
-
- Time multiplier setting
-
- tminand tmax:
-
- Minimum and maximum operational times
-
- Ip:
-
- Pickup current
-
- tr:
-
- Tripping time
-
- DN:
-
- Distribution network.
Ethics Statement
The authors have nothing to report.
Disclosure
All persons who meet authorship criteria are listed as authors, and all authors certify that they have participated sufficiently in the work to take public responsibility for the content, including participation in the concept, design, analysis, writing, or revision of the manuscript. We also confirm that all authors have participated in drafting the article or revising it critically for important intellectual content and approval of the final version.
Conflicts of Interest
The authors declare no conflicts of interest.
Author Contributions
Conceptualization and project administration: Feras Alasali, Abdelaziz Salah Saidi, and Naser El-Naily. Methodology: Naser El-Naily, Feras Alasali, Emad El Deen Omran, William Holderbaum, and Abdelsalam Elhaffar. Software and formal analysis: Hassen Loukil, Emad El Deen Omran, Feras Alasali, Naser El-Naily, and Abdelaziz Salah Saidi. Validation: all authors. Investigation: Feras Alasali, William Holderbaum, Abdelsalam Elhaffar, and Naser El-Naily. Resources, data curation, writing—review and editing, visualization, and supervision: all authors. Writing—original draft preparation: Feras Alasali, Emad El Deen Omran, and Naser El-Naily. All authors have read and agreed to the published version of the manuscript.
Funding
The authors extend their appreciation to the Deanship of Research and Graduate Studies at King Khalid University for funding this work through Large Research Project under grant number RGP2/238/45.
Acknowledgments
We would like to thank Manchester Metropolitan University and The Hashemite University (Renewable Energy Center) for their support in publishing this article.
Open Research
Data Availability Statement
Derived data supporting the findings of this study are available from the corresponding author upon request.


