Ideal Parameter Estimation of Photocatalysis Process to Boost Amoxicillin Degradation Efficiency Using Marine Predators Optimization Algorithm
Abstract
This paper presents a methodology for determining the optimal parameters of a photocatalysis process for treating pharmaceutical wastewater. Three parameters are considered: pH value, catalyst dosages, and reaction time to boost the amoxicillin degradation efficiency (ADE). The proposed methodology contains two stages: fuzzy modelling and a parameter determination process using the marine predators algorithm (MPA). Firstly, based on the experimental dataset of ADE in terms of pH value, catalyst dosages, and reaction time, a robust fuzzy model is produced to model the photocatalysis/ozonation process. The target is reducing the root mean square error (RMSE) between the actual data and the experimental dataset. Using fuzzy, the RMSE decreased from 2.0248 using ANOVA to 0.3148 using fuzzy (decreased by 84%). Next, using the MPA, the optimal parameters of pH value, catalyst dosages, and reaction time corresponding to maximum ADE are determined. The suggested strategy boosted the ADE from 88.23% to a rate of 11.68% compared with the experimental and RSM approaches. Under this condition, the optimal solutions are 11, 384 mg/L, and 33.615 min, respectively, for pH, catalyst dosages, and reaction time.
1. Introduction
Securing fresh water and clean energy are the top priorities of all nations [1–3]. While securing freshwater resources from water desalination seems the best choice worldwide, it needs a lot of energy. Wastewater treatment is considered a valid option for decreasing water stress when applying a proper treatment method, such as those relying on solar energy [4, 5] or innovative methods such as microbial fuel cells [6–8]. Antibiotics are widely utilized in human, veterinary, and aquaculture medicine to treat microbial infection or control disease [9–12]. β-Lactam antibiotics, that is, amoxicillin, account for 65% of all antibiotic types used globally [13]. Antibiotics reach the aquatic environment from various sources, including laboratory activities, hospital effluents, and the pharmaceutical industry [14]. Moreover, human and livestock waste, where 30%–90% of these chemicals are found [15, 16]. As a result, these chemicals are found in various environments like the ocean, soil, surface and groundwater sources, sediment, effluents from wastewater treatment plants, and, moreover, sometimes in drinking water [17, 18]. Concerns about environmental pollution from antibiotics such as amoxicillin have received increasing attention. These compounds should be eliminated from discharged effluents to avoid their possible negative effects on humans and animals [19, 20].
In wastewater and water sectors, adsorption, membrane filters, and AOPs (advanced oxidation processes) are usually used to remove pharmaceutical chemicals [21–23]. AOP techniques, including photo-Fenton processes, ozonation, and UV irradiation, are typically regarded as the most successful way for the elimination of nonbiodegradable organic matters, hazardous, and refractory due to their high efficiency, low cost, easy operation, and mineralization ability [24, 25]. During ozonation, ozone assaults organic molecules and oxidizes them directly or indirectly at low or high pH, respectively, through a chain reaction mechanism to form the •HO (hydroxyl radical). The catalyst in AOPs boosts the formation of •OH, pollutant removal, and the rate of reaction rate, as well as decreasing the hazardous intermediates in the effluent [26]. MgO (magnesium oxide), TiO2 (titanium oxide), and ZnO (zinc oxide) have been employed as catalysts in AOPs [27–30]. Among them, MgO is considered a heterogeneous catalyst that has been shown to be effective in the treatment of water and wastewater and effluents as it is nontoxic, cheap, ecofriendly, contains a high concentration of active sites, and has the ability to remove a wide range of organic pollutants [20, 31, 32]. The amalgamation of photocatalysis with ozonation is an auspicious strategy for reducing pollution [33]. When excited electrons come into contact with ozone molecules or oxygen molecules, respectively, ozonide radicals and •O2− radicals are produced via photocatalytic ozonation [34]. After a series of reactions, these free radicals break down organic contaminants, generating •HO radicals. A hierarchy grey relational analysis (GRA) was developed by applying GRA and AHP (analytic hierarchy process) for accelerating the associated environmental decision-making approach by taking into account the multiobjective and unpredictable aspects comprised in selecting an appropriate wastewater treatment solution [35].
A design of experiments (DoE) was used to optimize ozonation procedures to remove pharmaceutical products, including diazepam, bromazepam, and clonazepam, from municipal wastewater treatment plants in Rio de Janeiro City, Brazil [36]. RSM (response surface methodology) was employed to optimize the photocatalytic ozonation to remove furosemide from wastewater using ZnO supported on ion-exchanged clinoptilolite as a nanophotocatalyst [37]. The influence of various operational parameters, including reaction time, pollutant concentration, catalyst loading, and initial ozone concentration, on the degradation of furosemide was investigated, as was the interaction between them. The degradation of antibiotic amoxicillin from wastewater was also examined using a photocatalysis-ozonation technique based on MgO catalyst; moreover, the process was optimized by applying RSM based on BBD (Box–Behnken design) [20].
This study determines the optimal parameters of a photocatalysis/ozonation process to treat wastewater. Three parameters are considered: pH value, catalyst dosages, and reaction time to boost the amoxicillin degradation efficiency (ADE). The proposed methodology involves fuzzy modelling and parameter estimation process working marine predators algorithm (MPA). MPA is an optimization algorithm inspired by nature, specifically the optimal foraging strategy and encounter rate policy observed in predator–prey dynamics within marine ecosystems. It incorporates a Lévy approach for environments with scarce prey concentrations while employing Brownian movement in areas abundant with prey [37]. To prove the superiority of MPA, the results are compared with SMA (slime mould algorithm), PSO (particle swarm optimization), HHO (Harris hawks optimization), GWO (grey wolf optimization) algorithm, and EESHHO (hybrid elite evolutionary strategy [EES] HHO).
- 1.
Developing an accurate fuzzy model of the photocatalysis/ozonation process to treat wastewater
- 2.
Defining the optimal values of pH value, catalyst dosages, and reaction time
- 3.
Carrying out comprehensive comparisons to prove the proposed strategy
- 4.
Boosting the ADE
2. Dataset
3. Methodology
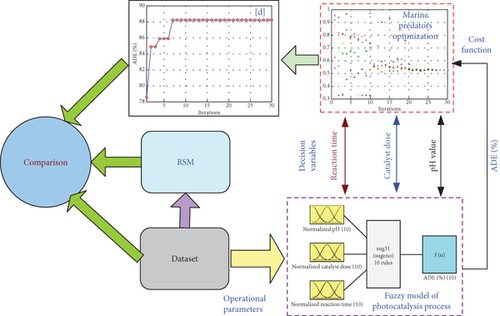
As explained in Figure 1, the proposed method includes two stages: the first stage is the fuzzy-based model of ADE, whereas the second one is the parameter identification of the photocatalysis/ozonation process.
3.1. First Stage: Fuzzy-Based Model of ADE
Membership functions (MFs) are employed in the fuzzification process to nonlinearly map the inputs. The inference engine stage encompasses the generation of fuzzy rules, evaluation of the rules’ outputs, and aggregation of the activated rules to generate the output [39]. Subsequently, the output is converted to a crisp form through the defuzzification phase. In fuzzy logic (FL), the relationship between input and output is expressed through IF-THEN rules. An illustrative instance of a fuzzy rule is provided below.
IF x is A1 and y is B1, then f1 = g1(x, y)where the A1 and B1 denote MFs of inputs.
The output of the f is estimated as follows:
(output layer)
Evaluating and (defuzzification layer)
and (N layer)
and (π layer)
where , , , and are the MF values of inputs.
3.2. Second Stage Parameter Identification Using MPA Optimizer
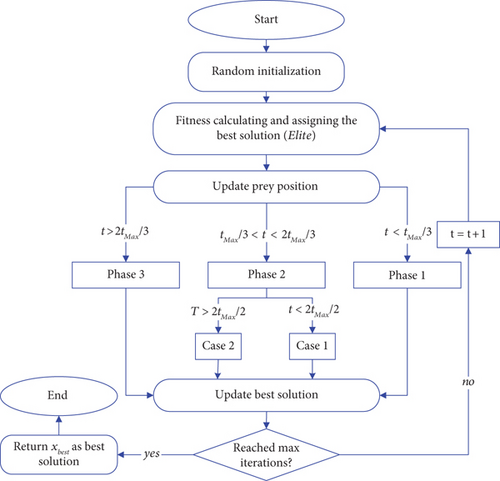
The MPA process is shown in Figure 2.
4. Results and Discussion
4.1. Fuzzy Model of ADE
The number of samples employed to construct the fuzzy model is 17 points. The points are divided into two factions. The first one has 11 points. It has been employed for training the model, while the rest points have been used to test the model. The fuzzy model is trained with a hybrid approach, applying least squares estimation (LSE) in the forward direction and backpropagation in the backward direction. The subtractive clustering is adopted to create the fuzzy rules in the case study 10 rules. Then, these models were trained until a minimum RMSE value was attained. The statistical evaluation of the fuzzy-based model is displayed in Table 1.
| RMSE | R-squared | |||||
|---|---|---|---|---|---|---|
| Train | Test | All | Train | Test | All | |
| Fuzzy | 0.1897 | 0.4634 | 0.3148 | 0.9815 | 0.9334 | 0.9605 |
| ANOVA | NA | NA | 2.0248 | |||
Regarding Table 1, the RMSE values for the ADE-based fuzzy model come in at 0.1897 and 0.4634, respectively, for the training and testing data. When it comes to training and testing, the R-squared values come in at 0.9815 and 0.9334, respectively. The RMSE was reduced by fuzzy in comparison to ANOVA by an 84% margin, going from 2.0248 when using ANOVA [20] to 0.3148 when using fuzzy. In conclusion, the fuzzy model’s low RMSE and high R-squared values indicate the successful completion of the modelling stage. The structure of the fuzzy model is depicted in Figure 3 and consists of three inputs and one output. Figure 4 illustrates the various forms that the Gaussian MFs can take; for pH, see Figure 4(a); for catalyst dose, see Figure 4(b); and for reaction time, see Figure 4(c).
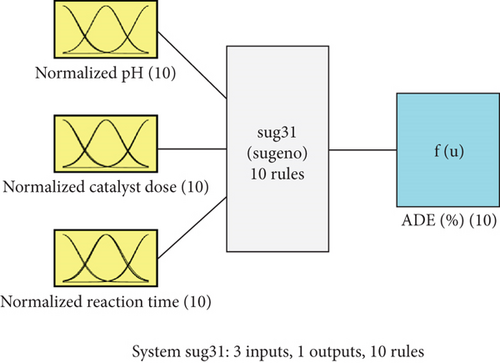


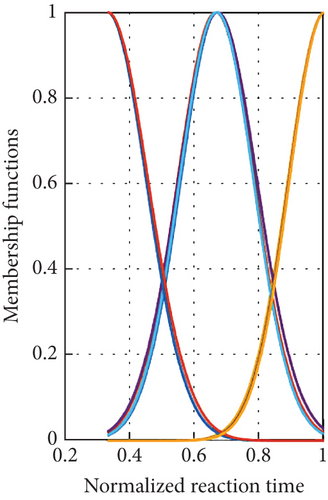
Figure 5 points out the spatial explanation from a 3D surface of the parameters. The maximum point of the output goes to dark red, but the minimum point goes to dark blue. As the figure shows, the ADE is low at low pH values and increases with increasing pH values, especially at pH values higher than 7. It is also clear that the optimum pH value (to obtain the highest ADE) is dependent on the catalyst dose. For instance, at a low catalyst dose, a high pH value of around 10 is necessary to get the best removal efficiency, while the required pH value at a higher catalyst dose is decreased until it has a pH value of 7 at the highest catalyst dose of 750 mg/L, as can be seen in Figure 5(a). The same behavior was recorded in the case of the effect of the pH at the different reaction times, where high pH values of around 10 are required to obtain the highest ADE at a low reaction time of 30 min and lower pH values are required to get the highest ADE at longer reaction times that reach a pH value of around 7 at the highest reaction time of 90 min, as can be seen in Figure 5(b). Figure 5(c) shows the effect of both the reaction time and catalyst dose on the ADE. As is clear from the figure, a high catalyst load of around 750 mg/L is required at a shorter reaction time of 30 min, and the required catalyst load for the highest ADE removal is decreased to around 500 mg/L at longer reaction times (Figure 5(c)).
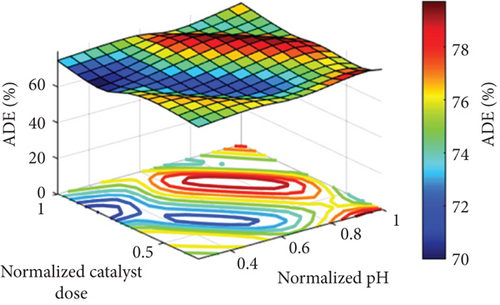
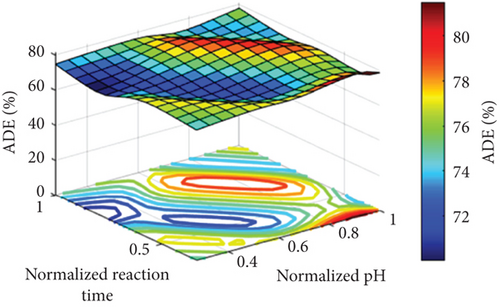
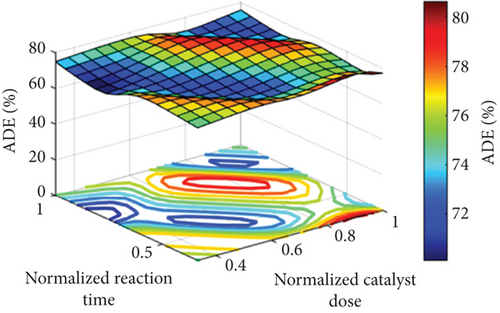
The pH effect on amoxicillin degradation was linked to the characteristics of the catalyst and the pollutant. The catalyst used is MgO with a zero-point charge at a pH value of 12.4 [20]; therefore, it will have a positive charge in the whole pH range used in the current study (pH 3–11), while the pollutant (amoxicillin) is a zwitterionic molecule with both acidic and basic and has three pKa values (3, 7, and 11). At low pH (around 3), both the pollutant and the catalyst have the same charge (positive); therefore, a repulsion happens, and thus, ADE is low. Generally, the increase in the pH value would result in increasing the hydroxyl radical and the reaction of the pollutant, that is, amoxicillin, with the generated holes (h+) [20]. The optimum value of the catalyst dosage around 500 mg/L would be related to the shortage in the photocatalytic active sites at a low catalyst dosage of 250 mg/L that increased with the increase in the catalyst dosage to 500 mg/L. However, the further increase in the catalyst dosage to 750 mg/L decreased the performance. The decrease in the ADE at a high catalyst dosage of 750 mg/L would be related to the excess number of catalyst nanoparticles that restricted the through of the light, and thus photodegradation decreased as verified in similar photocatalytic processes as reported in [15, 40, 41]. The improved ADE with time was related to the increase in the degradation of the amoxicillin with time; therefore, ADE is increased with time.
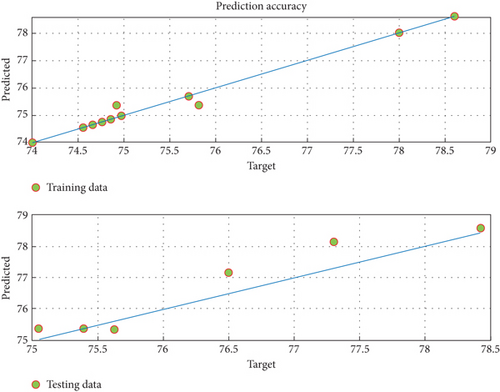
Reaching a precise model of the electrochemical oxidation process encourages the constructed fuzzy model to predict ADE. This is seen from mapping the predicted outputs of fuzzy with the measured dataset, as shown in Figure 6. The experimental and fuzzy data agree. Additionally, the graphs of the predictions around the line of 100% accuracy are shown in Figure 7 for the training and testing phases.

4.2. Parameter Identification
Using measured data, RSM methodology, and the MPA, Table 2 shows the ideal values for pH value, catalyst doses, and reaction time. The efficiency of amoxicillin degradation was improved when fuzzy and MPA were combined. In comparison to measured data and RSM methodology, the ADE has increased to 88.23% with a rate of 11.68%.
To avoid arbitrary results, each optimisation algorithm under consideration has been used 30 times to test its resilience. Table 3 compares the algorithms that were taken into consideration. Algorithms were used to maintain constant populations (five) and iterations (100) throughout the comparison to ensure fairness. Table 4 shows that MPA is superior to SMA, PSO, HHO, GWO, and EESHHO. MPA achieves the lowest standard deviation (STD) score of 1.9408, while PSO achieves the highest STD of 2.8827. The MPA method yields the best mean cost function, 87.2606, while the PSA method yields the worst cost, 82.8008. This illustrated how successful the suggested approach was. Figure 8 depicts the convergence of the particles during the optimization process. The ideal answers are 0.512 and 0.3735. While Figure 9 presents the details of the 30 runs.
| SMA | PSO | HHO | GWO | EESHHO | MPA | |
|---|---|---|---|---|---|---|
| Best (maximum) | 88.231 | 88.2312 | 88.2302 | 88.2314 | 88.2302 | 88.2315 |
| Worst (minimum) | 83.3812 | 79.5097 | 79.7196 | 79.6759 | 80.9085 | 82.6787 |
| Mean | 87.1228 | 82.8008 | 85.9653 | 86.8629 | 85.8279 | 87.2606 |
| Median | 88.227 | 81.1108 | 88.2023 | 88.2283 | 88.2086 | 88.2294 |
| Variance | 4.0053 | 8.3101 | 8.1799 | 6.5599 | 7.9032 | 3.7666 |
| STD | 2.0013 | 2.8827 | 2.8601 | 2.5612 | 2.8113 | 1.9408 |
| Run | SMA | PSO | HHO | GWO | EESHHO | MPA |
|---|---|---|---|---|---|---|
| 1 | 88.221 | 88.231 | 88.23 | 88.23 | 83.551 | 88.226 |
| 2 | 83.548 | 81.094 | 85.885 | 88.225 | 83.54 | 88.23 |
| 3 | 88.225 | 81.098 | 88.227 | 88.231 | 88.22 | 88.216 |
| 4 | 88.228 | 81.108 | 82.679 | 88.231 | 83.551 | 88.23 |
| 5 | 83.536 | 81.104 | 83.837 | 82.679 | 83.519 | 88.23 |
| 6 | 83.552 | 79.51 | 80.726 | 88.23 | 88.209 | 83.552 |
| 7 | 88.213 | 81.101 | 88.227 | 88.225 | 88.221 | 88.23 |
| 8 | 88.229 | 81.105 | 88.227 | 88.231 | 88.22 | 88.231 |
| 9 | 88.225 | 81.113 | 88.227 | 88.23 | 81.111 | 83.552 |
| 10 | 88.23 | 81.111 | 82.679 | 88.229 | 88.227 | 88.23 |
| 11 | 88.228 | 79.548 | 79.72 | 88.229 | 82.679 | 83.552 |
| 12 | 88.228 | 81.109 | 88.178 | 79.676 | 82.679 | 88.229 |
| 13 | 88.225 | 81.105 | 88.23 | 88.227 | 83.54 | 88.222 |
| 14 | 88.221 | 81.11 | 88.151 | 88.224 | 88.227 | 88.231 |
| 15 | 83.479 | 81.092 | 82.679 | 88.23 | 81.105 | 83.552 |
| 16 | 88.231 | 82.679 | 88.228 | 88.231 | 88.206 | 88.222 |
| 17 | 88.23 | 81.101 | 87.485 | 88.227 | 88.208 | 88.231 |
| 18 | 88.227 | 88.231 | 88.229 | 83.545 | 82.679 | 88.226 |
| 19 | 88.231 | 88.23 | 88.23 | 88.23 | 82.679 | 88.228 |
| 20 | 88.231 | 81.101 | 88.229 | 88.228 | 88.228 | 88.23 |
| 21 | 83.448 | 88.23 | 88.227 | 88.221 | 88.23 | 88.228 |
| 22 | 88.228 | 81.111 | 88.228 | 88.231 | 88.227 | 83.449 |
| 23 | 83.381 | 81.109 | 82.804 | 83.5 | 88.211 | 82.679 |
| 24 | 88.231 | 83.549 | 88.228 | 88.23 | 88.214 | 88.231 |
| 25 | 88.221 | 88.23 | 82.679 | 82.679 | 88.227 | 88.23 |
| 26 | 88.228 | 83.523 | 82.679 | 88.228 | 88.215 | 88.229 |
| 27 | 83.523 | 83.499 | 82.679 | 88.23 | 88.228 | 88.23 |
| 28 | 88.23 | 88.229 | 88.227 | 88.23 | 80.909 | 88.231 |
| 29 | 88.227 | 83.551 | 82.679 | 81.087 | 83.551 | 88.226 |
| 30 | 88.227 | 81.114 | 88.23 | 83.464 | 88.229 | 88.23 |
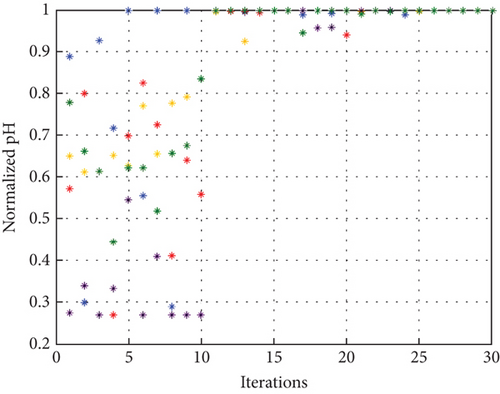
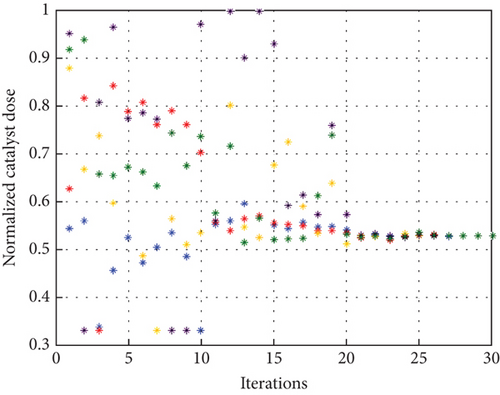
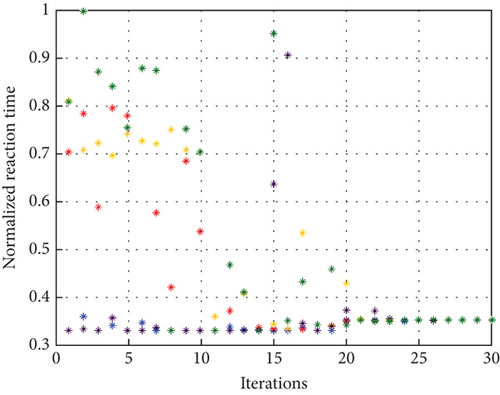
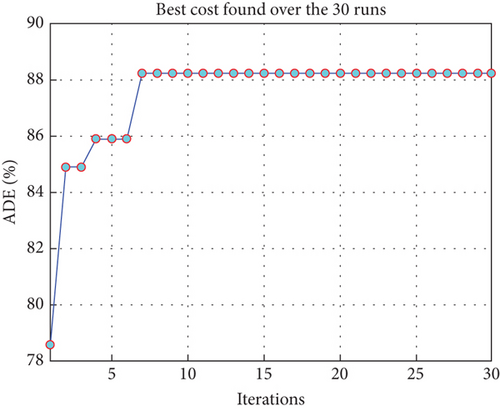
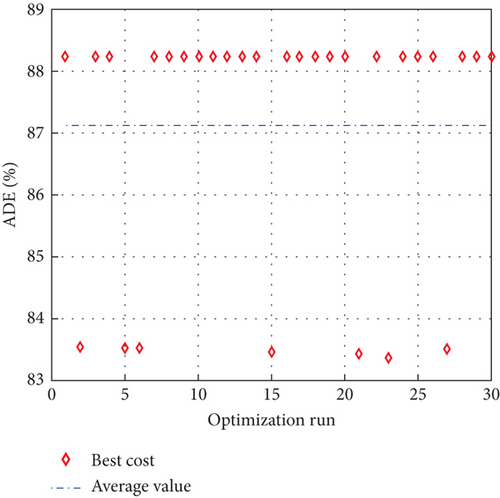
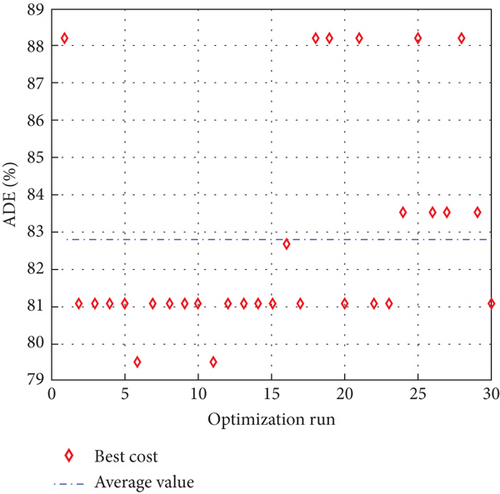
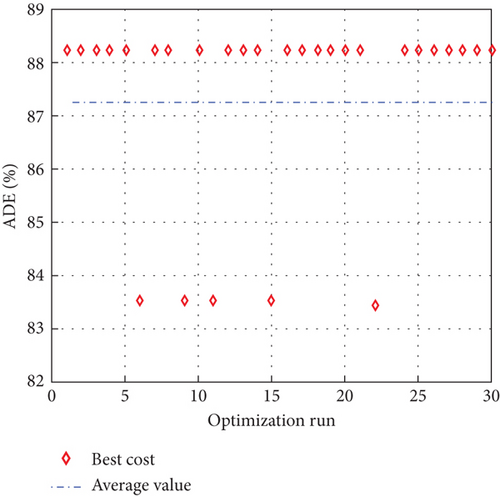
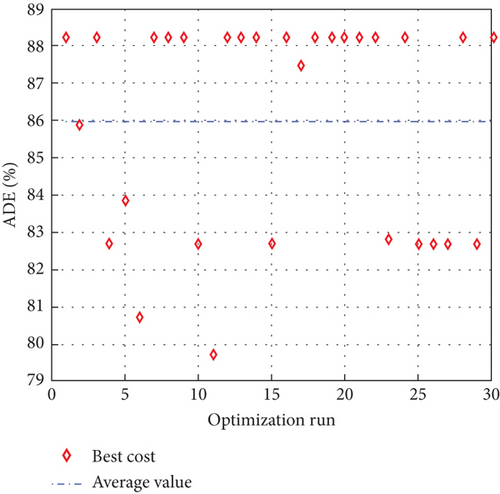
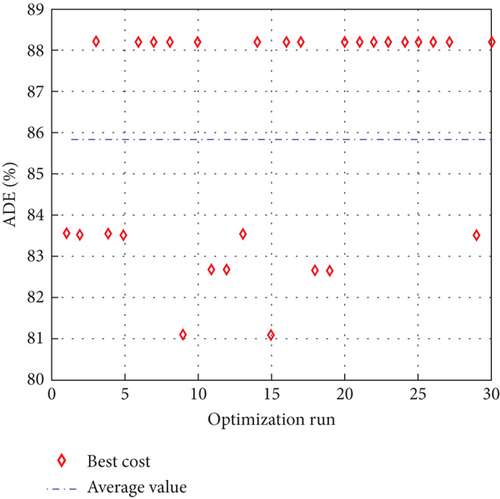
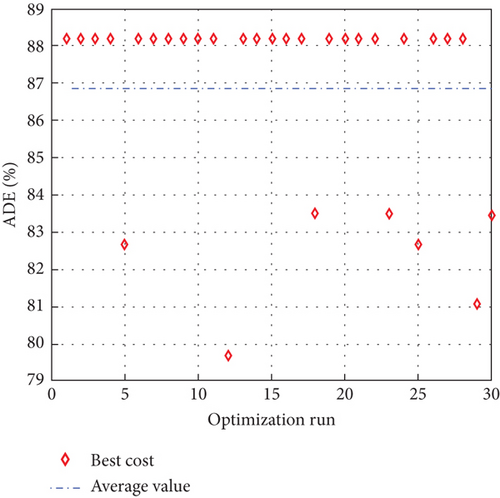
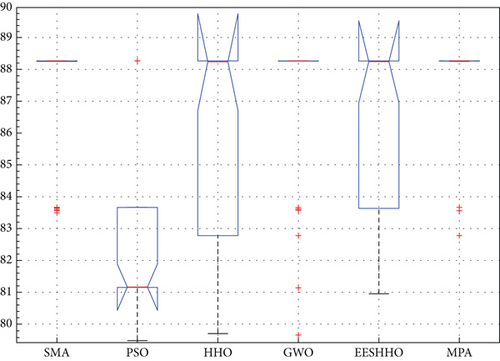
Table 5 displays the ANOVA test results, and Figure 10 displays the corresponding graphical ranking. The p value in the table is much lower than the F value, affirming the variation between both the results obtained. As shown in Figure 11, SMA, GWO, and MPA provided higher mean fitness with lower variance. Tukey’s test will be performed to investigate their performance deeply. On the other hand, the PSO provided the worst performance. Hence, it will be excluded from the Tukey test.
| Source | SS | df | MS | F | p value > F |
|---|---|---|---|---|---|
| Columns | 415.67 | 4 | 83.1363 | 12.45 | 2.4552e − 10 |
| Error | 1161.75 | 145 | 6.6767 | ||
| Total | 1577.42 | 149 |
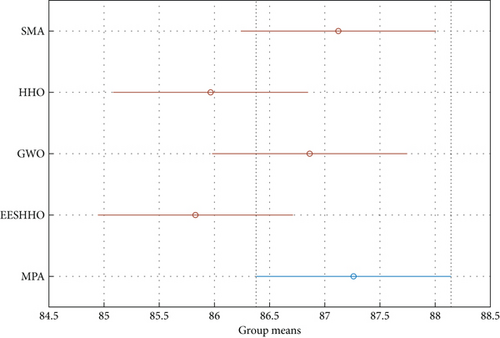
After excluding the PSO due to its poor performance, the Tukey HSD (honestly significant difference) test is used to further clarify the ANOVA test results. The results are shown in Figure 9. The MPA has a higher mean fitness, indicating that it can successfully solve this problem. The SMA performance is extremely competitive, and the GWO closely follows them.
5. Conclusion
The main target of this work is modelling and optimizing the performance of the photocatalysis/ozonation process for treating wastewater. The goal has been accomplished by applying artificial intelligence and MPAs. The proposed methodology integrates fuzzy-based modelling and parameter identification by MPA. Three parameters are considered: pH value, catalyst dosages, and reaction time to boost the ADE. Using the fuzzy modelling, the RMSE values are 0.1897 and 0.4634 for training and testing data. The R -squared values are 0.9815 and 0.9334, respectively, for training and testing. Using fuzzy, the RMSE diminished from 2.0248 (ANOVA) to 0.3148 (decreased by 84%). In sum, the fuzzy model’s low RMSE and the high R-squared values reveal a successful modelling stage. For the optimization phase, the combination of fuzzy and MPA increased ADE from 88.23% to the rate of 11.68% in comparison with the experimental dataset. The optimal solutions are 11, 384 mg/L, and 33.615 min, respectively, for pH, catalyst dosages, and reaction time. To prove the superiority of MPA, the results were compared with SMA, PSO, HHO, GWO, and EESHHO. MPA achieves the minimum STD value of 1.9408, whereas PSO obtains the maximum STD of 2.8827. MPA obtains the highest mean objective function of 87.2606, whereas PSO obtains the worst value of 82.8008. This confirmed the effectiveness of the proposed strategy.
Conflicts of Interest
The authors declare no conflicts of interest.
Funding
The authors thank the Deanship for Research & Innovation, Ministry of Education in Saudi Arabia for funding this research work through the project number IFP22UQU4361238DSR078.
Acknowledgments
The authors thank the Deanship for Research & Innovation, Ministry of Education in Saudi Arabia for funding this research work through the project number IFP22UQU4361238DSR078.
Open Research
Data Availability Statement
Data used to support this study are available from the corresponding author upon request.


