Volume 2024, Issue 1 6210242
Research Article
Open Access

Analysis and Identification of Methylation-Modifying Genes Associated with Hypoxia and Immunity in Keloids

Chun-Hu Wang

Chun-Hu Wang

Department of Plastic Surgery , Plastic Surgery Hospital , Chinese Academy of Medical Sciences and Peking Union Medical College , Beijing , 100144 , China , cacms.ac.cn

Search for more papers by this author
Zi-Rong Li

Zi-Rong Li

Department of Plastic Surgery , Peking Union Medical College Hospital , Beijing , 100730 , China , pumch.cn

Search for more papers by this author
Meng Wang

Meng Wang

Department of Plastic Surgery , Plastic Surgery Hospital , Chinese Academy of Medical Sciences and Peking Union Medical College , Beijing , 100144 , China , cacms.ac.cn

Search for more papers by this author
Jie Li

Jie Li

Department of Plastic Surgery , Plastic Surgery Hospital , Chinese Academy of Medical Sciences and Peking Union Medical College , Beijing , 100144 , China , cacms.ac.cn

Search for more papers by this author
Xin Li

Xin Li

Department of Plastic Surgery , Plastic Surgery Hospital , Chinese Academy of Medical Sciences and Peking Union Medical College , Beijing , 100144 , China , cacms.ac.cn

Search for more papers by this author
Xiao-Ning Yang

Xiao-Ning Yang

Department of Plastic Surgery , Plastic Surgery Hospital , Chinese Academy of Medical Sciences and Peking Union Medical College , Beijing , 100144 , China , cacms.ac.cn

Search for more papers by this author
You-Bin Wang

Corresponding Author

You-Bin Wang

Department of Plastic Surgery , Peking Union Medical College Hospital , Beijing , 100730 , China , pumch.cn

Search for more papers by this author
Ji-Guang Ma

Corresponding Author

Ji-Guang Ma

Department of Plastic Surgery , Plastic Surgery Hospital , Chinese Academy of Medical Sciences and Peking Union Medical College , Beijing , 100144 , China , cacms.ac.cn

Search for more papers by this author
First published: 23 October 2024
Academic Editor: Althea East-Innis

Abstract

Background. Keloids are benign fibroproliferative tumors that are unique to humans. However, the exact mechanism of keloid formation remains unclear. The inflammatory cytokines released by immune cells can activate fibroblasts, connective tissue cell proliferation, and angiogenesis. Hypoxia is common in the process of fibrosis in many diseases. This study aimed to investigate the relationship between immune response, hypoxia, and keloid formation. Methods. Gene methylation and expression data were downloaded from the GEO database. Thereafter, differentially methylated genes associated with immunity and hypoxia were identified. Machine learning was performed to identify potential diagnostic/immunity/hypoxia-related differentially methylated/expressed genes, followed by analysis of functional enrichment, transcription factors, protein-protein interactions, and expression validation by reverse transcription quantitative polymerase chain reaction and immunohistochemistry. Results. In total, 16 immunity/hypoxia-related hypermethylated low-expression genes and 18 immunity/hypoxia-related hypomethylated high-expression genes were identified in keloids. Based on machine learning, nine differentially methylated and expressed genes were selected as potential diagnostic markers for keloids, including two hypoxia-related genes (CDKN1A and PGAM2) and seven immunity-related genes (DCD, PTGDS, WFIKKN1, SEMA5A, IL1R1, ITGAL, and SOS1). Some significantly enriched signaling pathways were identified, including the FoxO, PI3K-Akt, focal adhesion, and ErbB signaling pathways. SOS1 is involved in disease regulation with 65 transcription factors and has a higher interaction score with other molecules. Conclusions. Two hypoxia-related genes (CDKN1A and PGAM2) and seven immunity-related genes (DCD, PTGDS, WFIKKN1, SEMA5A, IL1R1, ITGAL, and SOS1) could be considered potential diagnostic markers for keloids, and may be helpful in understanding the importance of oxygen balance and immune regulation in keloids.

1. Introduction

Keloid, a dermal fibroproliferative disorder caused by abnormal wound healing, is characterized by excessive collagen deposition [1, 2]. Keloids may develop months or years after the initial injury and may be accompanied by pruritus, intense pain, and other physical or psychosocial symptoms [3]. Commonly affected sites include the shoulders, anterior chest, earlobe, back, and pre-sternum. Park et al. found that systemic factors of keloids include adolescence and pregnancy (associated with a higher risk of bulky scar formation) [4]. Local risk factors for keloids include wound depth, delayed wound healing, and mechanical forces, such as skin tension induced by stretching [5]. In addition, single nucleotide polymorphisms, hypertension, and family history are associated with keloid formation [68]. Keloids tend to be aggressive, invading adjacent surrounding healthy skin, and often recur after treatment, which significantly affects patient quality of life [9]. Therefore, understanding the molecular pathogenesis of keloids is necessary.

DNA methylation is an important epigenetic modification method that can change the expression pattern of genes. It plays a role in a variety of diseases, including skin diseases [10, 11]. One study showed that abnormal gene methylation affects the apoptosis of keloid fibroblasts [12]. Secreted frizzled-related protein 1 (SFRP1) promoter methylation downregulates Wnt/beta-catenin activity in keloids [13]. Although studies have shown that gene methylation modification plays an important regulatory role in the molecular mechanism of keloids, the specific mechanisms are unclear. Therefore, continuous exploration of methylation-modifying genes that may play important roles in keloids will help to provide direction for future research and may also aid in patients management.

Hypoxia and autoimmunity may be closely related to keloids [1417]. Under hypoxic conditions, keratinocytes exhibit a partial fibroblast-like appearance and acquire enhanced aggressive capacity [18]. Excessive collagen production by fibroblasts worsens oxygen supply and accelerates keloid pathology [19, 20]. Bloch et al. first reported general immune reactivity in keloid patients [21]. Diaz et al. found that keloid lesions exhibited enhanced interleukin 4 (IL-4)/interleukin 13 (IL-13) signaling and a Th2-dominated immune response [22]. Therefore, deciphering the molecular mechanisms of keloids in both immunity and hypoxia is expected to aid in the effective and precise diagnosis of keloids. In this study, diagnostic/immunity/hypoxia-related differentially methylated and expressed genes were identified in keloids. Our study may provide a new approach for the accurate diagnosis and treatment of keloids at immunity and hypoxia levels.

2. Materials and Methods

2.1. Data Collection and Preprocessing

All data were downloaded from the Gene Expression Omnibus (GEO) database (http://www.ncbi.nlm.nih.gov/geo/) and processed using R version 3.5.3 (https://www.r-project.org/). The search keywords were “keloid” and “Homo sapiens”. After excluding animal-level and single-sample studies, six datasets were selected, including GSE56420, GSE113619, GSE173900, GSE190626, GSE92566, and GSE145725. The GSE56420, GSE113619, GSE173900, GSE190626, and GSE92566 datasets were used as the training set, and the GSE145725 dataset was used as the validation set. Differential methylation of genes was analyzed using the GSE56420 dataset. The gene probes were converted into gene symbols in the GSE113619, GSE173900, GSE190626, and GSE92566 datasets. The average values of the multiple probes corresponding to the same gene were calculated. Genes with an average expression of less than 1 in all samples were excluded. The combat function in the R package “SVA” was used to remove batch effects. The combined dataset included data from 15 healthy controls and 20 patients. The GSE145725 dataset was used to verify the accuracy of the diagnostic model. Detailed information on the datasets is shown in Table 1 and Table S1.

Table 1. Detailed information of included datasets.
GEO ID Platform Samples (normal control: case) Tissue Type
GSE56420 GPL13534 6 : 6 Tissue Methylation
GSE113619 GPL21290 5 : 8 Tissue mRNA
GSE173900 GPL21697 4 : 5 Tissue mRNA
GSE190626 GPL24676 3 : 3 Tissue mRNA
GSE92566 GPL570 3 : 4 Tissue mRNA
GSE145725 GPL16043 10 : 9 Fibroblast mRNA

2.2. Identification of Genes Associated with Immunity and Hypoxia

Immune-related gene data were retrieved from the immunology database and portal ImmPort database (https://immport.niaid.nih.gov). A comprehensive list was downloaded, which included 1793 immune genes. Hypoxia-related genes were obtained from the marker gene set of the MSigDB database (https://www.gsea-msigdb.org/gsea/msigdb/), which includes 200 hypoxia genes. There are 34 common genes between immune gene and hypoxia gene.

2.3. Identification of Immunity/Hypoxia-Related Differentially Methylated/Expressed Genes in Keloid

The CHAMP package was used to identify differentially methylated genes under the criterion of false discovery rate (FDR) < 0.05. After batch correction, the “limma” package was used to screen differentially expressed genes under a threshold value of p < 0.05. The intersection between differentially methylated genes and differentially expressed genes was used to obtain differentially methylated and expressed genes, namely hypermethylated low-expression genes and hypomethylated high-expression genes. Immunity/hypoxia-related differentially methylated and expressed genes were finally identified after analyzing the interaction of immunity/hypoxia-related genes and differentially methylated/expressed genes in keloids.

2.4. Construction of Diagnostic Model and Selection of Characteristic Genes in Keloid

Machine learning algorithm modeling was used to identify diagnostic gene biomarkers of keloids. First, the key genes were screened from immunity/hypoxia-related differentially methylated/expressed genes by least absolute shrinkage and selection operator (LASSO) regression analysis using the “GLmNET” package in R software. Lasso regression adds a penalty term λ on the basis of general linear regression. Adjust the number and coefficient size of model parameters while ensuring the best fitting error to screen out features with greater predictive ability for the target variable, and reduce the impact of multicollinearity to prevent overfitting of the model. Subsequently, classification models of random forest (RF) and support vector machine (SVM) were established. The diagnostic ability of the two models and the diagnostic ability of each immunity/hypoxia-related differentially methylated/expressed gene were assessed using receiver operating characteristic (ROC) curves. The ROC curve is a comprehensive index that reflects the false positive and true positive rates of continuous variables. The area under the curve (AUC) is an evaluation index of model performance. ROC analysis was performed using the R package “pROC” to calculate the AUC to assess model accuracy. The AUC ranges from 0 to 1, where 0.6–0.7 indicates sufficient diagnostic accuracy and 0.9–1 indicates excellent diagnostic accuracy [23]. The accuracy of the model was verified using the GSE145725 dataset.

2.5. Identification of Transcription Factors (TFs) Associated with Diagnostic Gene Biomarkers

Subsets of TFs were obtained from Cistrome (https://cistrome.org/). Corresponding TFs expression values were obtained from the corrected dataset. TFs related to diagnostic gene biomarkers were identified under the screening criteria of the |Pearson correlation coefficient| > 0.5 and p < 0.05 using correlation analysis.

2.6. Functional and Protein-Protein Interaction (PPI) Analysis of Immunity/Hypoxia-Related Differentially Methylated/Expressed Genes in Keloid

Gene Ontology (GO) and the Kyoto Encyclopedia of Genes and Genomes (KEGG) were used for the functional analysis of immunity/hypoxia-related differentially methylated and expressed genes using the David database (https://david.ncifcrf.gov/). Significantly enriched GO and KEGG terms were identified using selection criteria of p < 0.05. In addition, the STRING online database (https://cn.string-db.org/) was used to explore the protein interactions of immunity/hypoxia-related differentially methylated and expressed genes. Parameters in STRING are default parameters (network type: full STRING network, required score: medium confidence (0.400), size cutoff: no more than 10 interactions).

2.7. Validation of Immunity/Hypoxia-Related Differentially Methylated/Expressed Genes in Keloid by Reverse Transcription Quantitative Polymerase Chain Reaction (RT-qPCR)

RT-qPCR was used to validate the expression of immunity/hypoxia-related differentially methylated and expressed genes in keloid and normal tissue samples from keloid patients. The patients were diagnosed with no systemic disease and had taken neither medication nor other treatments (such as corticosteroids, 5-fluorouracil injections, or radiotherapy) before this study. Detailed inclusion criteria for keloid patients were as follows: (1) raised lumps on the skin surface, hard, smooth, and shiny, with irregular boundaries and no signs of retreat within 1 year. The course of the disease could not be resolved spontaneously after 9 months; (2) the lesion exceeded the edge of the original lesion and infiltrated into the surrounding normal tissues, showing a crab-like growth. Peripherally invasive growth beyond the original lesion; (3) persistent growth, redness, pain, itching, and other clinical symptoms, no self-healing tendency, cannot self-subside; (4) simple surgical resection easily relapses, and the scope of recurrence can exceed the original scar range; (5) the keloid tissue had a large amount of collagen deposition and matrix components, many fibroblasts, and a division phase. Based on the above criteria, five keloid patients were enrolled in the present study. The clinical characteristics of the patients are listed in Table 2. Keloid and normal tissue samples from these patients were collected for RT-qPCR. GAPDH was used as the internal control. The t-test was used for statistical analysis in the expression validation using RT-qPCR. Statistical significance was set at p < 0.05. This study was approved by the Ethics Committee of the Plastic Surgery Hospital, Chinese Academy of Medical Sciences (2023−1). Informed consent was provided by all participants and their families.

Table 2. Clinical information of keloid patients in the RT-qPCR.
Number Sex Age Growth mode Site of occurrence Treatment method Natural fading tendency Scar contracture Redness and itching
1 Female 41 Uplifted scar beyond the lesion area Anterior chest Operation No No Yes
2 Female 35 Uplifted scar beyond the lesion area Anterior chest Operation No No Yes
3 Male 47 Uplifted scar beyond the lesion area Neck Operation No No Yes
4 Female 28 Uplifted scar beyond the lesion area Earlobe Operation No No Yes
5 Male 57 Uplifted scar beyond the lesion area Abdomen Operation No No Yes

2.8. Validation of Immunity/Hypoxia-Related Differentially Methylated/Expressed Genes in Keloid by Immunohistochemical Staining

The paraffin sections were placed in an oven at 60°C for 2-3 h. The baked paraffin sections were completely immersed in xylene for dewaxing. The dewaxed paraffin sections were successively and completely immersed in different concentrations of ethanol for hydration treatment. After washing the paraffin sections with phosphate buffer saline (PBS) several times, antigen repair was performed using sodium citrate antigen repair solution. After PBS washing the repaired paraffin sections, the paraffin sections were completely immersed in 3% hydrogen peroxide to seal the endogenous catalase. After washing with PBS, goat serum was added and closed at 37°C for 30 min to 2 h. Subsequently, primary antibody (CDKN1A antibody, PTGDS antibody, WFIKKN1 antibody) was added dropwise and incubated at 4°C overnight. The next day, it was rewarmed at room temperature and washed with PBS, secondary antibody (SignalStain® Boost IHC Detection Reagent (HRP Rabbit)) was added, and then incubated at 37°C for 40 min. After washing with PBS, diaminobenzidine (DAB) was added dropwise to develop the color. Tap water was used to terminate the staining and then hematoxylin was added dropwise to restain the color. Then, reverse blue staining solution was used to reverse blue and anhydrous ethanol was used for dehydration. Finally, the slices were sealed and observed under a microscope.

2.9. Statistical Analysis

The sample size was calculated. The parameters are as follows: (1) d = 2 (effect size); (2) sig.level = 0.05 (significance level); (3) power = 0.8 (power level); (4) alternative = two.sided (statistical test). The results showed that the number of samples required for each group was about 5. The T test was used to analyze the significant difference between the two groups in the box plots. P < 0.05 was considered statistically significant.

3. Results

3.1. Data Processing

Principal component analysis (PCA) and correlation clustering heat maps were performed on the entire methylation dataset (GSE56420 dataset) (Supplementary Figure 1). Finally, differential methylation analysis was performed on five normal and six keloid samples after removal of abnormal data GSM1361173. Four gene expression matrices were combined to remove batch effects using the ComBath function in the “SVA” package (Supplementary Figure 2A). Finally, 15 normal and 20 keloid samples were identified. A total of 8769 common genes were obtained by intersecting the genes in four datasets (Supplementary Figure 2B). Subsequently, gene differential expression analysis was performed based on 8769 common genes.

3.2. Screening of Immunity/Hypoxia-Related Differentially Methylated/Expressed Genes in Keloid

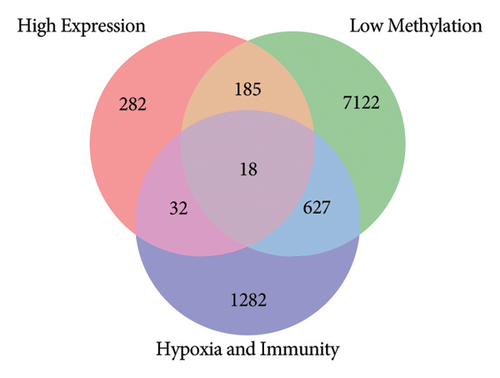
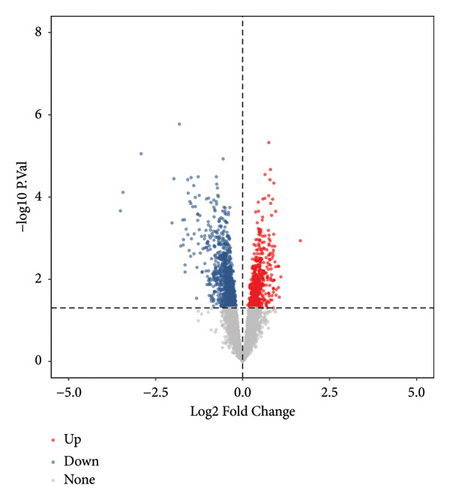
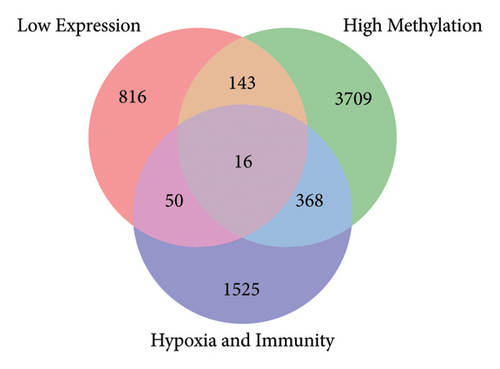
Using the screening criteria of FDR < 0.05, 41343 differentially methylated sites were identified in keloids of the GSE56420 dataset. A total of 10124 differentially methylated genes were identified, including 4235 hypermethylated genes and 7951 hypomethylated genes. Moreover, 2062 genes contain both hypermethylation and hypomethylation modification sites (Supplementary Figure 3). In addition, 1542 differentially expressed genes were identified in keloids based on 8769 common genes, including 517 upregulated and 1025 downregulated genes. The volcano map of differentially expressed genes is shown in Figure 1(a). The low-expression genes, hypermethylated genes, and hypoxia and immune-related genes were intersected to obtain immunity/hypoxia-related hypermethylated low-expression genes. A total of 16 immunity/hypoxia-related hypermethylated low-expression genes Figure 1(b) were identified in keloid, including cyclin-dependent kinase inhibitor 1A (CDKN1A), phosphoglycerate mutase 2 (PGAM2), dermcidin (DCD), WAP, follistatin/kazal, immunoglobulin, Kunitz, and netrin domain containing 1 (WFIKKN1). Additionally, the high-expression genes, hypomethylated genes, and hypoxia and immune-related genes were also intersected to obtain immunity/hypoxia-related hypomethylated high-expression genes. A total of 18 immunity/hypoxia-related hypomethylated high-expression genes Figure 1(c) were identified, including prostaglandin D2 synthase (PTGDS), semaphoring 5A (SEMA5A), interleukin 1 receptor type 1 (IL1R1), integrin subunit alpha L (ITGAL), and SOS Ras/Rac guanine nucleotide exchange factor 1 (SOS1).
Details are in the caption following the image
Identification of immunity/hypoxia-related differentially methylated/expressed genes in keloid. (a) Volcano map of all differentially expressed genes. The “limma” package was used to screen differentially expressed genes under a threshold value of p < 0.05. (b) Venn diagram of 16 immunity/hypoxia-related hypermethylated low-expression genes. (c) Venn diagram of 18 immunity/hypoxia-related hypomethylated high-expression genes.

3.3. Functional Analysis of Immunity/Hypoxia-Related Differentially Methylated/Expressed Genes in Keloid

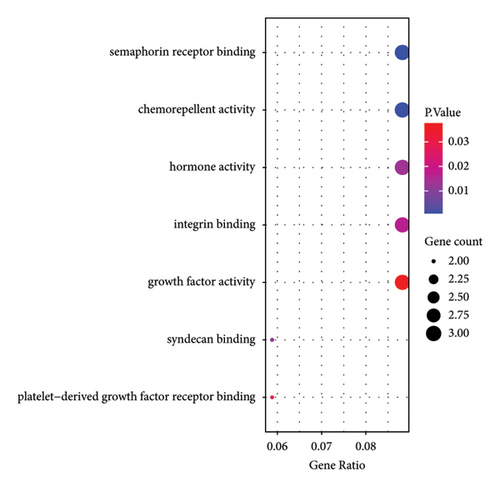
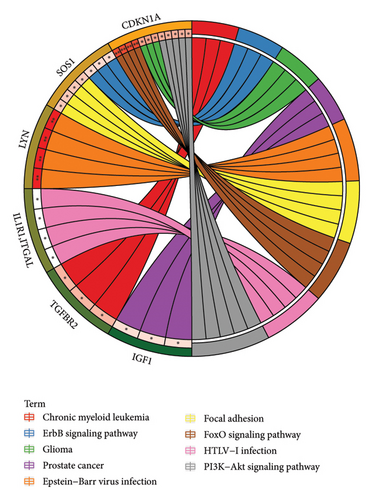
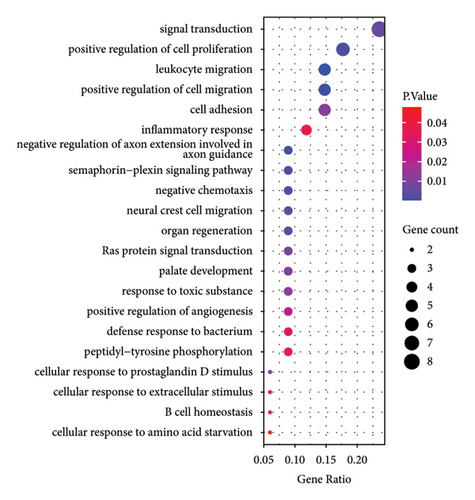
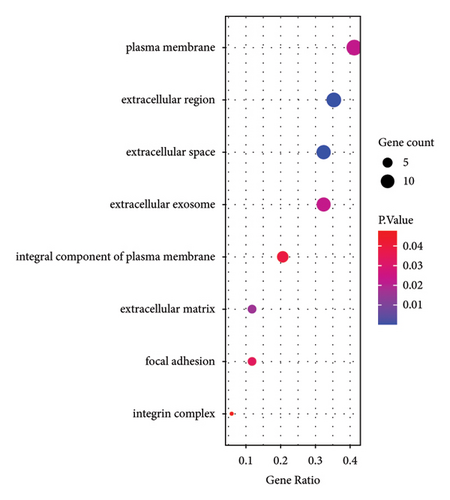
Based on GO analysis of 34 immunity/hypoxia-related differentially methylated and expressed genes, leukocyte migration, extracellular region, and semaphorin receptor binding were the most significantly enriched biological processes (Figure 2(a)), cytological components (Figure 2(b)), and molecular functions (Figure 2(c)), respectively. It is worth noting that some significantly enriched signaling pathways were identified in the KEGG analysis, including the FoxO, PI3K-Akt, focal adhesion, and ErbB signaling pathways Figure 2(d). In addition, CDKN1A is involved in the FoxO and PI3K-Akt signaling pathways, SOS1 is involved in focal adhesion and the ErbB signaling pathway, and ITGAL and IL1R1 are involved in HTLV-I infection. Therefore, we speculate that immunity/hypoxia-related differentially methylated and expressed genes may play a role in keloid progression by regulating these signaling pathways, and the specific mechanisms remain to be further studied.
Details are in the caption following the image
Functional analysis of immunity/hypoxia-related differentially methylated/expressed genes in keloid. (a) Biological process, (b) cytological component, (c) molecular function, and (d) signaling pathway. Significantly enriched GO and KEGG terms were identified using selection criteria of p < 0.05.

3.4. PPI Analysis of Immunity/Hypoxia-Related Differentially Methylated/Expressed Genes in Keloid

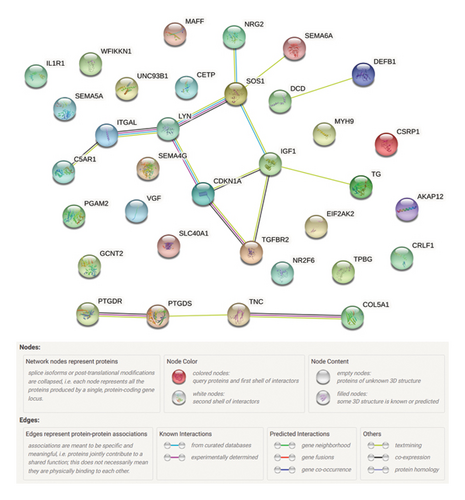
The online database STRING was used to investigate the protein interactions of 34 immunity/hypoxia-related differentially methylated/expressed genes. There were 16 genes with 15 edges in the PPI network (Figure 3). Edges represent protein-protein associations. It is implied that these proteins may interact to work together in regulating keloidogenesis and progression. Higher interaction scores indicate stronger interactions between the two proteins, among which three groups were identified with an interaction score of >0.9, which was worthy of further study in the future. The interaction score between LYN and SOS1 was 0.943. The interaction score between IGF1 and SOS1 was 0.925. The interaction score between CDKN1A and LYN was 0.914.
Details are in the caption following the image
PPI analysis of immunity/hypoxia-related differentially methylated/expressed genes in keloid.

3.5. Identification of Diagnostic Gene Biomarkers for Keloid

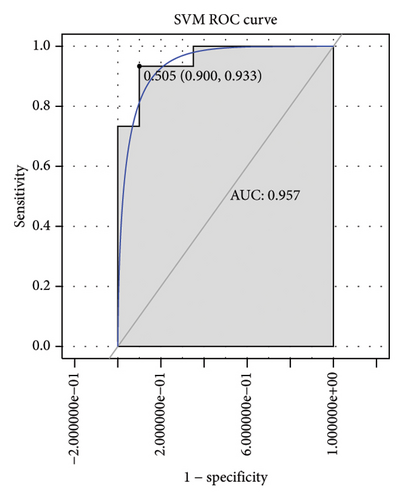
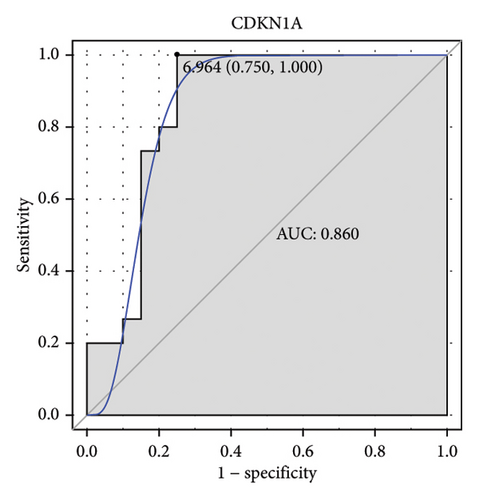
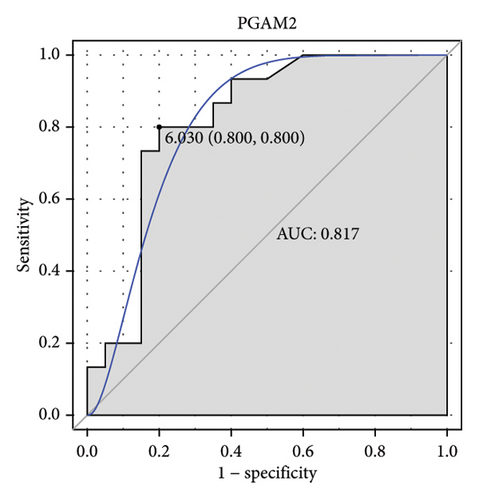
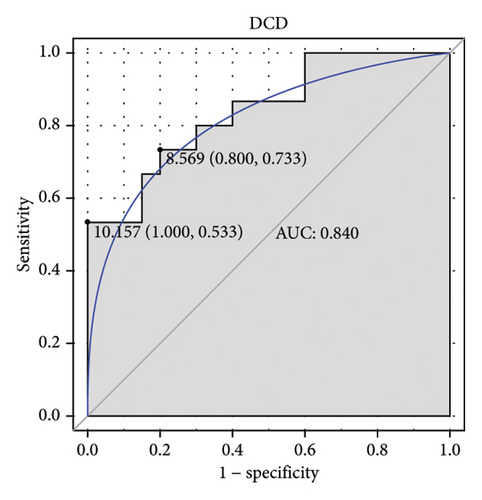
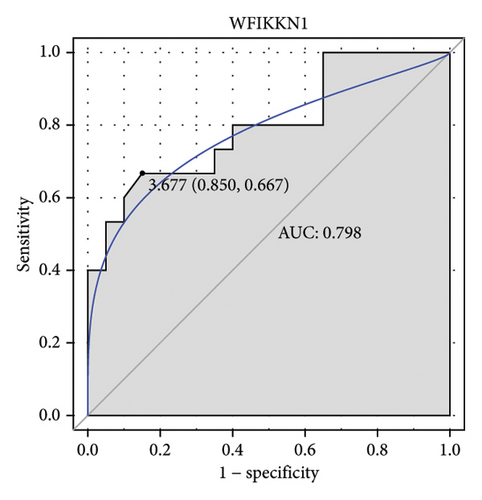
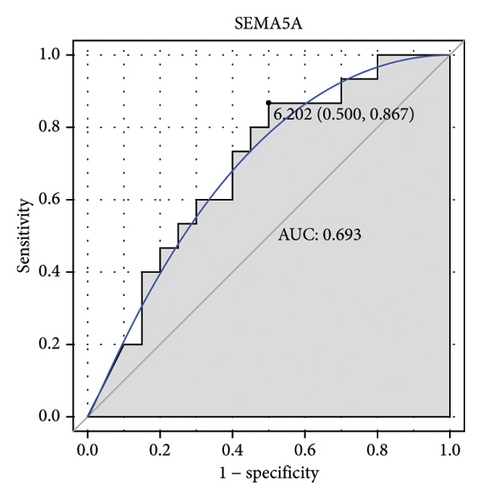
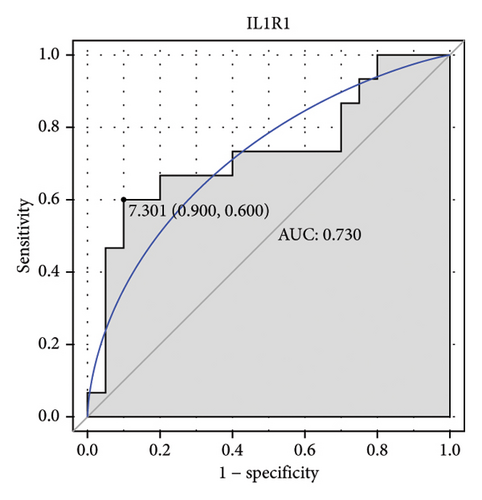
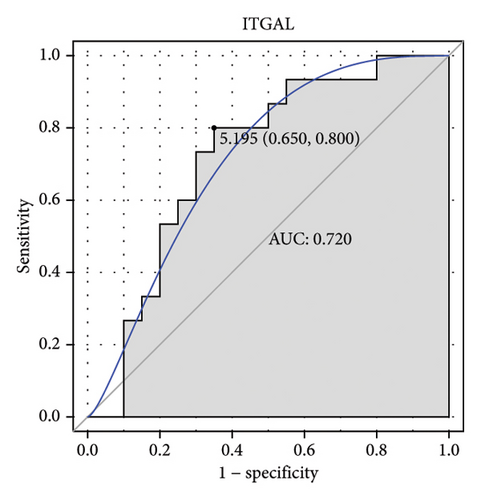
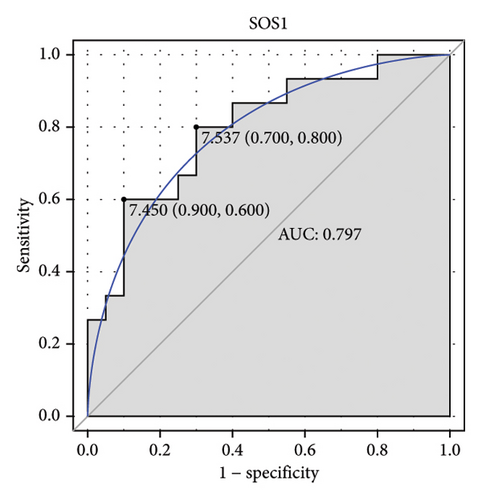
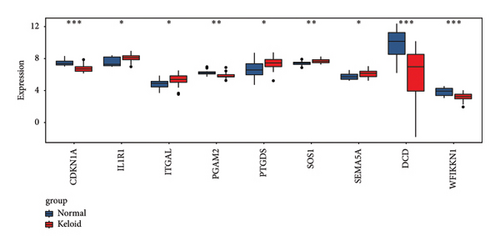
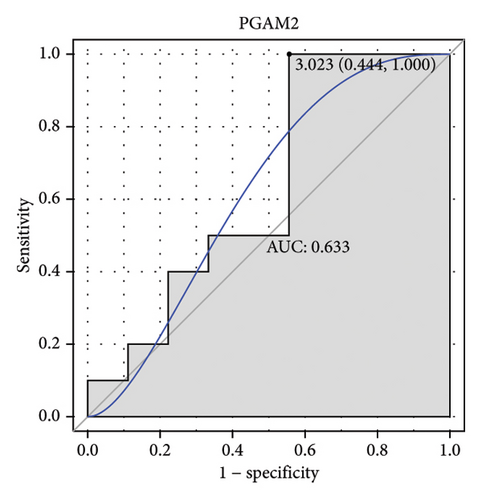
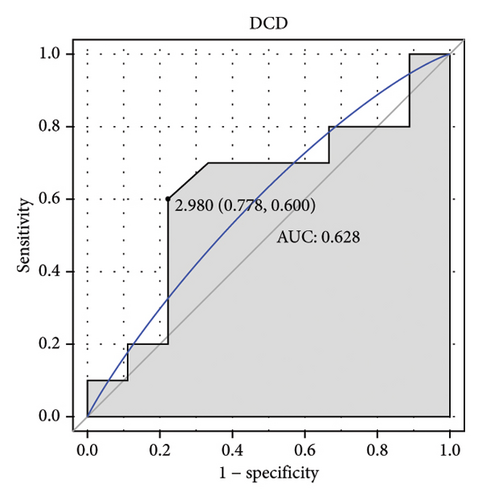
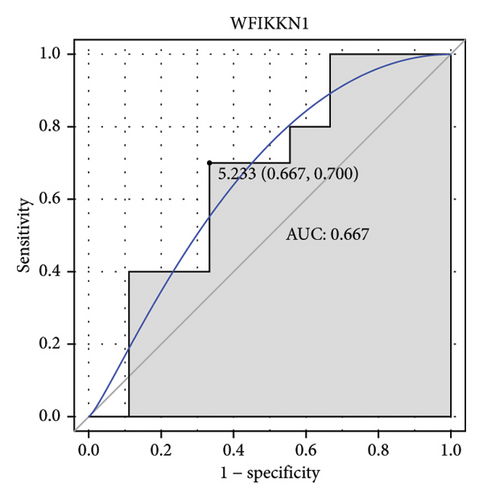
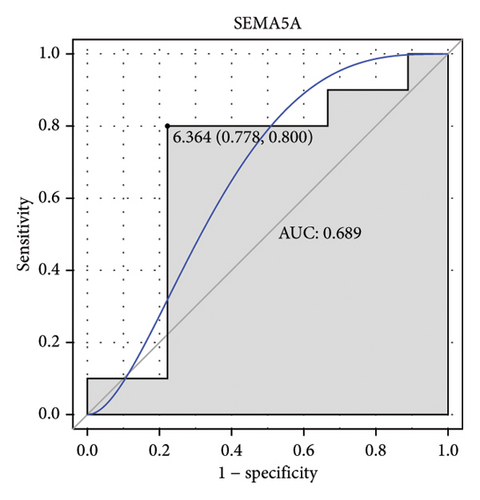
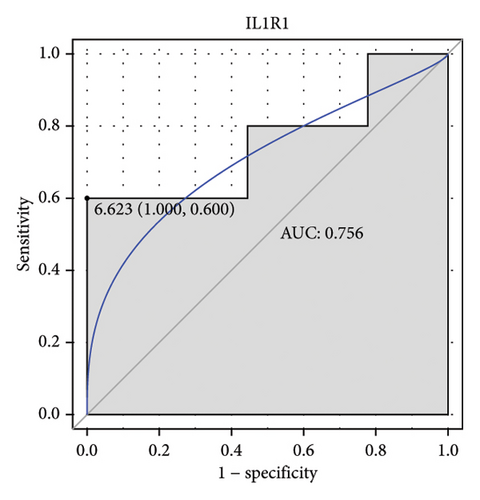
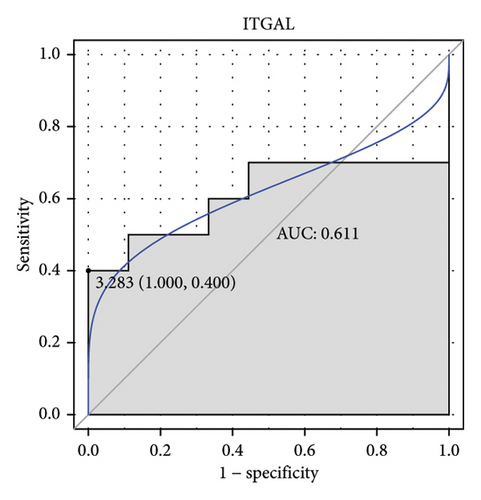
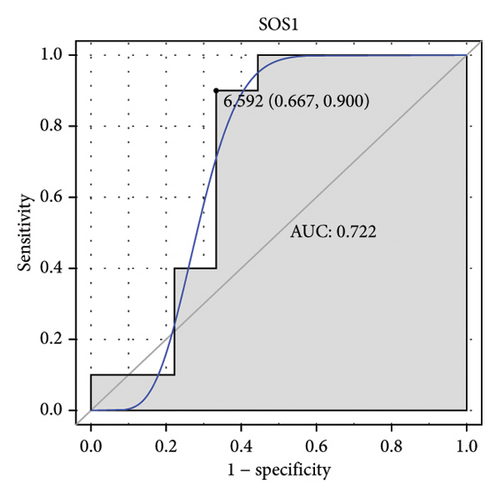
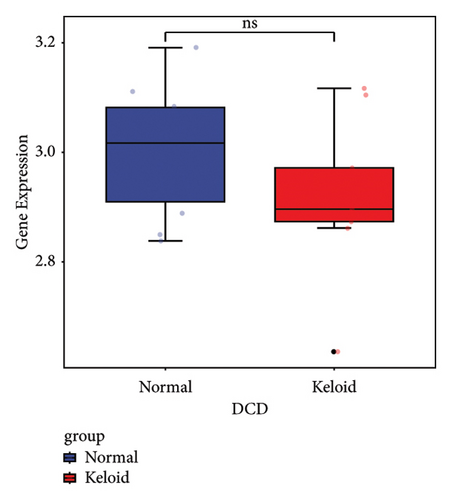
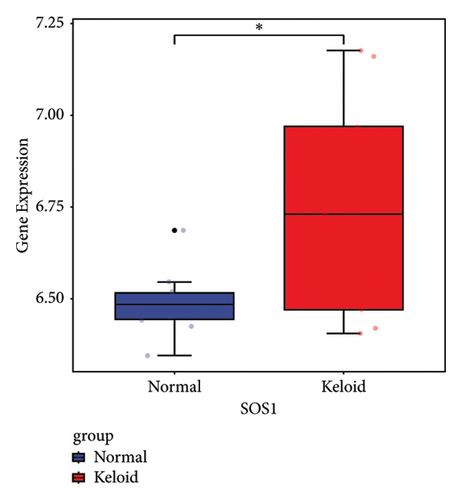
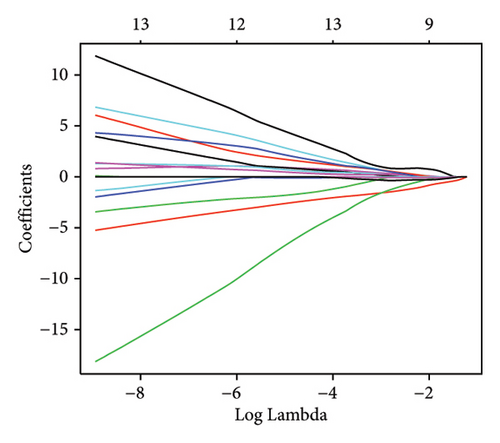
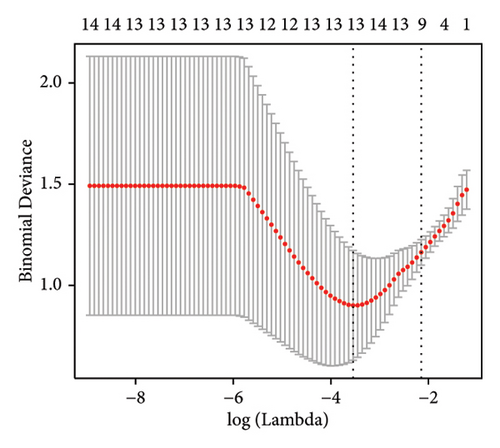
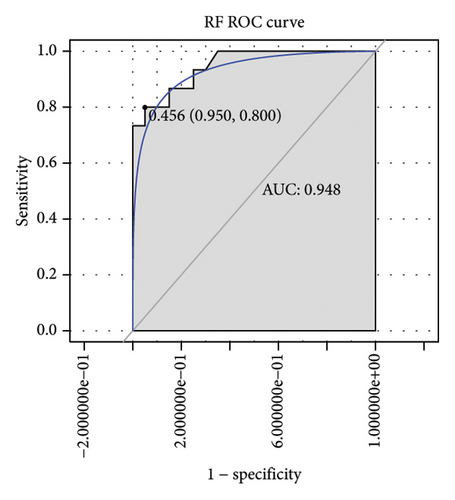
Machine learning was used to identify gene biomarkers that were most suitable for keloid diagnosis. Nine key genes were screened out from 34 immunity/hypoxia-related differentially methylated and expressed genes using LASSO regression analysis (Figures 4(a) and 4(b)). Among these nine genes, CDKN1A and PGAM2 are related to hypoxia and DCD, PTGDS, WFIKKN1, SEMA5A, IL1R1, ITGAL, and SOS1 are associated with immunity. RF and SVM models were constructed using the above-mentioned nine genes. ROC analysis showed that the AUC values of the RF and SVM models were 0.948 (Figure 4(c)) and 0.957 (Figure 4(d)), respectively. This implies that RF and SVM models may have high diagnostic value for keloid patients in this study. The single ROC and expression analyses of the nine genes are shown in Figures 4(e–m) and 5(n). The AUC value of all genes was greater than 0.6, indicating a potential diagnostic value for keloid patients in this study. Furthermore, the AUC values of the RF and SVM models were higher than that of all the individual genes, further suggesting that the RF and SVM models may play an important role in clinically distinguishing normal controls and disease groups. However, a large number of clinical samples need to be collected for further verification in the later stage.
Details are in the caption following the image
Identification of diagnostic gene biomarkers for keloid. (a) The process of reducing the number of variables and adjusting coefficients in LASSO regression model. The horizontal axis is the logarithm of the penalty coefficient λ, and the vertical axis represents the coefficient of each variable in the model. Lines of different colors represent different variables. With the increase of the λ, some unimportant variable coefficients quickly become 0, and the more important the variable, while the more important variables can be retained until the end. (b) The binomial deviance of the model changes with the change of Log (λ). The horizontal axis above displays the number of variables required for the corresponding model, gradually decreasing from left to right. The horizontal axis below displays the logarithm of the λ. The vertical axis is binomial deviance, which can be understood as the size of the error of the model. (c) Construction of the RF model and (d) construction of the SVM model. (e–m) Single ROC analysis of nine diagnostic gene biomarkers in the training set. (n) Expression analysis of nine diagnostic gene biomarkers in the training set. The T test was used to analyze the significant difference between the two groups.  p < 0.05;  ∗∗p < 0.001;  ∗∗∗p < 0.001.

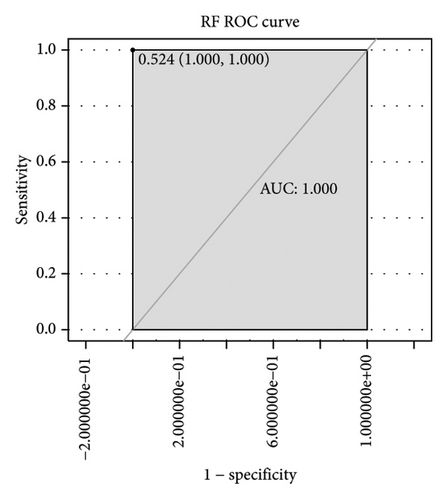
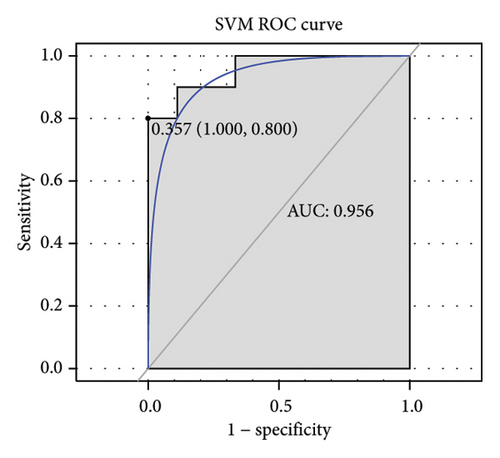
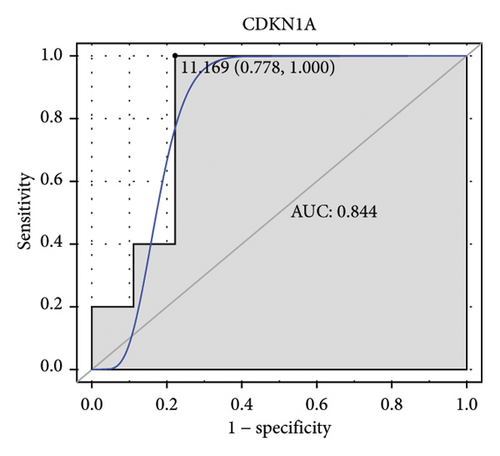
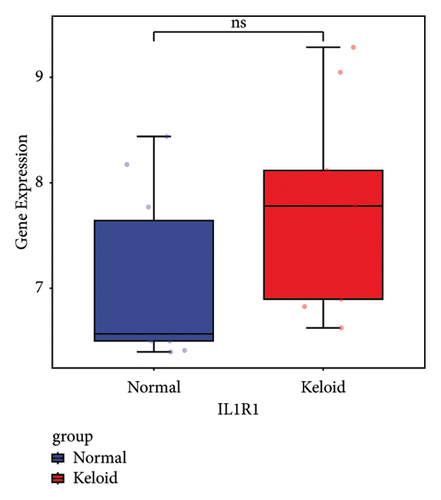
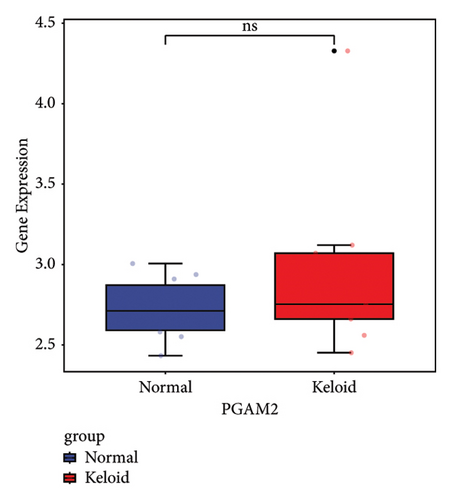
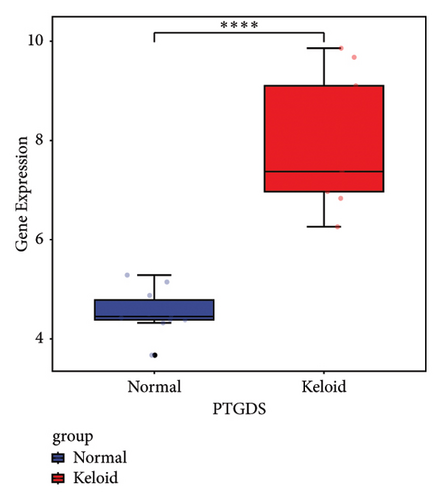
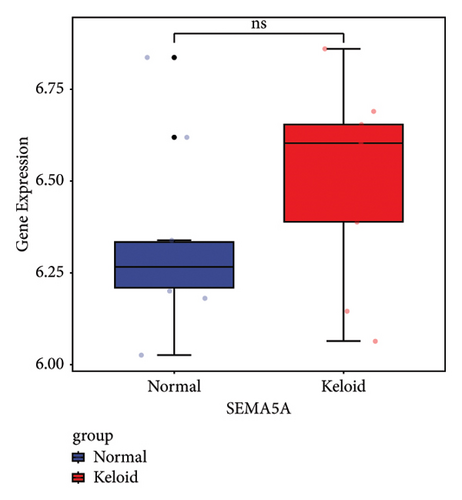
Subsequently, the ROC of the RF and SVM models (Figure 5(a) and 5(b)) and that of a single gene from the nine genes Figure 5(c–j) were also analyzed in the validation dataset of GSE145725. Unfortunately, the ROC map of the PTGDS gene cannot be drawn because of insufficient smooth points. ROC analysis showed that the AUC values of the RF and SVM models were 1 and 0.956, respectively. This once again implies that RF and SVM models constructed from the aforementioned nine genes may have high diagnostic accuracy for keloid patients in this study. The ROC results of eight single genes were in line with the results in the training set. The expression of genes was also detected in the validation dataset, GSE145725 (Figure 5(k–r)). Most of the gene expression trends were consistent with the results of the training set.

Details are in the caption following the image
ROC analysis and expression validation in the validation dataset of GSE145725. (a) ROC analysis of RF model in the validation dataset of GSE145725, (b) ROC analysis of SVM model in the validation dataset of GSE145725, (c–j) ROC analysis of eight single diagnostic genes in the validation dataset of GSE145725, and (k–r) the expression of genes in the validation dataset of GSE145725. The T test was used to analyze the significant difference between the two groups.  p < 0.05;  ∗∗∗∗p < 0.0001; ns, not significant.

3.6. Identification of TFs Associated with Diagnostic Gene Biomarkers

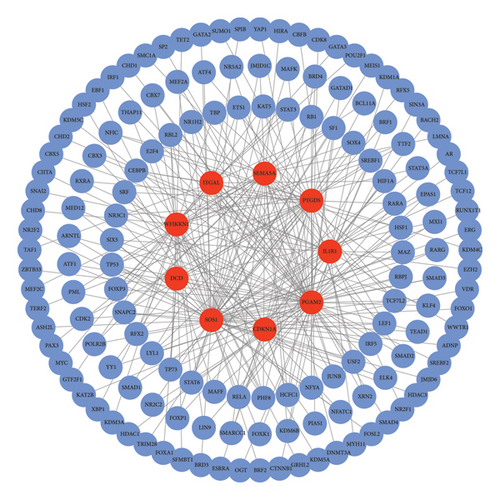
Transcription is an essential step in gene expression. TFs are fundamental to the regulation of gene expression [24]. Searching for TFs associated with nine diagnostic genes can provide potential research directions for future molecular mechanisms. Herein, 148 TFs related to nine diagnostic gene biomarkers were identified through correlation analysis (|Pearson correlation coefficient| > 0.5 and p < 0.05). A regulatory network between the nine diagnostic gene biomarkers and 148 TFs was constructed using Cytoscape (Figure 6). PGAM2 is a hypoxia-related gene with 66 TFs involved in its regulation. SOS1 is an immune-related gene with 65 TFs involved in its regulation. Moreover, SOS1, PGAM2, PTGDS, IL1R1, CDKN1A, ITGAL, DCD, SEMA5A, and WFIKKN1 had the highest correlation with TFs EPAS1 (0.826), NR2C2 (0.825), STAT3 (0.805), SOX4 (0.767), USF2 (0.760), TAF1 (0.738), FOXA1 (0.729), SMAD2 (0.711), and RXRA (0.660), respectively. The identified TFs may play an important regulatory role in the expression of the nine diagnostic genes, and the specific mechanisms will be further studied in the future.

Details are in the caption following the image
The regulatory network between nine diagnostic gene biomarkers and 148 TFs in keloid. Red and blue represent the diagnostic gene biomarker and TF, respectively.

3.7. Expression Validation of Immunity/Hypoxia-Related Differentially Methylated/Expressed Genes in Keloid

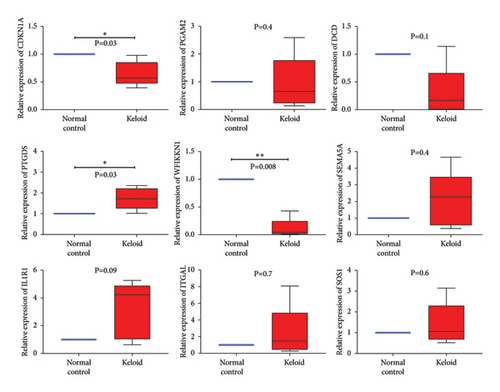
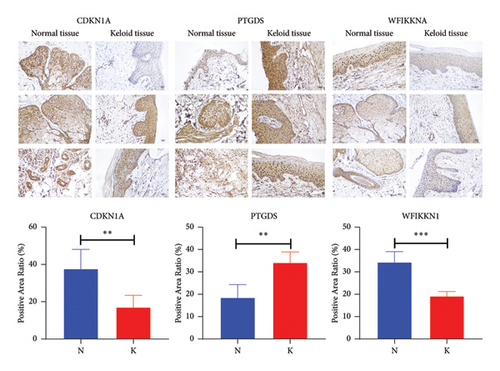
In total, two hypoxia-related genes (CDKN1A and PGAM2) and seven immunity-related genes (DCD, PTGDS, WFIKKN1, SEMA5A, IL1R1, ITGAL, and SOS1) were used to validate expression using RT-qPCR (Figure 7). All primers used for RT-qPCR validation are shown in Table 3. PTGDS, SEMA5A, IL1R1, ITGAL, and SOS1 were upregulated, and CDKN1A, PGAM2, DCD, and WFIKKN1 were downregulated in keloid tissue samples compared with normal tissue samples. This expression trend was consistent with the results of the bioinformatics analysis. In addition, CDKN1A, PTGDS, and WFIKKN1 were selected for immunohistochemical analysis (Figure 8). The results showed that compared with normal tissues, the expression levels of CDKN1A and WFIKKN1 in keloid tissues were decreased, while the expression level of PTGDS in keloid tissues was increased. The results were consistent with the results of bioinformatics analysis and RT-qPCR analysis.

Details are in the caption following the image
Expression validation of immunity/hypoxia-related differentially methylated/expressed genes in keloid. The T test was used to analyze the significant difference between the two groups.  p < 0.05;  ∗∗p < 0.01.
Table 3. All primer sequences used for RT-qPCR validation.
Primer name Primer sequence (5′ to 3′)
GAPDH-F (internal reference) GGA​GCG​AGA​TCC​CTC​CAA​AAT
GAPDH-R (internal reference) GGC​TGT​TGT​CAT​ACT​TCT​CAT​GG
CDKN1 A-F TGT​CCG​TCA​GAA​CCC​ATG​C
CDKN1 A-R AAA​GTC​GAA​GTT​CCA​TCG​CTC
PGAM2-F AGA​CCA​GGC​GAT​CAT​GGA​G
PGAM2-R GTG​CCT​TTA​TTG​CCC​AAG​C
PTGDS-F CCA​ACT​TCC​AGC​AGG​ACA​AG
PTGDS-R ATG​GTT​CGG​GTC​TCA​CAC​TG
SEMA5 A-F TGA​GGC​GGG​AGT​ATC​ATT​TG
SEMA5 A-R AGA​GAG​CCA​CTT​GGG​GAC​AT
IL1 R1-F ATG​AAA​TTG​ATG​TTC​GTC​CCT​GT
IL1 R1-R ACC​ACG​CAA​TAG​TAA​TGT​CCT​G
ITGAL-F CCG​CTA​CAT​CAT​CGG​GAT​T
ITGAL-R CTG​TTT​GCT​TGT​GCC​CTC​A
SOS1-F AAA​CCC​TAA​GCC​TCT​CCC​AAG
SOS1-R TTG​GAG​AAT​TTG​GTG​CAG​ATG
DCD-F GAA​GAC​CCA​GGG​TTA​GCC​AGA
DCD-R GCT​CCT​TTA​CCC​ACG​CTT​TCT
WFIKKN1–F GAG​TCA​CCA​GCG​AGA​GAA​CCT
WFIKKN1-R GGA​CCA​CAG​AGA​GTG​GGA​AGT
Details are in the caption following the image
Immunohistochemical analysis of CDKN1A, PTGDS, and WFIKKN1 in keloid. The T test was used to analyze the significant difference between the two groups.  ∗∗p < 0.01;  ∗∗∗p < 0.001. N, normal sample; K, keloid sample.

4. Discussion

In this study, 34 immunity/hypoxia-related differentially methylated/expressed genes were identified in keloids. Subsequently, nine key genes were screened out from 34 immunity/hypoxia-related differentially methylated and expressed genes using LASSO regression analysis. The nine genes included two hypoxia-related genes (CDKN1A and PGAM2) and seven immunity-related genes (DCD, PTGDS, WFIKKN1, SEMA5A, IL1R1, ITGAL, and SOS1). Novel hypoxia- and immune-related diagnostic models for keloids were developed based on CDKN1A, PGAM2, DCD, PTGDS, WFIKKN1, SEMA5A, IL1R1, ITGAL, and SOS1 to provide new insights into accurate diagnosis and treatment at the gene level. The ROC curve is a common method for evaluating diagnostic accuracy [25, 26]. In the ROC analysis, the AUC value range of 0.6–0.7 indicated that the diagnostic accuracy was sufficient, and 0.9–1 indicated that the diagnostic accuracy was excellent [23]. Herein, the ROC analysis of RF and SVM models in the training set and the validation set showed that their AUC values were in the range of 0.9–1. This implies that RF and SVM models constructed based on 9 key immunity/hypoxia-related differentially methylated/expressed genes have high diagnostic accuracy and are better at distinguishing keloid from control. In addition, ROC analysis was also performed for these nine model genes. The results showed that the AUC values of all nine genes were greater than 0.6, indicating that individual genes also have certain diagnostic accuracy and classification performance. Furthermore, the AUC values of the RF and SVM models were higher than that of all the individual genes, further suggesting that the RF and SVM models may play an important role in clinically distinguishing normal controls and disease groups. However, a large number of clinical samples need to be collected for further verification in the later stage.
The p21 protein, encoded by CDKN1A, inhibits the cyclin-dependent kinase 2 (CDK2)/Cyclin E complex to induce cell cycle arrest [27]. In keratinocytes of newborn mice, knockout of CDKN1A promotes cell proliferation and enhances short-term engraftment ability [28]. Decreased CDKN1A expression is observed in warts [29]. It has been reported that CDKN1A downregulation promotes keloid progression [30]. It is speculated that CDKN1A is a suppressor of fibroblasts and functions through the cell cycle pathway in keloids [30]. PGAM2, a glycolytic enzyme, is expressed in anaerobic tissues, including skeletal muscle. In tumor cells, increased oxidative stress can stimulate PGAM2 activity and enable cells to adapt to hypoxic conditions [31]. PGAM2 deficiency results in serious muscle dysfunction in hypertrophic fibers [32, 33]. Decreased PGAM2 expression is found in proliferative diseases induced by local infections [34]. In this study, CDKN1A and PGAM2 were found to be hypermethylated and downregulated in keloids and were model genes for constructing RF and SVM models. Moreover, PGAM2 and CDKN1A had the highest correlation with TFs NR2C2 (0.825) and USF2 (0.760), respectively. This implies that the role of PGAM2 and CDKN1A in keloids may be influenced by NR2C2 and USF2. Herein, CDKN1A was also found to have a high interaction score with LYN (0.914), so it was speculated that CDKN1A might interact with LYN to regulate keloids. The identification of the potential correlation between these molecules lays theoretical foundation for understanding the molecular mechanism of keloids in the future.

DCD is specifically expressed in eccrine sweat glands and secreted in sweat [35]. DCD has antimicrobial properties and prevents fungal colonization [36]. WFIKKN1 is a folliclestatin-related protein that plays a role in muscle and bone tissue, but its role in other tissues is poorly understood [37, 38]. PTGDS, a representative marker gene of fibroblasts, is overexpressed in malignant melanomas [39, 40]. SEMA5A is involved in axon guidance pathways in galactosyltransferase II-deficient skin fibroblasts [40]. IL1R1, which is associated with the immune response, is upregulated in skin scratching stimulation [41]. There were no overt skin abnormalities in mice deficient in IL1R1 [4246]. In addition, reduced infiltration of inflammatory cells in Il1r1 −/− mice leads to decreased scar formation in deep wounds [47]. ITGAL, which is related to neutrophil-mediated immunity, is involved in the regulation of T cell differentiation and lymphocyte activation in skin cutaneous melanoma [48]. Increased SOS1 expression leads to the development of skin papillomas with 100% penetrance [49, 50]. SOS1 disruption results in severe impairment of the ability to repair skin wounds and almost complete ablation of the inflammatory response at the injury site [51]. A direct mechanistic correlation between SOS1 depletion and specific alterations in skin homeostasis has been established, including a profound reduction in skin thickness (correlated with decreased keratinocyte proliferation), defects in hair follicles and sebaceous gland integrity, and significant alteration of the hypodermis [51]. Herein, PTGDS, SEMA5A, IL1R1, ITGAL, and SOS1 were hypomethylated and upregulated, whereas DCD and WFIKKN1 were hypermethylated and downregulated in keloid. Immune regulation of these genes may be associated with keloid formation. ROC analysis showed that they also have potential diagnostic value, and the RF and SVM models constructed with their participation have higher diagnostic accuracy. It was noted that SOS1 was involved in disease regulation with 65 TFs and had a higher interaction score with other molecules in the PPI network, indicating a synergistic effect of SOS1 and other molecules in the development of keloids. Moreover, SOS1, PTGDS, IL1R1, ITGAL, DCD, SEMA5A, and WFIKKN1 had the highest correlation with TFs EPAS1 (0.826), STAT3 (0.805), SOX4 (0.767), TAF1 (0.738), FOXA1 (0.729), SMAD2 (0.711), and RXRA (0.660), respectively. The identification of the potential correlation between these molecules provides potential research directions for understanding the molecular mechanism of keloids in the future.

According to KEGG analysis, some significantly enriched signaling pathways of immunity/hypoxia-related differentially methylated/expressed genes were identified, including the FoxO, PI3K-Akt, focal adhesion, and ErbB signaling pathways. In addition, CDKN1A is involved in the FoxO, glioma, and PI3K-Akt signaling pathways. SOS1 is involved in focal adhesion and the ErbB signaling pathway. ITGAL and IL1R1 are involved in HTLV-I infection. FOXOs proteins are involved in the pathogenesis of several skin disorders, such as acne and psoriasis [52]. The activation of PI3K-Akt pathway enhances angiogenesis, inflammation, and deposition of extracellular matrix components in keloids [53]. In keloids, the migratory feature of fibroblasts and their ability to migrate outside the original wound margin is concomitant with the disassembly of focal adhesions in migrating fibroblasts [5456]. Dysfunction of the ErbB signaling pathway is one of the mechanisms of keloid formation [57]. Thus, these signaling pathways play a crucial role in keloid development.

In summary, nine immunity/hypoxia-related differentially methylated and expressed genes were selected as potential diagnostic markers for keloids, including CDKN1A, PGAM2, DCD, PTGDS, WFIKKN1, SEMA5A, IL1R1, ITGAL, and SOS1. Additionally, some significantly enriched signaling pathways were identified, including the FoxO, PI3K-Akt, focal adhesion, and ErbB signaling pathways. Our study may provide novel models for understanding the molecular mechanisms of keloids with regard to immunity and hypoxia. However, our study had some limitations. First, the expression of the identified genes needs to be validated in a larger number of tissue samples from patients with keloids. Second, the potential pathological mechanisms of immunity/hypoxia-related genes and signaling pathways need to be explored in vivo and in vitro. Third, the classification performance of the constructed RF and SVM models still needs to collect a large number of clinical samples for further verification.

Ethical Approval

This study was approved by the Ethics Committee of the Plastic Surgery Hospital, Chinese Academy of Medical Sciences (2023−1).

Consent

Informed consent was provided by all participants and their families.

Conflicts of Interest

The authors declare that they have no conflicts of interest.

Authors’ Contributions

Chun-Hu Wang and Zi-Rong Li contributed equally to this work.

Data Availability

The datasets generated during and analyzed during the current study are not publicly available but are available from the corresponding author upon reasonable request.

    The full text of this article hosted at iucr.org is unavailable due to technical difficulties.