Multistrategy Fusion Particle Swarm for Dynamic Economic Dispatch Optimization of Renewable Energy Sources
Abstract
This paper presents a multistrategy fusion particle swarm optimization model for dynamic economic dispatching of renewable energy in distribution networks. The objective is to minimize active network losses and system voltage deviation while considering the integration of distributed energy sources and static reactive power compensators. The algorithm incorporates specific strategies, including a particle position change strategy based on the midpipeline convergence approach, a strategy for generating exploding particles near the optimal particles, and a particle velocity update strategy relying on the global optimal particle position. The inertia weights and particle position update methods of the simplified particle swarm optimization algorithm are also utilized. Simulation experiments are conducted on an IEEE 33 bus radial distribution system, demonstrating the effective optimization of system losses while ensuring system voltage stability. This research contributes to the scientific understanding of renewable energy integration in distribution networks and its economic dispatching.
1. Introduction
Renewable energy sources are being actively promoted to replace fossil fuels, as part of efforts to achieve comprehensive green transformation in economic and social development [1]. The shift towards clean and low-carbon energy consumption is accelerating, driving the energy industry towards high-quality development. The rapid and stable economic growth has led to increased energy demand and consumption [2]. To meet this demand while reducing power losses and emissions, renewable energy-based power generation technologies, in the form of distributed generation (DG), are being integrated into existing power networks to supply electricity to local customers [3–5].
Various studies have been conducted by researchers worldwide to optimize the siting and capacity planning of DG from different perspectives. For example, Song et al. [6] improved the genetic algorithm for distributed power planning using a multiobjective optimization model. Abo El-Ela et al. [7] enhanced the gray wolf algorithm by incorporating chaotic sequences and considering multiple objectives. Karunarathne et al. [8] applied a chaotic search strategy in the cat swarm algorithm to minimize system losses and power purchase costs. Balu and Mukherjee [9] improved the particle swarm algorithm for determining the optimal location and capacity of DG.
The integration of renewable energy sources, such as wind and solar, presents challenges due to their variability and uncertainty, leading to imbalances in power generation and consumption [10–14]. The economic operation of renewable energy sources has become a major research focus. Several optimization models and algorithms have been proposed, including those considering wind-heat systems [15], optimal power system dispatch under combined uncertainty of wind power [16], and real-time economic dispatch models accounting for renewable energy variations [17].
While these solutions have shown promise, there is still a need to improve their stability and adaptability. Particle swarm optimization (PSO) algorithms, known for their simplicity and efficiency, have been widely used for optimization problems. They suffer from limitations such as premature convergence and low convergence accuracy. To address these issues, researchers have explored various improvements to the PSO algorithm, such as adjusting inertia weights [18], enhancing population diversity [19, 20], and incorporating other algorithms [21].
In this paper, a multistrategy fusion particle swarm model is proposed for dynamic economic dispatch of renewable energy. The objective is to minimize active network losses and voltage deviations, while considering the operating limits of the AC distribution network. The effectiveness of the proposed model is demonstrated using the IEEE 33 node bus radial distribution system.
2. Methodology
2.1. Optimization Model of Distribution Network System with Distributed Renewable Energy
For distribution networks connected with distributed generation (DG), the control of active network losses involves optimizing the reactive power of the system while simultaneously optimizing the node voltage. The mathematical model consists of an objective function, power constraints, and equations for control variables.
- (1)
UV access method for distributed renewable energy
- (2)
Distributed renewable energy UQ access method
- (3)
Distributed renewable energy UX access method
Active network loss is a crucial economic and technical parameter in distribution networks, and optimizing it is essential for improving equipment operation from an economic perspective. Simultaneously, nodal voltage deviation is an important indicator that impacts the efficiency and working condition of power equipment, and it should be taken into consideration.
2.2. Improved Particle Swarm Algorithm for Multistrategy Fusion
2.2.1. Convergence Strategy of the Midperm Algorithm
- (1)
MA determines that the region where the optimal value U exists must be located in the region of the midpipeline against the G side (the yellow region in Figure 1), and U must not be located in the region of L against the H side
- (2)
MA discards the original point H and generates a new random point H′ in the region of L against G
- (3)
Make G and H′ form the midline of the line L′, as shown in Figure 1. At this point, H′ is closer to point U; that is, H′ is better adapted, so MA determines that the optimal value must exist in the region of L′ against H′ (the orange grid region in Figure 1)
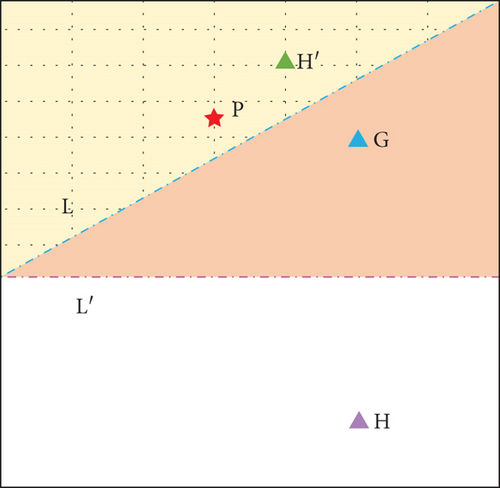
A new point G is generated in the area where the optimal point is likely to exist, and then, the space where the optimal point is located can be narrowed down by the midpipeline determination method. Repeat the above steps to find the optimal point.
2.2.2. Particle Position Change Strategy Incorporating Convergence Strategy of Midpipeline Algorithm
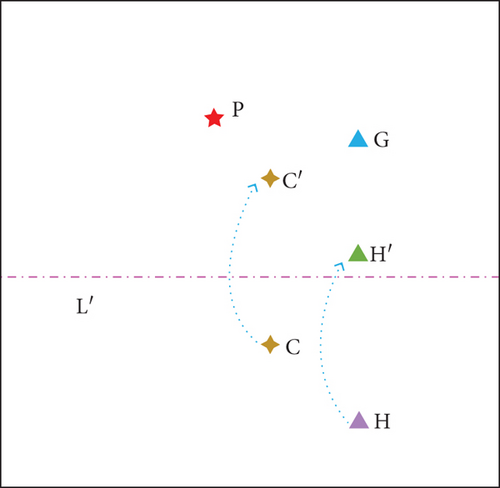
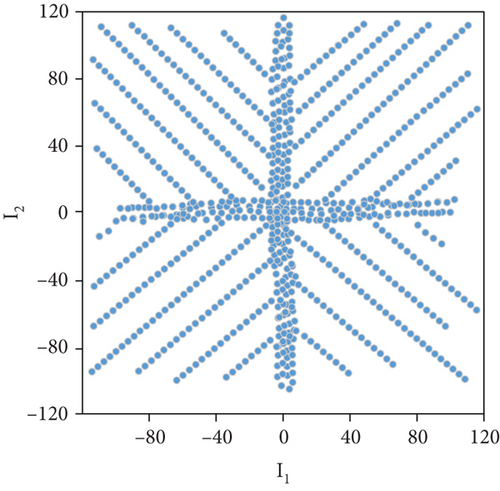
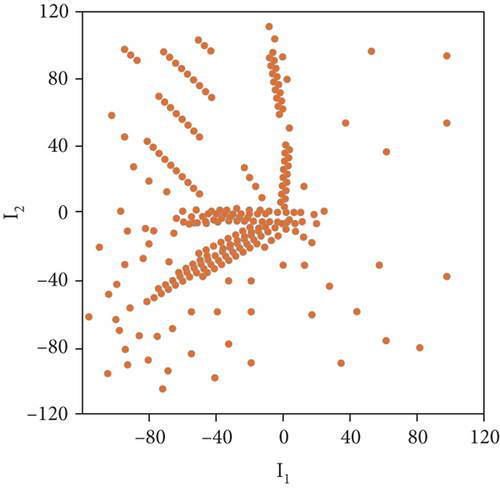
Figures 3 and 4 show the variation of particles when finding the minimum of the function for the improved PSO algorithm incorporating the above strategies.
- (a)
When facing a single extremum problem, the slow displacement of particles that are in the region judged by the MA convergence strategy as impossible to exist at the best advantage can be effectively avoided. This helps to accelerate the convergence accuracy of the algorithm. Compared with the convergence strategies of the particle swarm algorithm, genetic algorithm, and whale algorithm, the convergence strategy of MA has great advantages in convergence accuracy and speed
- (b)
When facing a complex optimization problem with multiple extremes, the convergence strategy of the midpipeline algorithm may cause the particle swarm algorithm to directly discard the optimal point range and search in the minimal value range. As the population of the algorithm increases, the probability of occurrence of this situation decreases significantly. At the same time, as the algorithm’s extreme value points increase, the probability that the distance between the optimal points G and H determined at each iteration is greater will be greater, and the range of optimal points determined by the convergence strategy of MA will be greater, causing a further reduction in the probability of the above problem. The convergence strategy of the midpipeline algorithm will cause a reduction in the global merit-seeking performance of the algorithm, but the reduction is not significant
- (c)
Despite the appeal problem, if the region where the optimal point exists as determined by the previous MA convergence strategies is correct, all particles will be searched in the correct region. This can greatly enhance the global optimal search performance of the algorithm in that region
2.2.3. Optimal Particle Explosion Strategy
The y-th dimensional variable of the t-th exploded particle eit is generated in equation (18). These particles are generated around the optimal particle, and the range of generated particles is 1/4 of the difference between the dimensions of the optimal particle abest (i.e., point G) and point H.
2.2.4. Improved Particle Velocity Update Strategy
That is, the velocity of particle ix is influenced by the explosive particle eit, making the particle converge to the explosive particle eit. The x-th conventional particle ix is chosen to converge to the t-th explosive particle eit with equal probability. After the velocity update using equations (19) and (20), the position change of different particles is shown in Figure 5. The particle with velocity update by equation (19) will be close to the current optimal point abest. The particle with velocity update by equation (20) will be close to the particle eit produced by the explosion of abest.
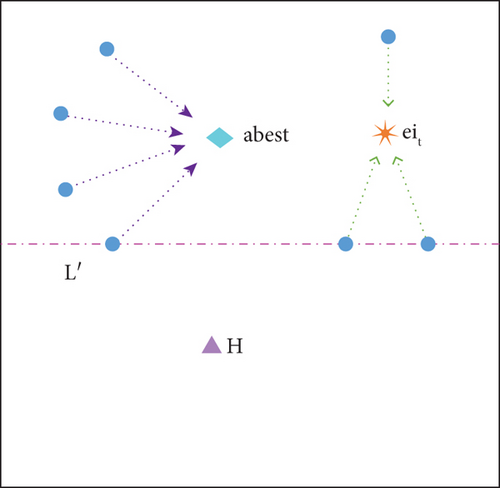
Using this strategy has these advantages: (a) part of the particles updated by the speed of equation (19) can ensure that part of the algorithm constantly converge to the optimal point, which helps the algorithm to stabilize. (b) The velocity update of some particles according to equation (20) can make some of the particles in the algorithm positioned close to the exploding particles around the optimal particles. This can enhance the diversity of particle populations and enhance the global optimization finding ability of the algorithm.
2.2.5. Improved Particle Position Update Strategy
2.2.6. Inertia Weight Update Strategy
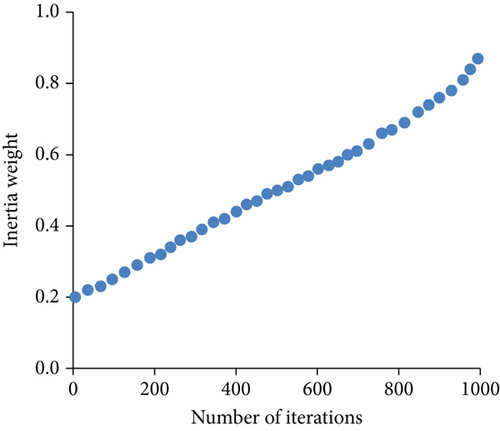
2.2.7. Algorithm Implementation Steps
According to the above introduction, the implementation of the improved multistrategy fusion particle swarm optimization algorithm in this paper can be obtained.
-
Algorithm 1: Multistrategy fusion particle swarm algorithm.
-
Input: same initial values for variables, fitness function, maximum number of iterations, problem dimension.
-
Output: best fitness value, optimal particles.
-
1) Initialize parameters: population learning rate, particle velocity parity, number of exploding particles t, total population w, mmin and mmax.
-
2) Initialize the population of traditional particles by generating (w − t) particles and calculate the fitness for each particle.
-
3) Set the particle with the best fitness as abest (point G) and the particle with the second-best fitness as point H.
-
4) Generating inertia weights m with equation (22).
-
5) Generating t exploding particles by equation (18).
-
6) Update the velocities of α × (t − w) random conventional particles using equation (19).
-
7) Update the velocities of the remaining traditional particles using equation (20).
-
8) Update the positions of traditional particles using equation (21).
-
9) Calculate the fitness of all traditional particles.
-
10) Update the values of abest (point G) and point H.
-
11) Check if the end condition of the algorithm is met. If so, terminate the algorithm; otherwise, go to step 4.
By fusing these strategies together, the proposed algorithm combines the exploration capability of exploding particles, the exploitation capability of conventional particles, and the update strategies based on particle velocities and positions. The algorithm dynamically adjusts the particle velocities and positions, using both global and historical information, to guide the search towards better solutions. This fusion of strategies enables proposed method to effectively balance exploration and exploitation, leading to improved optimization performance and the identification of optimal solutions.
3. Result Analysis and Discussion
3.1. Experimental Setup
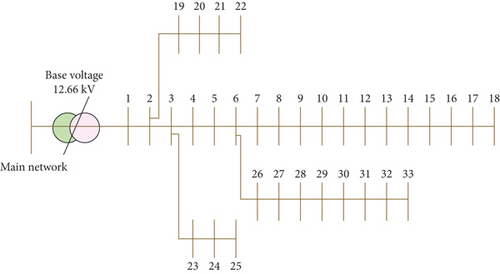
To verify the superiority and feasibility of the proposed algorithm, this paper carries out the analysis of the algorithm based on the IEEE 33 node distribution network model with enhanced distributed generation. The experimental analysis is performed using Python 2.7 environment, and the implementation platform is a standalone Intel Xeon E5-2650 processor. In this experiment, the number of populations is 200, the maximum number of iterations is 250, and the experimental results are averaged. The algorithm of this paper was tested on an IEEE 33 bus radial distribution system (see Figure 7).
3.2. Analysis of Simulation Results
3.2.1. Analysis of Network Loss Impact
Minimal value seeking is performed on the normalized objective function after normalization. Literatures [22, 23] are used to compare with the algorithm in this paper, and the results are shown in Figure 8.

As can be seen from Figure 8, in the scheme where DG is not connected to the distribution network, the active power loss of the system can reach about 2012.1 kWh. After the DG is connected to the distribution network, the active power loss is reduced from 2012.1 kW to 957.3 kW by using the proposed model. Literature [22] and literature [23] are smaller than the optimization results of the proposed algorithm. The experiments prove that the optimized model of this paper has significantly improved the system absorption and support capacity and enhanced the power transmission capacity of the distribution network.
3.2.2. Node Voltage Impact Analysis
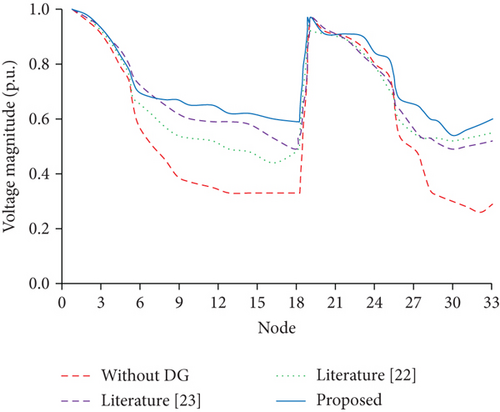
Figure 9 shows the voltage scaling values of each node before and after the access to DG with different optimization models for siting and capacity determination. From the figure, it can be seen that the minimum values of node voltages have been increased after accessing DG. When the distribution network is not connected to DG, the minimum value of system voltage is around 0.265 p.u. at node 32. In literature [22], the lowest node voltage amplitude was found at node 16 with 0.442 p.u. after the optimization of the model. In literature [23], the lowest node voltage amplitude occurs at node 18, which is about 0.496 p.u. The lowest node voltage amplitude occurs at node 30 after the input of the model optimization strategy in this paper, reaching a minimum voltage of 0.545 p.u. at the node. The results indicate that the overall boost voltage level is the best. In summary, in terms of voltage magnitude, the model in this paper has the best improvement on the system voltage, the model in literature [23] has the second-best improvement, and the model in literature [22] is the worst.
3.2.3. Comparative Analysis of Algorithm Effect
To demonstrate the optimization effect of the improved particle swarm algorithm, the improved algorithm in this paper and two other comparative algorithms are used to optimize under the same network. The results are shown in Figure 10 and Table 1.
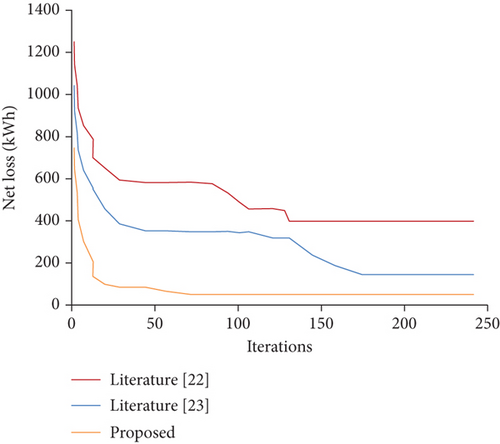
It can be seen from Figure 10 that the proposed algorithm has the smallest value of network loss. The improved PSO optimization algorithm access in this paper plays a significant role in the network loss reduction of the distribution network system. It shows that the algorithm improves the individual location optimization of the population and is effective, and the distributed power supply is connected from the lowest voltage node of the distribution network, which can raise the voltage of the accessed point and slow down the tidal current movement on the feeder, reducing the net loss to some extent. Since the results are better than other algorithms from the beginning, the convergence speed will be faster during the next optimal solution fine-tuning strategy.
Table 1 reveals that the three algorithms exhibit similar iteration accuracy, yet the enhanced PSO optimization algorithm presented in this paper demonstrates superior optimization accuracy. Regarding optimization efficiency, this algorithm achieves an average of 71 iterations, while the other two algorithms require 131 and 175 iterations. The improved algorithm in this paper exhibits the lowest number of iterations. Upon conducting 100 runs for each of the three algorithms, the algorithm proposed in this paper showcases the highest optimization efficiency, the shortest average time consumption, and superior optimization accuracy and efficiency.
- (1)
Network loss impact: the proposed algorithm significantly reduces network losses in the IEEE 33 node distribution network model, surpassing other state-of-the-art algorithms
- (2)
Node voltage impact: the proposed algorithm effectively improves node voltage levels, leading to enhanced system voltage magnitude
- (3)
Comparative analysis of algorithm effect: the proposed algorithm achieves the smallest network loss value compared to other algorithms. It also demonstrates superior optimization accuracy and efficiency with the fewest iterations required
The proposed algorithm exhibits clear superiority in terms of network loss reduction, node voltage improvement, optimization accuracy, convergence speed, and time consumption. These findings validate its effectiveness and competitiveness in optimizing the dynamic economic dispatch of renewable energy sources.
The proposed algorithm addresses the variability of renewable energy sources, such as wind and solar power, through dynamic economic dispatch strategies. It incorporates real-time optimization and forecasting techniques to account for the uncertain and fluctuating nature of these energy sources. By optimizing the scheduling and allocation of power generation, the algorithm effectively utilizes renewable energy while meeting load requirements. It adjusts power generation levels based on real-time measurements and feedback, ensuring efficient integration into the power grid. The proposed algorithm enables the effective utilization of renewable energy and reduces reliance on conventional sources.
4. Conclusion
This paper presents a multistrategy fusion-improved particle swarm algorithm for grid-connected optimization in distributed renewable energy systems. The algorithm focuses on minimizing network losses and enhancing node voltage stability, providing significant scientific value and practical applicability. By integrating the convergence strategy of the midperpendicular algorithm and the optimal particle explosion strategy, the algorithm achieves faster convergence with maintained accuracy. Simulation results demonstrate its effectiveness in reducing active power loss and voltage fluctuation, thereby improving power quality in distribution networks. Comparative analysis against traditional optimization algorithms verifies its superior performance in power loss reduction and voltage distribution. This study addresses specific optimization challenges in distributed renewable energy systems, showcasing its novelty. The extended application of this approach to systems incorporating renewable energy sources contributes to sustainable energy management. Additionally, the algorithm’s applicability in dynamic pricing for energy markets, considering environmental factors, presents new opportunities for efficient and ecofriendly energy systems. While the study demonstrates promising results, it is important to acknowledge limitations and potential challenges. Further investigation is needed to address scalability, parameter tuning, and handling the dynamic nature of renewable energy sources. Resolving these challenges will enhance the real-world implementation of the proposed algorithm.
Conflicts of Interest
The authors declare that there are no conflicts of interest.
Authors’ Contributions
Feng Wu contributed to the writing of the manuscript and data analysis. Yueying Li supervised the work and designed the study. All the authors have read and agreed the final version to be published.
Acknowledgments
This work is supported by the Xinyang Agriculture and Forestry University.
Open Research
Data Availability
The labeled data set used to support the findings of this study is available from the corresponding author upon request.


