The Influence of Coal Lithotype and Metamorphism on the Development Characteristics of Pore and Fracture in Coalbed Methane Reservoir in Ordos Basin and Qinshui Basin
Abstract
To study the characteristics of pores and fractures development in coalbed methane reservoir controlled by coal lithotype and metamorphism, a total of 26 coals from 16 coal mines in the Ordos Basin and Qinshui Basin were tested for kerogenic components, scanning electron microscopy, mercury intrusion experiments, low-temperature nitrogen adsorption experiments, and Fourier transform infrared spectroscopy, which summarized and analyzed the coal lithotype and metamorphism constraints on the development of pores and fractures and came to the following conclusions: At the early stage of coalification, with the aliphatic hydrocarbon chains in coals are gradually shortened, and the branched chains and oxygen-containing functional groups are continuously shed and reduced, resulting in asphaltenes filling the pores, which leads to an overall decrease in the porosity of coal and an increase in the inhomogeneity of the pore structure; at the transition stage of coals to high maturity, asphaltenes in coal are gradually reduced, the filling effect is reduced, aromatic lamellae are continuously oriented, and aromatic rings are continuously condensed. In the transition stage of coal to high maturity, the filling effect decreases, the aromatic lamellae keep orienting and arranging, and the aromatic rings keep condensing, which makes the porosity, pore volume, and specific surface area of coal rebound, and the nonhomogeneity of pore structure weakens; the density of microfracture decreases with the increase of coal rank, which may be the effect of compaction and asphaltene effect; the mirror group in coal is favorable to the development of pore fracture, while the inert group is opposite; the density of microfracture is positively correlated with the content of vitrite and vitrinertite, and negatively correlated with the content of inertite. The higher the content, especially the content of microscopic coal, the more developed the microfractures.
1. Introduction
Coalbed methane (CBM) reservoirs are characterized by low permeability, low porosity, low gas saturation, and nonhomogeneity, which leads to their difficult exploitation and difficult resource utilization, and it is important to carry out research on the pore and fracture development of CBM reservoirs [1, 2]. Microfracture is a bridge between pore space and macrofracture, and the degree of pore-fracture development directly affects permeability, stress response, and CBM recoverability [3]. Based on the qualitative study of the structural morphology of pores and fractures in CBM reservoirs, quantitative characterization of pores and fractures and the factors controlling them have always been the focus of research [4, 5, 6].
Fine modeling characterization of CBM reservoirs is based on the analysis of pores and fractures [7]. For CBM reservoir pores, quantitative characterization techniques and analysis methods are currently well developed and there are three main types, namely fluid injection, nonfluid injection, and image analysis. Developmental patterns can be nondestructively characterized by methods including small-angle neutron scattering [8], mercury intrusion [9], nuclear magnetic resonance [10], and low-temperature liquid nitrogen adsorption [11]. In practice, a combination of methods is often used for comparison. The microstructure of pore cleavage can be observed and described more intuitively using image analysis [12]. This method can characterize and analyze microfractures at the micron level and pore structures at the nanometer level. Currently, the commonly used experimental methods include optical microscopy [13], high-resolution electron microscopy [14], scanning electron microscopy test (SEM) [15], X-ray CT scanning (X-ray CT) [16], and atomic force microscopy test [17].
Characterization of coal petrography is one of the most direct and reliable indicators of coal genesis. In the case of a similar degree of coal metamorphism, there is a significant decrease in the development of cleavage in coal from bright coal, semibright coal to semidark coal to dark coal, which is greatly related to the secularity group score [18]. A certain relationship exists between the microscopic composition of coal and the pore development of coal. With the increase of the content of vitrinite, the pore development showed an increasing trend; on the contrary, the pore development decreased with the increase of the content of the inert group [19]. With the increase of metamorphism degree, the porosity of coal shows a fluctuating change of increasing first, then decreasing and then slightly increasing; the percentage of microporosity changes obviously with the increase of reflectivity of the specular group of coal, while the percentage of small porosity changes in the opposite way [20]. Shi et al.’s [21] experimental studies showed that the pore volume and specific surface area varied with increasing temperature and pressure. Jiang et al. [22] studied the thermal metamorphism of intrusions on CBM reservoir of low-rank bituminous coal and analyzed the effect on porosity. Fractures are less affected by coal rank, and it is pointed out that anthracite has better mechanical properties, is not easy to deform, and may produce fewer fractures [23]. Gan et al. [24] investigated the effect of heating temperature on the strength, pore, and fracture structure of briquette coals. Mukherjee et al. [25] illustrated the relationship between in situ stress and coal fracture orientations in the current stress state. Zhang et al. [26] directly analyze the dependency of fracture aperture, porosity, and connectivity on effective stress. The current research on cracks and pores mainly focuses on the influence mechanism of external factors, and there are fewer studies on the influence of coal petrography. In this paper, we selected coals from Ordos Basin and Qingshui Basin, and comprehensively and systematically studied the mechanism of constraints on pore and fracture development in CBM reservoirs by using field emission scanning electron microscope (FESEM), fluorescence microscopy observation, mercury intrusion, low-temperature liquid nitrogen adsorption, and Fourier infrared spectroscopy.
2. Sample Collection and Experimental Methods
The samples were obtained from the No. 6 coal of the Jungar Coalfield in the Northeastern Ordos Basin and the No. 2–15 coal of the Qingshui Basin. In general, the Qinshui Basin samples exhibit a high Ro,max. Extensive sampling was conducted in order to fulfill the study’s requirement for continuous and sufficient Ro,max values. The Jungar Coal Field is situated in the Ordos region of Southwestern Inner Mongolia. Its geotectonic location is at the northeastern edge of the Ordos Basin, and its coal seams are dominated by the Taiyuan Group of the Upper Carboniferous System and the Shanxi Group of the Lower Permian System [27]. The No. 6 coal seam is the most evenly distributed in the region, gradually thinning to the south. It is the coal seam sampled in this study [28, 29]. The coal-bearing strata in the Qinshui Basin are mainly endowed with the Carboniferous–Permian Benxi Formation, Taiyuan Formation, and Shanxi Formation [16]. The thickness of the Benxi Formation ranges from 0 to 60 m and is thick in the north and in the middle and thin in the south [30]. The stratigraphy of the Taiyuan Formation is continuously deposited above the Benxi Formation, and the lithology mainly consists of dark gray limestone, mud shale, siltstone, and coal seams [31]. The lithology of the Shanxi Formation is mainly composed of sandstone, mud shale, and coal beds. The thickness of the strata ranges from 20 to 120 m, with a general trend of thicker in the south and thinner in the north [22, 32]. There are two to seven layers of coal-bearing strata developed, of which No. 3 coal is the main coal seam. In order to investigate the coal lithological constraint mechanism of coal reservoir pore and fissure development, samples of multilayered coal seams in the Qingshui Basin were selected for experimental study. These samples contain different coal steps of low, middle, and high order.
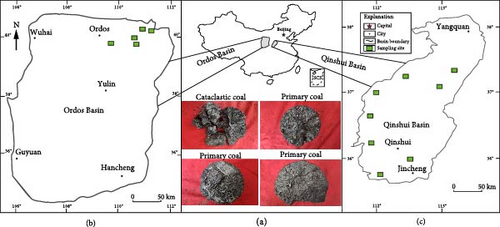
The 26 selected samples in this paper were taken from Ordos Basin and Qingshui Basin, as shown in Figure 1. The maximum reflectance Ro,max of the specular group, and the microfraction of coal were measured according to GB/T 6948-2008 [33] standard. The mercury intrusion test was carried out according to the oil and gas industry standard (SY/T 5346-1994) [34]. Twelve coals were analyzed with low-temperature liquid nitrogen adsorption.
The selected experimental samples were prepared as experimental coals with a particle size of 200 mesh and dried. After that, the experimental coals were ground and mixed in an agate mortar at a mass ratio of 1 : 180, and made into thin slices on a tablet press, put into an infrared spectrometer for testing, with the instrument wave number range set at 4,000–400 cm−1, scanning the sample 32 times, and the resolution of the instrument was 4 cm−1. The test samples were polished to make 30 mm × 30 mm coal light slices, divided into nine microzones of 10 × 10 mm2 under a 50x fluorescence microscope, and the fractures appearing in each microzone were classified and counted according to the classification method [35]. The basic information and microfraction determination of coals are shown in Table 1.
| Sampling basin | Sample number | Ro,max (%) |
Microcomponent content (%) | |||
|---|---|---|---|---|---|---|
| Vitrinite | Inertinite | Exinite | Minerals | |||
| Ordos Basin | L1 | 0.44 | 76.7 | 13.5 | 9.5 | 0.3 |
| L2 | 0.46 | 74.5 | 10.6 | 12.4 | 2.5 | |
| L3 | 0.56 | 65.2 | 16.3 | 18.2 | 0.3 | |
| L4 | 0.59 | 57.7 | 25.8 | 16.2 | 0.3 | |
| L5 | 0.61 | 71.5 | 23.3 | 5 | 0.2 | |
| L6 | 0.63 | 82.3 | 15 | 2.2 | 0.5 | |
| L7 | 0.64 | 78 | 14.7 | 4.5 | 2.8 | |
| L8 | 0.66 | 70 | 23 | 4.6 | 2.4 | |
| Qinshui Basin | M1 | 1.12 | 62.9 | 31.6 | 2.3 | 3.2 |
| M2 | 1.2 | 56.4 | 34.3 | 7.7 | 1.6 | |
| M3 | 1.25 | 83.1 | 15.3 | 1 | 0.6 | |
| M4 | 1.3 | 68.9 | 28 | 2.2 | 0.9 | |
| M5 | 1.38 | 85 | 12.4 | 0 | 2.6 | |
| M6 | 1.42 | 80.2 | 15.9 | 1.6 | 2.3 | |
| M7 | 1.43 | 75.5 | 21 | 2.4 | 1.1 | |
| M8 | 1.44 | 68 | 29.6 | 0 | 2.4 | |
| M9 | 1.48 | 71.7 | 25.5 | 0 | 4.8 | |
| M10 | 1.48 | 70.4 | 21.3 | 3.1 | 5.2 | |
| M11 | 1.56 | 69 | 24.6 | 3 | 3.4 | |
| M12 | 1.59 | 88.5 | 9.4 | 0 | 2.1 | |
| M13 | 1.75 | 67.1 | 32.8 | 0 | 0.1 | |
| M14 | 1.89 | 51.9 | 40.7 | 5.3 | 2.1 | |
| H1 | 2.26 | 72.7 | 24.4 | 1.2 | 1.7 | |
| H2 | 2.28 | 67.6 | 24.9 | 5.3 | 2.2 | |
| H3 | 2.56 | 68.9 | 28.6 | 0 | 2.5 | |
| H4 | 2.99 | 78.9 | 18.3 | 0 | 2.8 | |
3. Methodology
3.1. Scanning Electron Microscope Observation
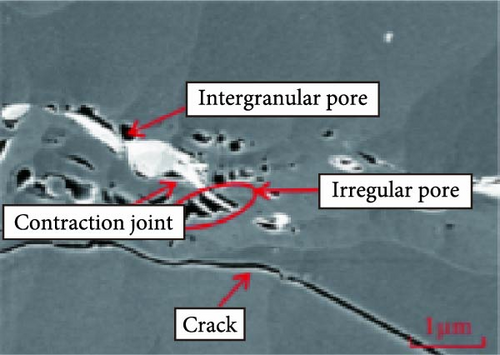
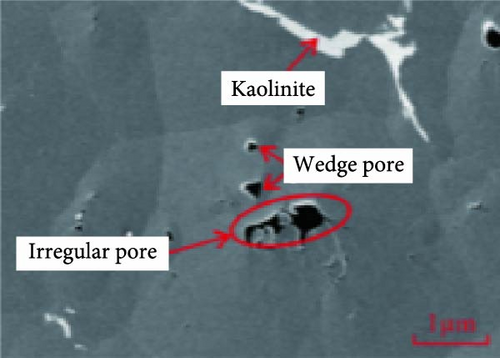
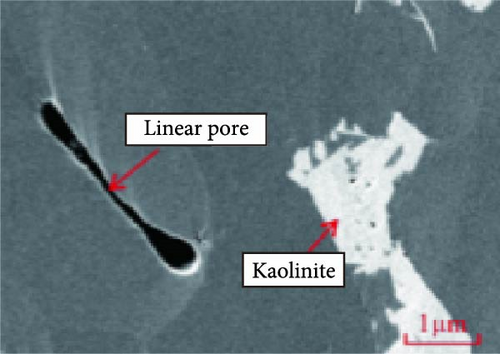
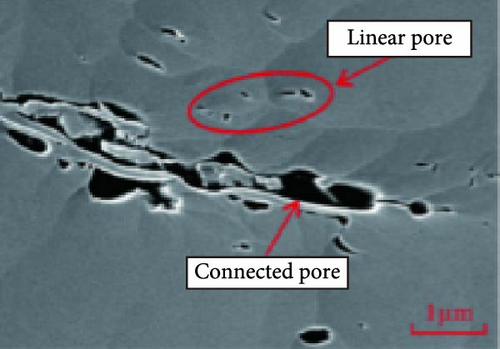
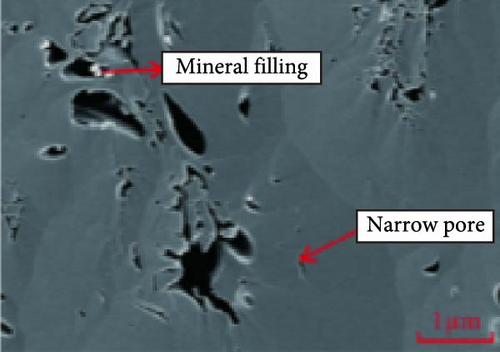
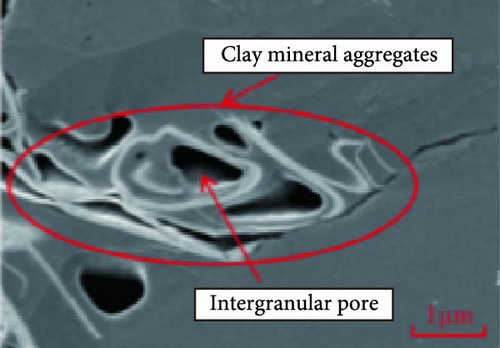
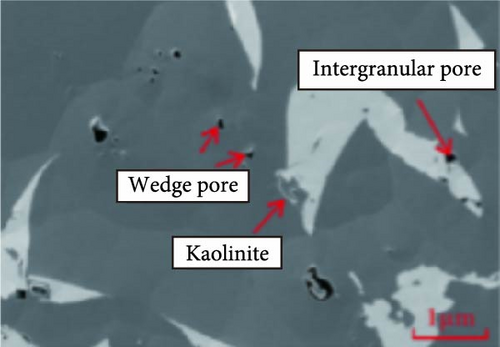
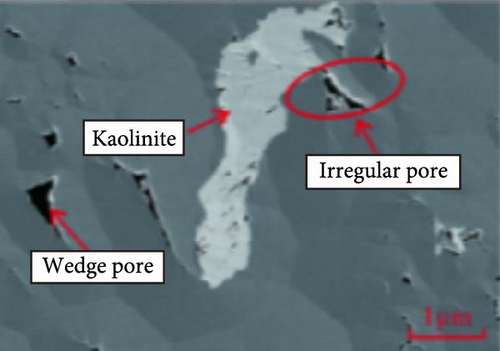
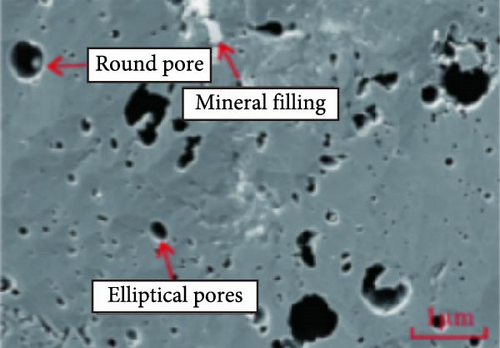
The FESEM images of coals of different rank coals are shown in Figure 2. The detector collects secondary electrical signals, converts them into electrical signals, and amplifies them. These signals are sent to the gate of the picture tube to create a secondary electronic image that reflects the surface morphology of the coal sample. For the low- and middle-rank coals, in the early stage of coal formation, a large number of round pores formed by the decomposition of organic matter in the coal seam to produce gas, and then compressed by the formation pressure into irregular pores such as oval- and wedge-shaped pores, with low connectivity, visible shrinkage slits and cracks, and kaolinite filling in some pores [36]. As the coal rank rises, connected pores appear in the FESEM images, irregular pores such as short linear pores, slit-type pores, and wedge-shaped pores are visible, and clay minerals such as kaolinite and illite are visible in a few pores [37]. With the further increase of coal evolution, a large number of metamorphic pores appear in the highly metamorphosed coals, with pore sizes ranging from about 50 to 100 nm. The coal matrix is deformed under the influence of geostress, and then a large number of connected pores appear, and more pores are filled with minerals such as pyrite and kaolinite. The inter- and intra-grain pores developed in the coals are usually small, with pore sizes ranging from 5 to 20 nm. The intergranular pores are commonly found between the coal matrix and mineral fillings or mineral grains.
3.2. Mercury Intrusion Experimental Characterization
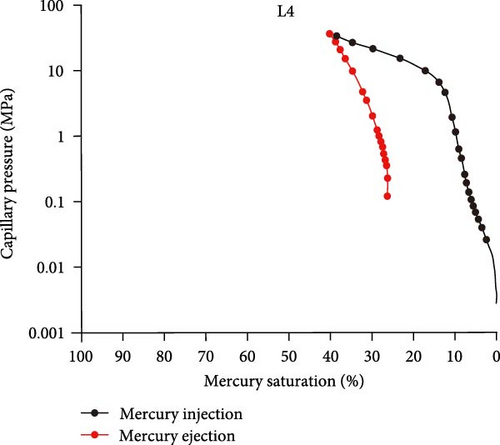
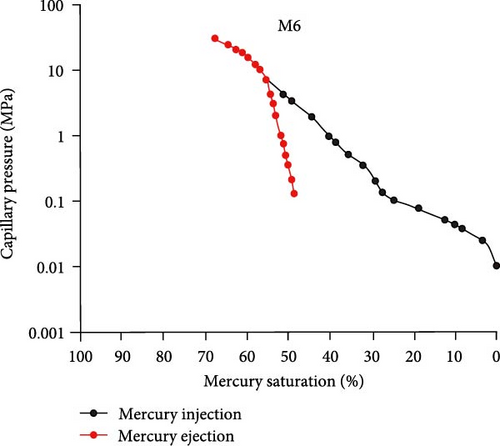
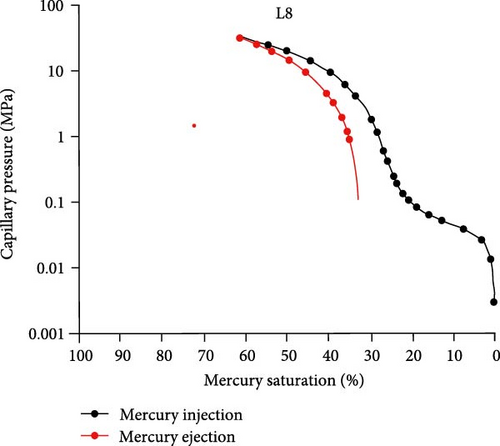
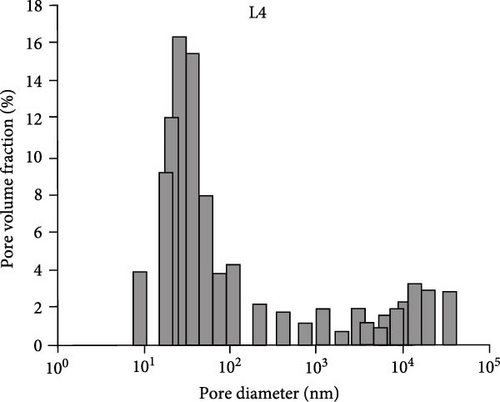
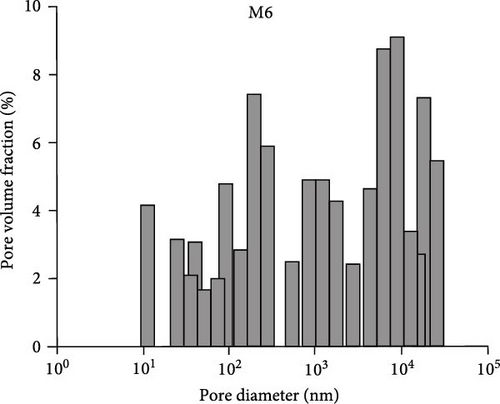
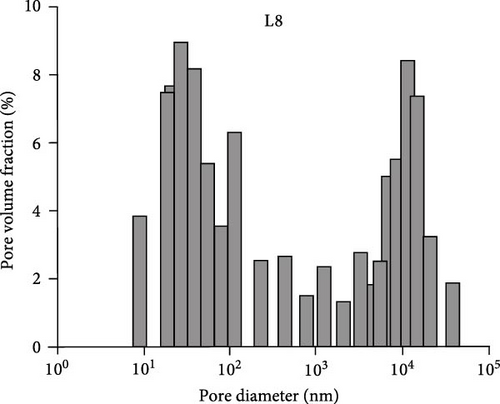
The mercury intrusion data of the 26 coals in this experiment are shown in Table 2. In the mercury intrusion experiments of coal, the different patterns of inlet and outlet curves characterize the variability of characteristics in the connectivity of the pore throat of the CBM reservoir and the pore size distribution [9]. Based on the statistical analysis of the mercury intrusion curves, the mercury intrusion curves of the coals in this study can be divided into three categories, as shown in Figure 3.
| Coals number | Porosity (%) |
Mercury saturation (%) |
Mercury removal efficiency (%) |
Pore volume ratio of different pore size sections (%) |
||
|---|---|---|---|---|---|---|
| <102 nm | 102−103 nm | > 103 nm | ||||
| L1 | 18.3 | 71.43 | 60.73 | 34.68 | 54.54 | 10.78 |
| L2 | 14.8 | 53.51 | 19.44 | 31.99 | 24.80 | 43.21 |
| L3 | 18 | 65.97 | 52.51 | 47.16 | 42.55 | 10.29 |
| L4 | 13.2 | 40.12 | 34.22 | 69.12 | 9.32 | 21.56 |
| L5 | 13.4 | 41.82 | 34.91 | 59.68 | 11.48 | 28.84 |
| L6 | 9.4 | 26.47 | 48.77 | 55.38 | 8.65 | 35.97 |
| L7 | 5.5 | 50.76 | 68.87 | 41.75 | 17.40 | 40.86 |
| L8 | 2.9 | 61.39 | 46.34 | 45.09 | 12.92 | 41.99 |
| M1 | 6.4 | 36.30 | 46.60 | 33.23 | 45.16 | 21.62 |
| M2 | 5.1 | 44.06 | 46.35 | 57.96 | 31.94 | 10.09 |
| M3 | 5.4 | 38.83 | 43.80 | 30.52 | 33.53 | 35.95 |
| M4 | 3 | 36.50 | 60.68 | 37.21 | 30.60 | 32.19 |
| M5 | 9.3 | 39.54 | 27.86 | 37.75 | 38.76 | 23.49 |
| M6 | 4.7 | 67.58 | 28.18 | 19.18 | 28.13 | 52.69 |
| M7 | 6.8 | 37.55 | 27.67 | 47.83 | 40.63 | 11.53 |
| M8 | 1.7 | 21.87 | 65.04 | 44.55 | 28.86 | 26.60 |
| M9 | 6.8 | 22.24 | 50.52 | 32.57 | 36.53 | 30.90 |
| M10 | 7.3 | 30.50 | 38.94 | 24.93 | 23.44 | 51.63 |
| M11 | 3.5 | 27.33 | 75.44 | 48.11 | 38.92 | 12.97 |
| M12 | 6.3 | 31.96 | 44.53 | 37.21 | 41.16 | 21.62 |
| M13 | 3.2 | 26.42 | 68.91 | 53.15 | 21.06 | 25.78 |
| M14 | 2.2 | 40.82 | 74.27 | 45.91 | 24.00 | 30.09 |
| H1 | 2.6 | 43.87 | 59.05 | 51.45 | 30.72 | 17.83 |
| H2 | 1.3 | 85.99 | 58.82 | 48.99 | 27.18 | 23.82 |
| H3 | 1.7 | 50.50 | 78.41 | 56.87 | 23.41 | 19.72 |
| H4 | 1.9 | 46.42 | 64.45 | 52.80 | 20.44 | 26.77 |
The Class I curve takes coals L4 as an example, and its mercury feed curve can be divided into two stages, i.e., the mercury feed saturation grows slowly and the curve is steep during the pressure increase from 0 to 10 MPa; when the pressure exceeds 10 MPa, the mercury intrusion is relatively stable, and the mercury feed curve is relatively flat. The high efficiency of mercury withdrawal indicates that the pore connectivity is good. The content of micropores in these coals is much larger than that of mesopores and macropores, and the pore size shows a single-peak distribution, with a peak at about 20 nm pore size, and the mesopore and macropores are more uniform.
Type II curve takes coals M6 as an example, and its mercury feed curve can be divided into two stages, namely: the mercury feed saturation increases rapidly during the process of pressure increase from 0 to 10 MPa, and the curve is relatively flat; when the capillary pressure exceeds 0.1 MPa, the mercury feed rate slows down relatively than before, and the mercury feed curve becomes a sloping line. The high saturation of incoming mercury but the low efficiency of receding mercury indicates that the pore connectivity is poor. The mesopore and macropores of these coals are more developed, and the content of micropores is smaller than that of mesopore and macropores, and the pore size shows a multipeak distribution, with peaks at about 0.2 and 6 μm
The mercury feed curve of coals L8 shows a four-stage distribution, and when the pressure is less than 0.05 MPa, the mercury feed curve is nearly straight, and mercury can hardly enter the sample, and the saturation of the mercury feed is only about 3%; as the pressure increases to 0.1 MPa, the mercury feed curve is more gentle, and the mercury feed is stable, and the cumulative mercury feed saturation is generally about 20%. In the process of increasing the pressure to 10 MPa, the mercury feed curve becomes steep again and the mercury feed is slow; when the pressure is higher than 10 MPa, the curve becomes flat again and the mercury feed saturation increases rapidly. It can be seen that the pore structure of this type of curve coals is not uniform with multipeak distribution, micropore and macropores are more developed, while mesopores are relatively undeveloped, and its mercury receding efficiency is about 46.34%, which indicates that the connectivity between pores is average.
| Sample number | Seepage hole fitting results (d > 0.1 μm) | Adsorption pore fitting results (d < 0.1 μm) | ||||
|---|---|---|---|---|---|---|
| Slope | D1 | R2 | Slope | D2 | R2 | |
| L1 | −0.08 | 2.92 | 0.96 | −0.25 | 2.75 | 0.99 |
| L2 | −0.07 | 2.93 | 0.90 | −0.16 | 2.84 | 0.99 |
| L3 | −0.08 | 2.92 | 0.96 | −0.21 | 2.79 | 0.97 |
| L4 | −0.06 | 2.94 | 0.61 | −0.23 | 2.77 | 0.98 |
| L5 | −0.03 | 2.97 | 0.94 | −0.36 | 2.64 | 0.94 |
| L6 | −0.06 | 2.94 | 0.96 | −0.28 | 2.72 | 0.99 |
| L7 | −0.06 | 2.94 | 0.98 | −0.37 | 2.63 | 0.99 |
| L8 | −0.05 | 2.95 | 0.88 | −0.12 | 2.88 | 0.99 |
| M1 | −0.03 | 2.97 | 0.85 | −0.24 | 2.76 | 0.99 |
| M2 | −0.05 | 2.95 | 0.98 | −0.13 | 2.87 | 0.98 |
| M3 | −0.04 | 2.96 | 0.97 | −0.14 | 2.86 | 0.96 |
| M4 | −0.04 | 2.96 | 0.92 | −0.14 | 2.86 | 0.99 |
| M5 | −0.12 | 2.88 | 0.99 | −0.23 | 2.77 | 0.96 |
| M6 | −0.02 | 2.98 | 0.98 | −0.06 | 2.94 | 0.96 |
| M7 | −0.03 | 2.97 | 0.82 | −0.17 | 2.83 | 0.99 |
| M8 | −0.03 | 2.97 | 0.95 | −0.06 | 2.94 | 0.98 |
| M9 | −0.05 | 2.95 | 0.95 | −0.07 | 2.93 | 0.97 |
| M10 | −0.02 | 2.98 | 0.73 | −0.11 | 2.89 | 0.96 |
| M11 | −0.04 | 2.96 | 0.90 | −0.11 | 2.89 | 0.98 |
| M12 | −0.02 | 2.98 | 0.93 | −0.13 | 2.87 | 0.97 |
| M13 | −0.04 | 2.96 | 0.98 | −0.20 | 2.80 | 0.96 |
| M14 | −0.01 | 2.99 | 0.95 | −0.08 | 2.92 | 0.98 |
| H1 | −0.04 | 2.96 | 0.92 | −0.24 | 2.76 | 0.96 |
| H2 | −0.10 | 2.90 | 0.96 | −0.95 | 2.05 | 0.88 |
| H3 | −0.04 | 2.96 | 0.97 | −0.32 | 2.68 | 0.95 |
| H4 | −0.04 | 2.96 | 0.98 | −0.27 | 2.73 | 0.95 |
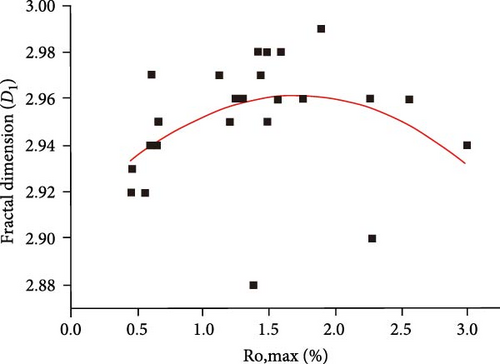
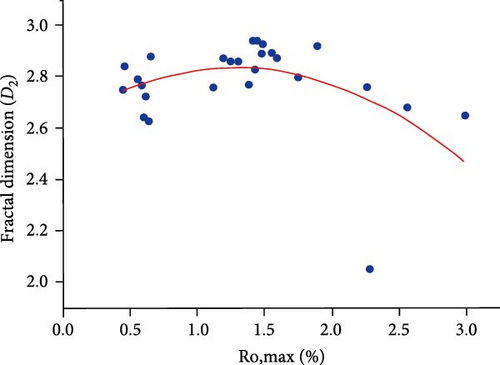
As shown in Figure 4, the fractal dimension D1 and D2 measured by mercury intrusion tends to increase and then decrease with the deepening of metamorphism. The primary pores in the coal at low maturity are more regular, but with the increase of coal rank, the compaction of the strata is enhanced, which makes the primary pores compressed into irregular pores such as oval and wedge shape, and the hydrocarbon generation produces a large amount of gas, which leads to the development of some pores in the coal and increases the complexity of coal pore structure; and with the further coalification, the development of a large number of metamorphic pores makes the pore fracture morphology gradually tend to round and oval. Thus, the nonhomogeneity of pore morphology tends to decrease.
3.3. Characterization of Low-Temperature Liquid Nitrogen Adsorption Experiments
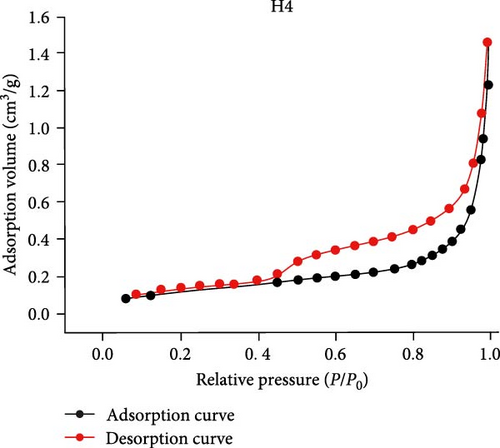
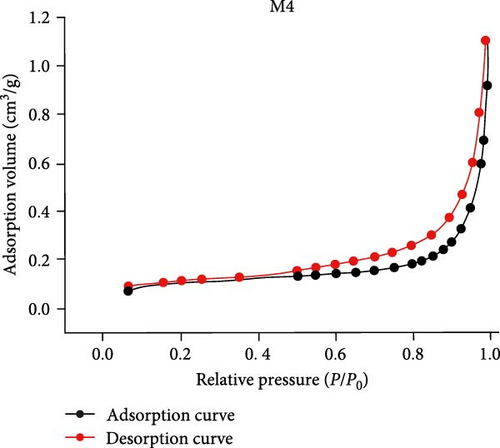
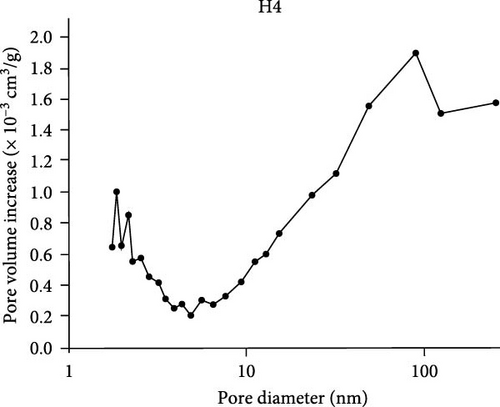
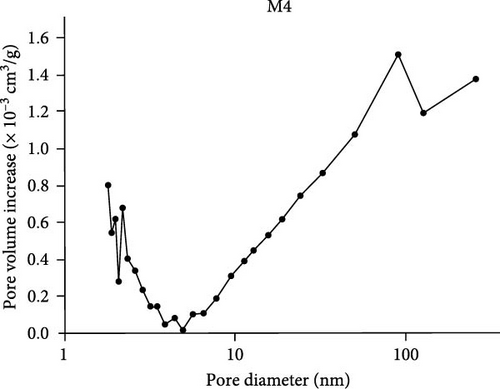
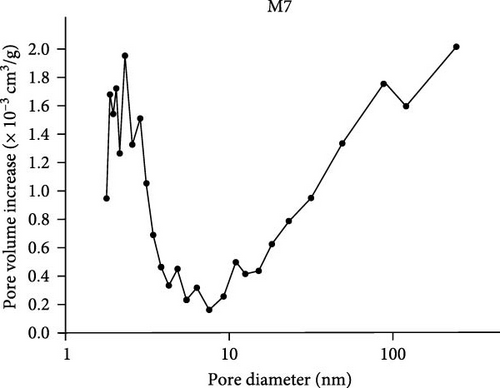
A total of 12 samples were selected for low-temperature nitrogen adsorption experiments in this study, and the results are shown in Figure 5. The samples were classified into three categories by statistical analysis of the morphological differences in the adsorption/desorption curves as follows [39, 40, 41]: the adsorption curve of Class I sample with H4 shows an obvious inflection point at about P/Po = 0.5. The pore morphology corresponding to such curve is generally of fine-necked bottle type or ink bottle type, and the pore structure of this type has a bimodal distribution with peak pore volume appearing at 2 and 90 nm. This type of pore structure is good for adsorption and storage of CBM, but not good for desorption of CBM [42]. The pore structure of the coals with M4 shows a nonobvious inflection point at P/P0 = 0.5, and the pore morphology of the coals with such adsorption/desorption curves is mainly slit-type pores and parallel plate-like pores closed at one end. This type of pore structure is not conducive to the adsorption and storage of CBM but beneficial to the desorption of CBM. The desorption curve and the adsorption line are always parallel or even overlapping with each other, and there is no hysteresis loop phenomenon between them. The pore morphology of such adsorption/desorption curves is mostly cylindrical pores with one end open or both ends open, and this type of coals shows a bimodal pore structure with the peak of its pore volume appearing at 2 and 110 nm, and this type of pore structure is favorable to the desorption of CBM.

4. Results and Discussion
4.1. Microfractures
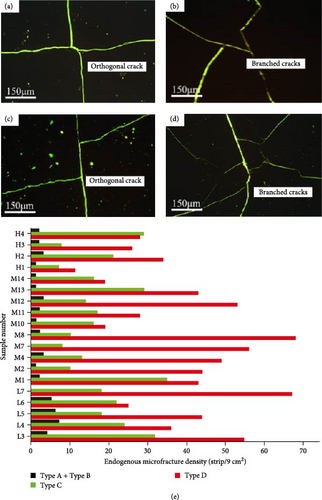
Twenty-six coal samples with varying degrees of metamorphism were selected for this study. The instrumentation employed was a LABORLXE 12 POL fluorescence microscope, equipped with a MPS60-type photographic system manufactured by the German Leitz company. The test samples were sliced, ground, and polished to create 30 × 30 mm2 coal-thin sections. These were then divided into nine microzones of 10 × 10 mm2 under the fluorescence microscope at 50x magnification. The fissures appearing in each microzone were counted separately. According to the statistical results of microfractures in coal and microscopic morphology observation, it is found that the overall microfractures of the selected samples are less developed, among which most of them are mainly endogenous fractures and less exogenous fractures are developed. The samples with more developed exogenous fractures have relatively high total density of microfractures. The percentage of A-type and B-type microfractures in the coals is very low and almost not developed, and the microfractures are mainly C-type and D-type [43].
4.1.1. Endogenous Fractures
Regarding the hypothesis of the genesis of endogenous fractures, scholars have put forward different views. The “matrix shrinkage” hypothesis suggests that the gelatinous compounds in coal are affected by temperature and pressure during the coalification process, which causes the uniform contraction of CBM reservoir volume due to dehydration and differential compaction, resulting in the formation of endogenous fractures [44, 45]; the “fluid-driven” hypothesis proposes that the main cause of endogenous fractures is the large amount of fluid generated during coal metamorphism and the fluid pressure generated during the warming process [46, 47]. Both hypotheses can only form microfractures similar to “mud fractures,” while the microfractures that develop directionally and extend farther are mainly controlled by the deep compaction of the coal seam. Several researchers have proposed the “gas accumulation–volume expansion–rupture” hypothesis, pointing out that the production, massive accumulation, and emission of hydrocarbon gases during the coalification process are the main reasons for the component selectivity of microfracture development [48, 49].
Through microscopic observation shown in Figure 6, it was found that samples L3, L4, L5, L6, and L7 from the Ordos Basin and samples M1, M2, M4, M7, M8, M10, M11, M12, M13, M14, H1, H2, H3, and H4 from the Qinshui Basin were mainly developed with endogenous fractures, among which type A fractures were almost undeveloped, with a maximum of two fractures/9 cm2, type B microfractures were less developed, with 0–5 fractures/9 cm2, and types C and D fractures are more developed, accounting for more than 95%. The directionality of endogenous clefts was good, and their morphology was mostly X-intersecting, orthogonal, and dendritic.
4.1.2. Exogenous Fracture Characteristics
The formation mechanism of exogenous fractures is relatively simple, and they are fractures produced by the action of tectonic stress on coal [50, 51]. Its characteristics are as follows: (1) The development is not limited by the type of coal and can cut through several coal partings. (2) It intersects the coal seam laminae obliquely at various angles. (3) There are often wave-like and feather-like rubs on the fracture surface. (4) The exogenous fractures sometimes occur along the overlapping of the endogenous fractures.
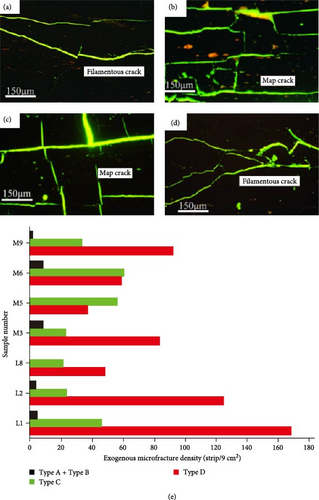
Microscopic observation shows that the exogenous fractures were more developed in samples L1, L2, and L8 from the Ordos Basin and samples M3, M5, M6, and M9 from the Qinshui Basin, among which types A and B fractures were almost undeveloped, type C microfractures were more developed, and type D microfractures were most dominant, as shown in Figure 7. The exogenous fractures are mostly filamentous, irregularly reticulated, patterned, and broken under fluorescence microscopy, which usually destroy or penetrate the microscopic components of the coal, and sometimes the exogenous fractures cut through the endogenous fractures, making the connectivity between microfractures increase. Combined with the analysis of the development mode of microcracks in different coal samples, it includes two development bodies of endogenous fractures and exogenous fractures. However, both patterns of fractures are mainly concentrated in C-type and D-type development. This indicates that in the region with relatively gentle tectonics, relative to the tectonic control of microfracture development. The coal rock properties of different coal samples have a more important role in the selective development of fractures. Factors including coalification and microscopic components may directly control the number and main types of fracture development. Therefore, it is also necessary to investigate the intrinsic control factors of fractures in coal reservoirs.
4.2. Microstructure Analysis of Coals
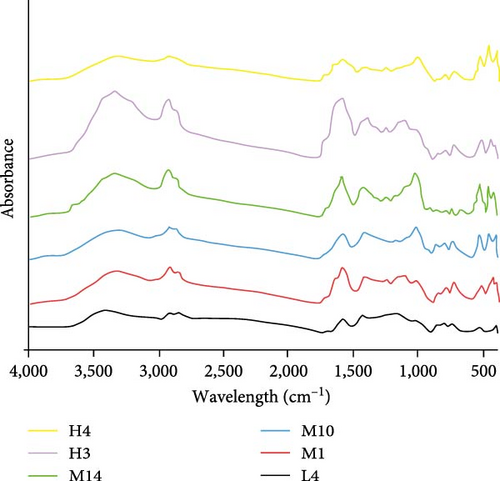
In order to study the changes of microstructure in coals of different coal grades, the Fourier transform infrared spectroscopy (FTIR) experiment was used in this study to analyze the coals of different coal grades [52, 53]. A number of coal samples were selected for the purposes of this study, namely L4, M1, M10, M14, H3, and H4. The selected samples were then subjected to a series of processing steps, including crushing, grinding, sieving, and the preparation of a coal powder with a particle size of 200 mesh. This powder was then dried for a period of 24 hr. Subsequently, the experimental coal samples and the KBr were combined in an onyx mortar in a 1 : 180 ratio, ground and mixed thoroughly, and then placed in molds to be made into thin slices in a tablet press. Finally, the samples were then subjected to infrared spectroscopy, with the wave number range of the instrument set from 4,000 to 400 cm−1. The samples were scanned 32 times with a resolution of 4 cm−1. The comparative infrared spectra of the six coals after baseline correction are shown in Figure 8. The positions of the characteristic adsorption peaks of the spectra of all coals appear similar, but there are differences between the intensities and ratios of the characteristic adsorption peaks of each infrared spectrum.
- (1)
I1: A(CH3)/A(CH2), the length and degree of branched fat chains in coal.
- (2)
I2: A(CHar)/A(C = C), the degree of polymerization of aromatic rings in coal.
- (3)
I3: A(CHar)/A(CHal), the relative content of aromatic and aliphatic hydrocarbons in coal.
- (4)
I4: A(C − O)/A(C = C), the relative content of oxygen-containing functional groups in coal.
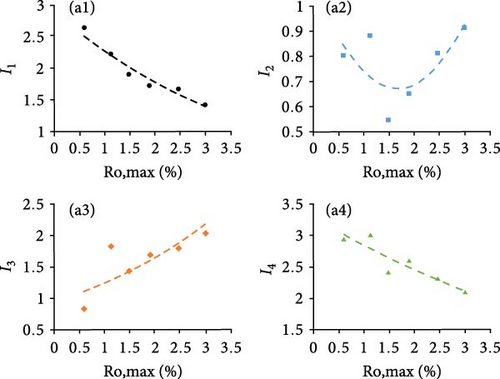
Figure 9 shows the variation patterns of the four FTIR structural parameters with Ro,max. The parameter I1 decreases with the increase of the degree of deterioration of the coals, which indicates that the aliphatic hydrocarbon chains in the coals are gradually shortened, and the branched chains are continuously shed during the deterioration process. The parameter I2 generally shows a U-shaped trend with the deepening of metamorphism. After the start of the first coalification leap, the aromatic lamellae in the coal start to transform from loose state to orderly arrangement, but the effect of aromatic ring polymerization is not significant at this time, therefore the value of I2 decreases; as the metamorphism proceeds further, the aromatic lamellae are arranged in a directional manner, the aromatic rings are continuously polymerized, the degree of aromatic ring condensation increases, and the parameter I2 increases. The parameter I3 generally increases with the increase of coal rank. With the occurrence of coalification, the aliphatic side chains in the coal are shed and condensed, and the degree of aromatic ring polymerization is increasing, the aromaticity of the coals is enhanced, with the increase in parameter I3. The parameter I4 generally showed a negative trend with the degree of coal metamorphism, reflecting that the rate of shedding of its C═C bonds was lower than that of shedding of oxygen-containing functional groups in the process of coal metamorphism, and the content of oxygen-containing functional groups gradually decreased.
4.3. Coal Petrographic Constraints on the Evolution of Pore and Fracture Structure
4.3.1. The Control of Pore Development by Coalification
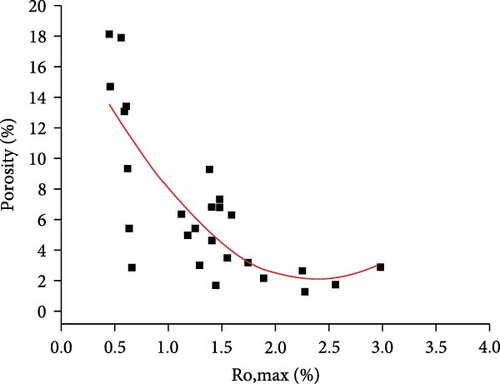
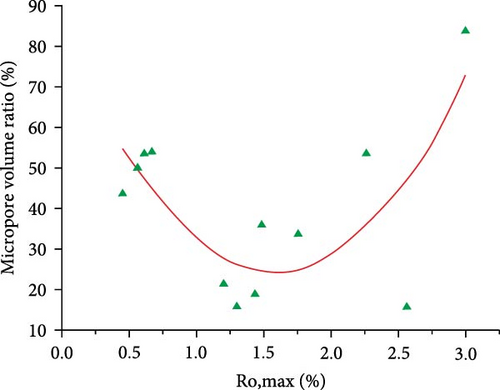
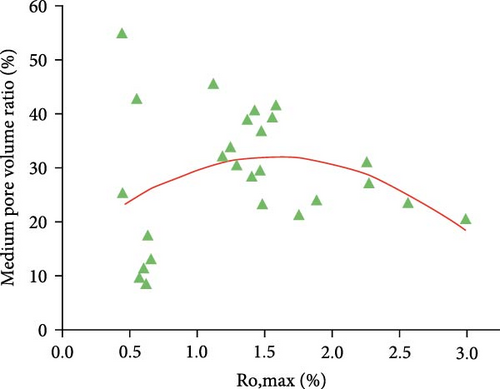
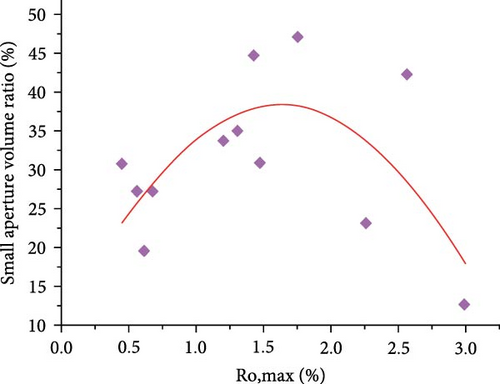
The piezometric data of 26 coals with different degrees of metamorphism in this study were statistically analyzed, and it was found that the porosity of CBM reservoirs showed a high–low–high variation trend with the increase of specular body reflectivity, which is consistent with the previous findings [1]. The variation of each pore size section of the coals is shown in Figure 10, with the coalification, the micropore and mesopores show an increasing and then decreasing trend, while the macropores show a weak decreasing trend.
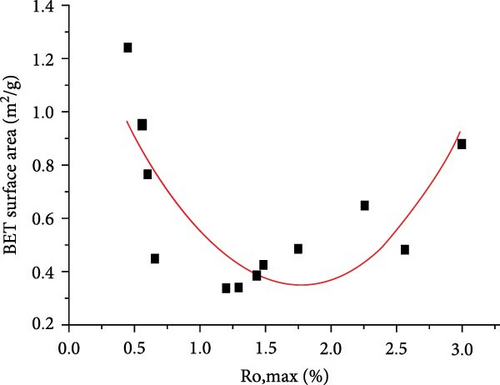
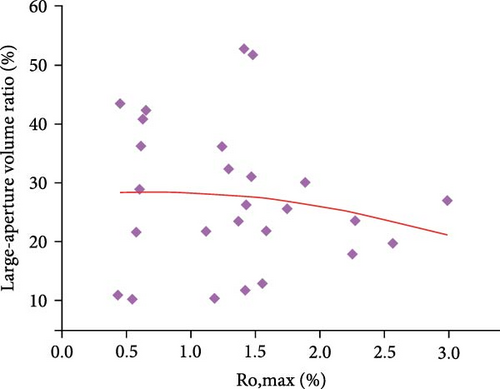
Statistical analysis of the data from the low-temperature nitrogen adsorption experiments by Brunauer–Emmett–Teller (BET) model showed that the total BET model surface area and the percentage of micropore volume of the samples tended to decrease and then increase with the increase of coal rank, while the percentage of micropore volume and the percentage of mesopore volume tended to decrease and then increase [23].
Analyzing the effect of coalification on pore development, it is concluded that at the early stage of coalification, with the increase of burial depth, the coal is compacted and the porosity decreases, meanwhile, the aliphatic hydrocarbon chains in the coals gradually shorten, the branched chains and oxygen-containing functional groups keep shedding and decreasing, generating asphaltenes to fill the pores, resulting in the overall decrease of porosity of coal; at the transition stage of coal to high maturity, the asphaltenes in coal gradually decrease, the filling effect decreases, the aromatic lamellae keep orienting and arranging, and the aromatic rings keep polymerizing, which makes the porosity, pore volume, and specific surface area of coal rebound.
4.3.2. The Control of Microfracture Development by Coalification
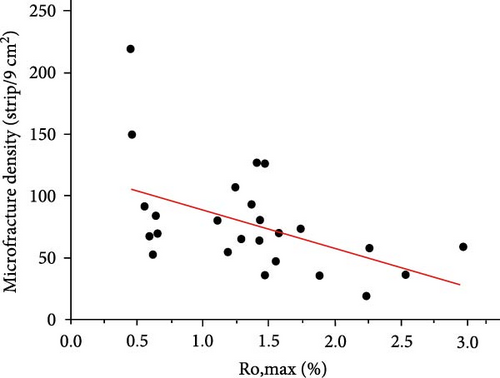
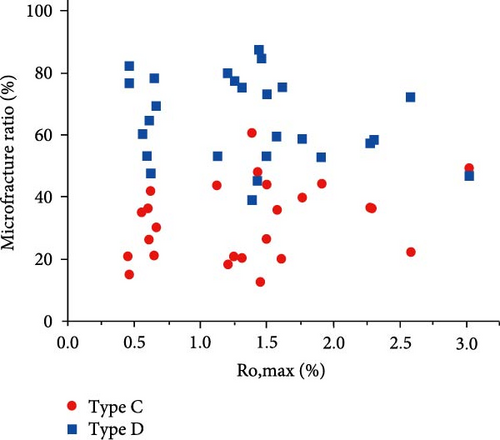
For microfractures, it is generally believed that endogenous fractures are better developed in bituminous coals compared to anthracite coals. Compared with bituminous coal, anthracite coal has better mechanical properties and is less prone to deformation. Under the same stress conditions, coals with a medium degree of metamorphism have larger fractures than coals with high degree of metamorphism [23]. In Figure 10, it can be seen that the microfractures in the coals decrease with the increase of coal rank, and this phenomenon may be because the primary microfractures are more developed after the coal undergoes the peat stage, and with the coalification, the microfracture density is reduced by the enhancement of asphalting and compaction. The percentage of type C fractures is weakly positively correlated with Ro,max, and the opposite for type D fractures, but this regularity is not obvious.
4.3.3. Control of Pore Development by Microscopic Components
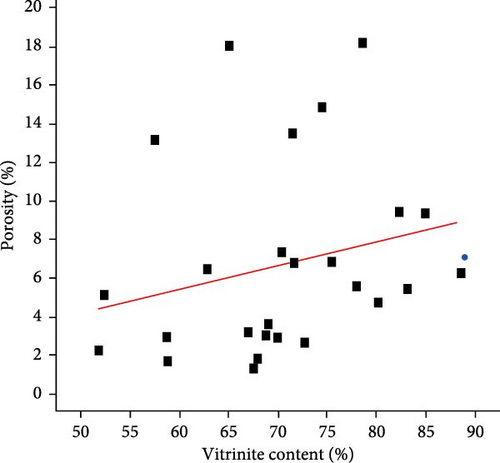
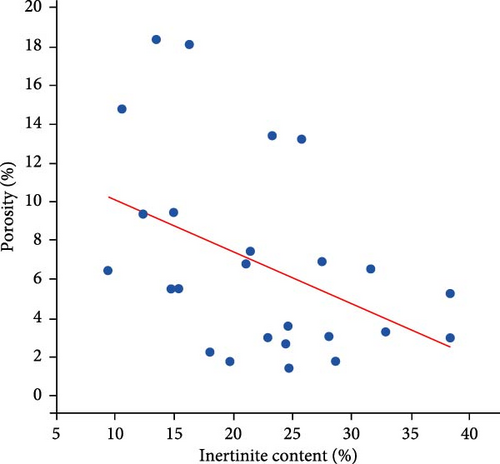
The relationship in porosity to mirror group and inert group content is shown in Figure 8. The porosity of coal is weakly positively correlated with mirror group content, indicating that the presence of the mirror group in coal is favorable to pore development. On the whole, the porosity decreases with the increase of inert group content, indicating that the inert group fraction is unfavorable to pore development.
4.3.4. Control of Microfracture Development by Microscopic Components
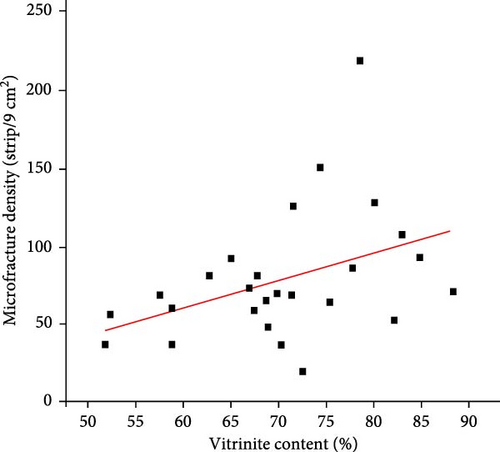
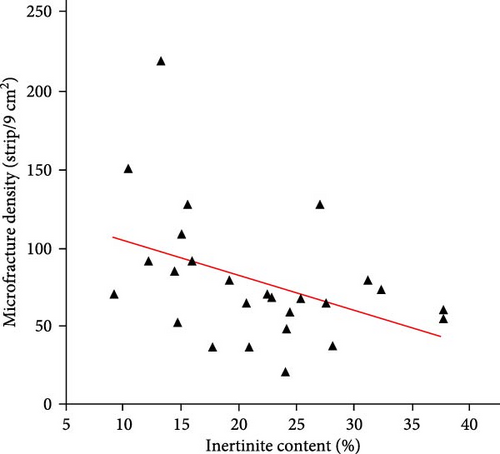
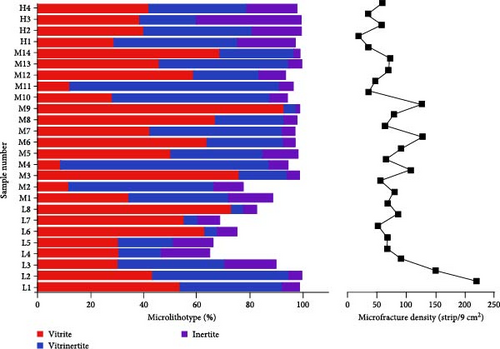
The relationship between the degree of microfracture development in coal and microlithotype of coal is shown in Figure 11, which shows that microscopic coal type is one of the factors affecting microfracture development. With the increase of vitrite and vitrinertite type in coal, especially the higher the content of vitrite, the microfractures in coals are relatively more developed. In contrast, inertite types are negatively correlated with the degree of microfracture development in coal. Therefore, it is considered that the greater the proportion of vitrite and vitrinertite in the microlithotype of coal, the smaller the proportion of inertite in coal, the better the development degree of microfracture in coal.
4.4. Environment of Coal Generation
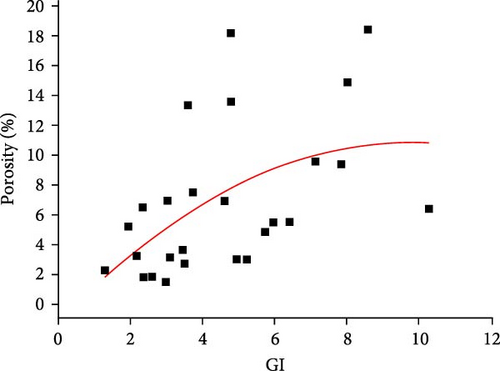
The development of pore fractures in coal is influenced by the coal-forming environment, the information of redox environment, hydrodynamic conditions, and plant preservation state during the coal-forming period can be reflected by the coal facies comprehensively [54, 55]. To further analyze the development of pore fractures influenced by the coal facies, the coal facies index was calculated and correlated with the pore fracture structure parameters to summarize the influence of coal-forming environment on the pore fracture development. According to the previous experience, the following coal facies indices were selected in this study, and the calculation results are shown in Table 4. The gelation index (GI) can reflect the water level and gelation degree of the peat bog. The higher the GI value, the stronger the gelation and the wetter the peat bog, and its calculation formula is as follows:
| Coals number | TPI | GI | GWI | OI |
|---|---|---|---|---|
| L1 | 3.794 | 8.848 | 0.083 | 0.041 |
| L2 | 2.473 | 8.053 | 0.022 | 0.052 |
| L3 | 1.517 | 4.807 | 0.035 | 0.037 |
| L4 | 0.976 | 3.632 | 0.071 | 0.049 |
| L5 | 1.587 | 4.799 | 0.045 | 0.054 |
| L6 | 2.212 | 7.157 | 0.027 | 0.058 |
| L7 | 3.929 | 6.393 | 0.054 | 0.044 |
| L8 | 2.284 | 4.979 | 0.022 | 0.059 |
| M1 | 2.565 | 2.336 | 0.167 | 0.094 |
| M2 | 2.790 | 1.614 | 0.078 | 0.105 |
| M3 | 2.079 | 5.978 | 0.048 | 0.048 |
| M4 | 0.324 | 3.139 | 0.128 | 0.117 |
| M5 | 1.831 | 7.855 | 0.057 | 0.071 |
| M6 | 2.032 | 5.746 | 0.119 | 0.050 |
| M7 | 1.786 | 4.620 | 0.037 | 0.103 |
| M8 | 2.510 | 4.172 | 0.095 | 0.049 |
| M9 | 2.363 | 2.607 | 0.093 | 0.032 |
| M10 | 0.699 | 3.746 | 0.093 | 0.068 |
| M11 | 0.198 | 3.469 | 0.133 | 0.115 |
| M12 | 0.923 | 10.291 | 0.041 | 0.057 |
| M13 | 1.730 | 2.171 | 0.163 | 0.111 |
| M14 | 0.645 | 3.088 | 0.053 | 0.114 |
| H1 | 0.946 | 3.516 | 0.057 | 0.116 |
| H2 | 1.117 | 3.004 | 0.205 | 0.045 |
| H3 | 1.762 | 1.526 | 0.225 | 0.050 |
| H4 | 1.663 | 1.730 | 0.389 | 0.085 |
4.4.1. The Control of Pore Development by Coal-Forming Environment
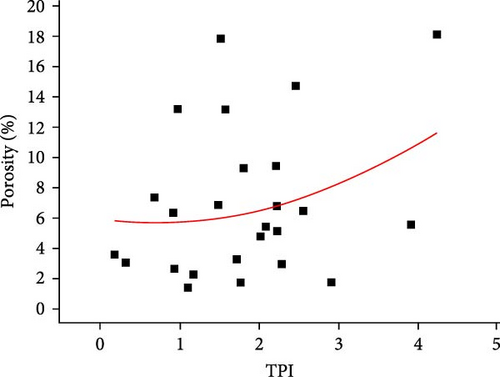
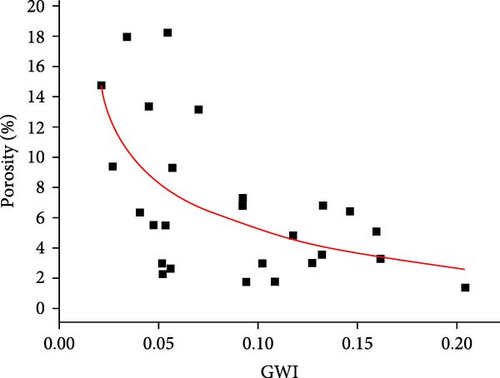
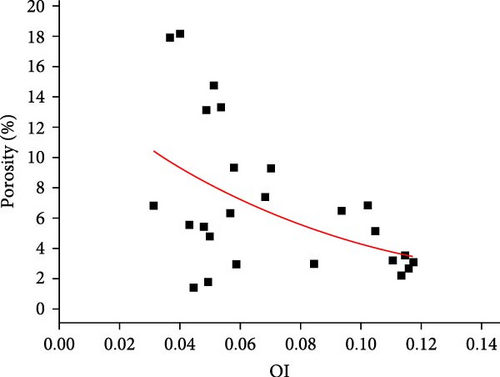
The statistical analysis of coal facies index and pore development shows that not all coal facies indices have a good correlation with CBM reservoir pore fractures. As shown in Figure 12, TPI has a weak positive correlation with the total positive correlation with the porosity of coals. Since TPI indicates the preservation of plant cells, it indicates that the more serious the plant tissues in the selected coals are degraded by microorganisms, the worse the preservation of plant cells is, and the more unfavorable to the development of pores in coal. GI reflects the water table and gelation degree of peat bog. Porosity is increased with the increase of GI. As the wetness of the peat bog increases, the gelation is enhanced and the specular bodies in the coal are formed continuously, which eventually makes the porosity, specific surface area, and total pore volume of the coal increase. GWI can reflect the change in peat accumulation rate and foreign mineral input to the bog wetland, and some of the original pores may be filled with additional minerals as more minerals are added. GWI is negatively correlated with porosity. The increase of GWI value indicates the increase of water level in coal peat bog, and the recharge of peat bog water source leads to the increase of land-derived detritus content in coal seam, which makes the mineral content in coal increase, and the increased minerals will fill the pores in coals, which makes the porosity, specific surface area, and total pore volume of coal seam decrease. OI reflects the redox degree of coal-forming swamp. Overall, the porosity decreases with the increase of OI, and the increase of OI value indicates that the reduction degree of environment decreases and the oxidation degree increases, while the development of inert group in coal is better under the condition of increasing oxidation degree, and the increase of inert group content leads to the decrease of porosity, specific surface area, and total pore volume of coal.
4.4.2. The Control of Coal-Forming Environment on Microfracture Development
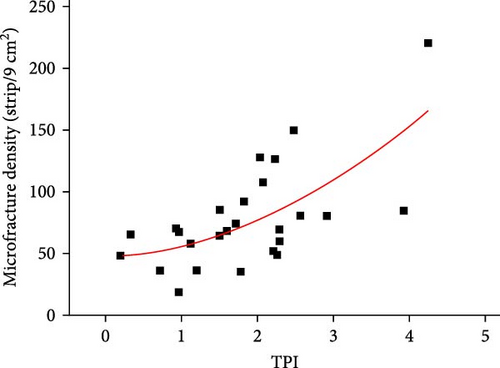
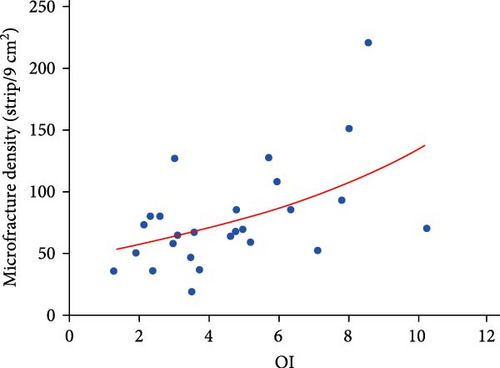
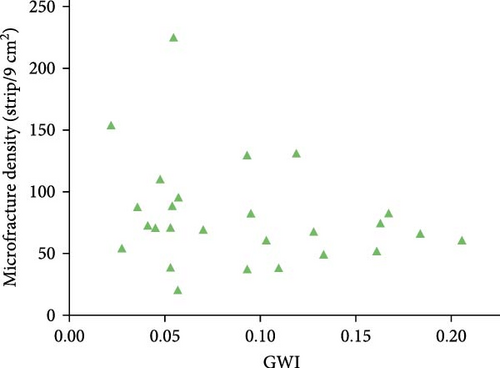
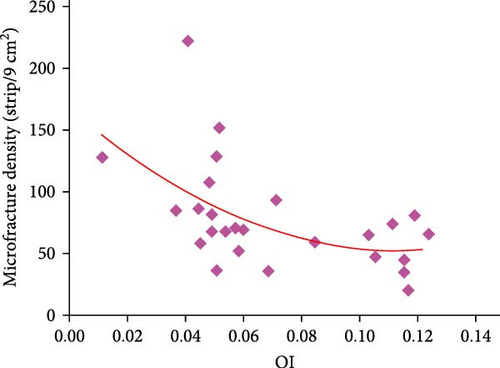
The statistical analysis of microfracture density and coal facies index in coals showed that the microfracture density was positively correlated with TPI and GI, and negatively correlated with OI, and the correlation between GWI and microfracture was not significant (Figure 12). It can be concluded that the well-preserved tissue structure of coal-forming plants is conducive to the development of microfractures in coal seams; the wetter the peat bog is during the coal-forming period, the more microfractures are developed; the weakly oxidized coal-forming environment has better microfractures development.
5. Conclusions
- (1)
At the early stage of coalification, with the increase of burial depth, the coal is compacted and the porosity decreases, while the aliphatic hydrocarbon chains in the coals gradually shorten, the branched chains and oxygen-containing functional groups keep shedding and decreasing, generating asphaltenes to fill the pores, resulting in the overall decrease of the porosity of coal and the enhancement of the nonhomogeneity of pores; in the transition stage of coals to high maturity, the filling effect decreases, the aromatic lamellae are continuously oriented and arranged, and the aromatic rings are continuously condensed, which makes the porosity, pore volume, and specific surface area of coal rebound, and the nonhomogeneity of pore structure is weakened; the density of microfracture decreases with the increase of coal rank, which may be the effect of compaction and asphaltene.
- (2)
Microfracture development is controlled by coalification and microscopic components. The mirror group in coal is favorable to the development of pore fractures, while the opposite is true for the inert group. The higher the content of vitrite and vitrinertite type in coal, the more the microfractures are developed. The microfractures in the coals decrease with the increase in coal rank.
- (3)
By establishing the relationship between different coal facies indices and pore fracture characteristic parameters, the influence of different coal-forming environmental conditions on pore fracture development can be judged, and it is concluded that the pore fracture development of coals in the study area is more obviously influenced by the degree of preservation of plant tissues, the degree of wetting and reduction of swamps, and the effect of groundwater on microfracture development is smaller, while the influence on pore fracture development is more significant.
Conflicts of Interest
The authors declare that they have no conflicts of interest.
Acknowledgments
This research was funded by the National Natural Science Foundation of China (grant nos. 42372195 and 42130806) and the Fundamental Research Funds for the Central Universities (grant no. 2652022207).
Open Research
Data Availability
The data that support the findings of this study are available upon reasonable request from the corresponding author, Yidong Cai.


