The Promising Potential of Ezh1 Inhibition as a Therapeutic Strategy Against Dengue Infections
Abstract
The investigation of enhancer of zeste homolog 1 (Ezh1) in the context of dengue infection immunity has been limited, necessitating further exploration to elucidate its precise role and underlying mechanisms during infections. To address this gap, we generated Ezh1 knockout mice and obtained bone marrow and spleen samples from both Ezh1 knockout mice and wild-type (WT) counterparts. Leveraging RNA sequencing (RNA-seq) analysis, we identified the enrichment of genes associated with the interleukin-17 (IL-17) signaling pathway among the differentially expressed genes (DEGs) in the spleens of male Ezh1 knockout mice when compared to WT mice. Furthermore, our results revealed that Ezh1 knockout not only curtailed the viral load in dengue virus (DENV) infections but also suppressed the expression of pivotal cytokines, including interleukin-9 (IL-9) and IL-17. Additionally, utilizing high-parameter flow cytometry, we observed alterations in the immune cell phenotype within the spleens linked to Ezh1 gene knockout. Specifically, Ezh1 knockout inhibited the expressions of programmed cell death protein 1 (PD-1), lymphocyte-activation gene 3 (LAG-3), and cluster of differentiation 86 (CD86). Additionally, we noted a reduction in cluster of differentiation 62L (CD62L) expression in neutrophils following DENV infection. Our comprehensive findings collectively underscore the significant role of Ezh1 in DENV infection, suggesting that targeting Ezh1 could offer a promising antiviral strategy.
1. Introduction
Enhancer of zeste homolog 1/2 (Ezh1/2) constitutes the central catalytic subunit of the Polycomb Repressive Complex 2 (PRC2), responsible for effecting the methylation of lysine 27 on histone H3. This epigenetic modification is intrinsically linked to gene silencing processes [1]. While Ezh1 and Ezh2 share significant homology, Ezh2 has garnered more extensive attention, particularly within the realm of tumorigenesis [2]. Nevertheless, Ezh1 is capable of autonomous functionality [3], and the exploration of its functions presents a promising avenue for expanded research. Additionally, research has indicated that the core protein C of dengue virus (DENV) interacts with histones in liver cells [4], potentially affecting epigenetics. A systematic review article systematically examined host epigenetic signatures arising from arbovirus infections, summarizing microRNAs (miRNAs) and DNA methylation signatures related to secondary dengue fever (DF) [5]. Additionally, studies have shown that Ezh1/2 inhibitors can suppress infection caused by Zika virus (ZIKV), a member of the Flaviviridae family [6].We have validated 11 upregulated miRNAs, including Lethal-7e (let-7e), and 4 downregulated miRNAs, including microRNA-20a (miR-20a), in human peripheral blood mononuclear cells (PBMCs) after DENV infection [7]. Moreover, we confirmed that Ezh2 was a direct target of let-7e and found that EZH2 knockdown could inhibit tumor necrosis factor α (TNF-α) expression induced by DENV [8]. These findings collectively suggest that epigenetics plays a significant role in viral infections. And in our previous investigation, it was revealed that miR-20a directly targeted Ezh1 [9]. However, research into the role of Ezh1 in infection immunity remains conspicuously limited, necessitating an in-depth exploration to elucidate the specific functions and mechanisms of Ezh1.
Dengue is caused by the DENV infection and clinical manifestations include DF, dengue hemorrhagic fever (DHF), or dengue shock syndrome (DSS) [10, 11]. DHF and DSS are classified as severe dengue fever (SDF), a life-threatening complication of dengue. As of April 30, 2024, the World Health Organization (WHO) has reported more than 7.6 million dengue cases for the year, which includes 3.4 million confirmed cases, over 16,000 severe cases, and more than 3000 deaths. And a substantial increase in dengue cases has been reported globally in the last 5 years, particularly in the region of the Americas [12]. In the meantime, there are gender differences in the incidence and symptoms of dengue infection. Every year, as many as 400 million individuals fall victim to DENV infection, with a notable gender discrepancy, wherein females in the Mexican population exhibit a higher susceptibility to infection and a greater prevalence of symptoms [13]. In particular, dengue symptoms in females have been linked to hemorrhagic manifestations, such as thrombocytopenia, anemia, and leukopenia, with a significantly higher incidence in females as compared to males [13]. The dengue vaccine is still undergoing clinical trials [14]. The limited understanding of the underlying mechanisms behind SDF and the lack of appropriate animal models to replicate human dengue infections have impeded drug development, leaving the field devoid of effective antiviral treatments. Many researchers concur that the pathogenesis of SDF is closely associated with the dysregulation of cytokines [15, 16]. It was identified that lymphocytes (low) and neutrophils (high) might serve as an early predictor of prognosis in dengue infection [17]. These studies suggest that SDF is closely related to inflammatory factors and the phenotype of immune cells.
Therefore, exploring Ezh1’s role in infection immunity is essential for understanding host responses to viral threats. We used Ezh1 knockout mice, including males and females (Ezh1−/− and Ezh1−/+), and wild-types (WTs) for RNA sequencing (RNA-seq) analysis. Notably, we found enrichment in infection-related pathways, particularly in male Ezh1 knockout spleens. These pathways included interleukin-17 (IL-17) signaling, cytokine–cytokine receptor interaction, viral protein interaction with cytokine and cytokine receptor, chemokine signaling, and neutrophil extracellular trap formation. Further investigation involved inducing bone marrow–derived macrophages (BMDMs) using bone marrow cells from male Ezh1−/− and WT mice, followed by DENV infection. We observed a reduced viral load and diminished IL-17 expression in the Ezh1−/− group, indicating Ezh1’s potential as an antiviral and anti-inflammatory target. Complementary flow cytometry analysis, utilizing 29 markers, revealed Ezh1 knockout’s suppression of programmed cell death protein 1 (PD-1), lymphocyte-activation gene 3 (LAG-3), and cluster of differentiation 86 (CD86) expressions, along with the inhibition of cluster of differentiation 62L (CD62L) expression in neutrophils following DENV infection. In summary, our findings lay the groundwork for innovative therapeutic strategies against DF.
2. Materials and Methods
2.1. Mice
All mice with a C57 Black 6 (C57BL/6) background, including both WT and Ezh1 gene knockout (Ezh1−/−) mice, which were 6–8 weeks old, were bred at the Animal Center of the First Affiliated Hospital of Sun Yat-sen University (2022-021). All animal experimentation was conducted in strict accordance with the guidelines and regulations approved by the Ethics Committee for Clinical Research and Experimental Animals of the First Affiliated Hospital, Sun Yat-sen University.
2.2. RNA Isolation and Complementary Deoxyribonucleic Acid (cDNA) Library Construction
RNA was extracted from the bone marrow and spleens of male and female mice, including WT, Ezh1 heterozygous (Ezh1−/+), and Ezh1 knockout (Ezh1−/−) mice with a C57BL/6 background. Eukaryotic messenger ribonucleic acid (mRNA) was subsequently enriched using magnetic beads containing oligo (dT) and fragmented into shorter fragments. The mRNA was then utilized as a template for the synthesis of cDNA. Following cDNA synthesis, purification and fragment size selection of the cDNA were conducted employing AMPure XP beads. Subsequently, polymerase chain reaction (PCR) amplification was performed, and the resultant product underwent purification using AMPure XP beads to establish the cDNA library. Once the library was constructed, preliminary quantification was carried out using Qubit 2.0. The library was subsequently diluted to a concentration of 1 ng/μL, and the size of inserted fragments was assessed using the Agilent 2100 system. Further, the library’s effective concentration, confirmed to be greater than 2 nM, was precisely quantified via quantitative PCR (qPCR). Finally, high-throughput sequencing of the library was performed using the Illumina platform, including HiSeq or MiSeq, depending on the specifics of the experimental setup.
2.3. Identification of Differentially Expressed Genes (DEGs) and Functional Enrichment
After obtaining the raw sequencing sequences (raw reads), filtering and quality evaluation were performed using fast software. The quality-controlled sequences were compared to the ribosomal RNA sequences in the RNA families database (RFAM) database, and the reads on the unaligned were retained for subsequent analysis and the reference genome was aligned. Using RNA-seq by expectation-maximization (RSEM), count the number of reads per sample and calculate fragments per kilobase per million mapped reads (FPKMs). The differential expression criteria were an absolute log2 fold change (LFC) of 1 and an adjusted p value of 0.05, calculated using a moderated t test. Gene Ontology (GO) and Kyoto Encyclopedia of Genes and Genomes (KEGG) analysis were performed by using volcano plot, bidirectional enrichment analysis, and GO/KEGG enrichment analysis tools in Hiplot Pro (https://hiplot.com.cn/), a comprehensive web service for biomedical data analysis and visualization.
2.4. Viruses and Cells
The Dengue 2 virus (DENV2) New Guinea C strain, generously provided by the Zhongshan School of Medicine at Sun Yat-sen University, was cultivated in the C6/36 insect cell line, also obtained from the Zhongshan School of Medicine at Sun Yat-sen University. DENV2 was cultured in C6/36 mosquito cells. After 3–4 days, the virus was harvested, centrifuged, and stored at −80°C [18]. And virus titration was carried out using a plaque assay, as previously described [18].
2.5. Isolation and Culturing of Cells
Bone marrow cells were isolated from both WT and Ezh1 knockout (Ezh1−/−) mice. These cells were cultured in Roswell Park Memorial Institute (RPMI)-1640 media containing 10% fetal bovine serum for 7 days, with the addition of 50 ng/mL macrophage colony-stimulating factor (M-CSF, Peprotech). This process aimed to differentiate the cells into BMDMs. Single-cell suspensions of murine spleens were prepared for immunnophenotyping following established guidelines [19].
2.6. In Vitro Infection
After washing with phosphate-buffered saline (PBS), both BMDMs and spleen single-cell suspensions were exposed to DENV2 at an multiplicity of infection (MOI) of 0.2 for a 2 h incubation at 37°C. Subsequently, the viral inoculum was removed, and the cells were washed with PBS before fresh medium was added. For mock-infected cells, culture supernatant from uninfected C6/36 cells was used. After 24 h of incubation, the culture supernatant was collected for virus load analysis and cytokine quantification.
2.7. Virus Load Analysis
To quantify the viral load, quantitative reverse transcription PCR (qRT-PCR) was conducted. RNA was isolated from 200 µL of the supernatant using the HiPure Viral RNA/DNA Kit (Magen, China) in accordance with the manufacturer’s instructions. Subsequently, cDNA was generated through reverse transcription using the Evo M-MLV RT Kit (AG, China). The qRT-PCR was carried out using the toluene blue (TB) Green method, following the manufacturer’s guidelines, on the QuantStudio 3 and 5 platform (Applied Biosystems).
The primer sequences specific to dengue virus envelope protein (DENV E) are detailed in Table 1.
| Gene | Forward primer (5′ to 3′) | Reverse primer (5′ to 3′) |
|---|---|---|
| DENV2 envelope | CATTCCAAGTGAGAATCTCTTTGTCA | CAGATCTCTGATGAATAACCAACG |
- Abbreviations: DENV2, dengue 2 virus; DENV E, dengue virus envelope protein.
2.8. Cytokine Determination
Bio-Plex Pro Mouse Cytokine 10-plex express (EXP) kit (Catalog No. 17006044) was used to detect mouse cytokine group I, including interleukin-1α (IL-1α), interleukin-3 (IL-3), interleukin-5 (IL-5), interleukin-9 (IL-9), interleukin-12 (IL-12; p40), IL-12 (p70), interleukin-13 (IL-13), interleukin-17A (IL-17A), eotaxin, and granulocyte colony-stimulating factor (G-CSF), all in one kit. For detecting mouse chemokines, the Bio-Plex Pro Mouse Chemokine Panel 31-plex (Catalog No. 12009159) was used to detect mouse cytokine, which includes B-cell activating chemokine 1 (BCA-1)/C–X–C motif chemokine ligand 13 (CXCL13), cutaneous T-cell-attracting chemokine (CTACK)/CCL27, extractable nuclear antigen (ENA)-78/CXCL5, Eotaxin/CCL11, Eotaxin-2/CCL24, Fractalkine/CX3CL1, granulocyte-macrophage colony-stimulating factor (GM-CSF), interleukin-309 (I-309)/CCL1, interferon-γ (IFN-γ), interleukin-1β (IL-1β), interleukin-2 (IL-2), interleukin-4 (IL-4), interleukin-6 (IL-6), interleukin-10 (IL-10), interleukin-16 (IL-16), IP-10/CXCL10, interferon-inducible T-cell alpha chemoattractant (I-TAC)/CXCL11, keratinocyte-derived chemokine (KC)/CXCL1, monocyte chemoattractant protein (MCP)-1/CCL2, MCP-3/CCL7, MCP-5/CCL12, macrophage-derived chemokine (MDC)/CCL22, macrophage inflammatory protein (MIP)-1α/CCL3, MIP-1β/CCL4, MIP-3α/CCL20, regulated upon activation, normal T-cell expressed and secreted (RANTES)/CCL5, MIP-3β/CCL19, small inducible cytokine B16 (SCYB16)/CXCL16, stromal cell–derived factor 1 alpha (SDF)-1α/CXCL12, thymus and activation-regulated chemokine (TARC)/CCL17, and TNF-α.
2.9. Multicolor Flow Cytometry
Single-cell suspensions of spleen were subjected to staining with a panel of antibodies, as detailed in Table 2. All antibodies used in this study were sourced from BD, with the exception of cluster of differentiation 16 (CD16), which was obtained from BioLegend. Staining of the samples was conducted for 30 min, followed by sample processing and analysis utilizing a BD FAC Symphony machine equipped with FAC SDiva software. Flow cytometric data analysis was carried out using FlowJo V.10.0 for Windows.
| Specificity | Clone | Fluorocrome |
|---|---|---|
| CD45 | 30-F11 | BUV805 |
| CD3 | 145-2C11 | BUV395 |
| CD4 | RM4-5 | BV605 |
| CD25 | PC61 | BB515 |
| CD19 | 1D3 | BV650 |
| I-A/I-E | M5/114.15.2 | BUV737 |
| LY-6G | 1A8 | BV750 |
| CD138 | 281-2 | BB700 |
| CD27 | LG.3A10 | BV786 |
| CD127 | SB/199 | BV421 |
| B220 | RA3-6B2 | BV510 |
| CD44 | IM7 | BUV563 |
| NK1.1 | PK136 | BUV615 |
| CD62L | MEL-14 | APC-R700 |
| CD86 | GL1 | PE |
| LAG-3 | C9B7W | BUV496 |
| L/D | NA | FVS440uv |
| F4/80 | T45-2342 | BV480 |
| CD8a | 53-6.7 | BV570 |
| CD169 | 3D6/CD169 | PE-Cy5 |
| CD64 | X54-5/7.1 | BUV661 |
| CD11c | N418 | APC |
| CD317 | 927 | PE-CF594 |
| PD-1 | RMP1-30 | PE-Cy7 |
| CD73 | TY/23 | BV711 |
| CD11b | M1/70 | BB630 |
| CD134(OX40) | OX-86 | BB660 |
| Ly-6C | AL-21 | BB790 |
| CD16 | S17014E | APC-cy7 |
- Abbreviations: CD, cluster of differentiation; CD16, cluster of differentiation 16; CD86, cluster of differentiation 86; CD62L, cluster of differentiation 62L; LAG-3, lymphocyte-activation gene 3; L/D, live/dead staining reagent; Ly-6C, leukocyte antigen 6 complex, Group C; LY-6G, leukocyte antigen 6 complex, Group G; NK1.1, natural killer cell receptor 1.1; PD-1, programmed cell death protein 1.
2.10. Statistical Analysis
Data analysis was conducted using GraphPad Prism version 8.0.2. The levels of viral load, cytokines, and subset populations within the three groups were assessed through one-way analysis of variance (ANOVA). Post hoc analysis was performed using Dunnett’s multiple comparison test. Statistical significance was determined based on a threshold of p < 0.05, with corresponding p-values indicated in the respective figures.
3. Results
3.1. Transcriptome Profiling of BMDM From Ezh1−/−, Ezh1−/+, and WT Mice
To investigate the role of Ezh1, we established Ezh1 knockout mice and collected bone marrow samples from both male and female mice categorized as M. Homo. BM, M. Heter. BM, M. WT. BM, F. Homo. BM, F. Heter. BM, and F. WT. BM. We conducted RNA-seq, identifying a total of 14,459 genes across the six groups, utilizing an FPKM value threshold greater than 0 (Figure 1A).

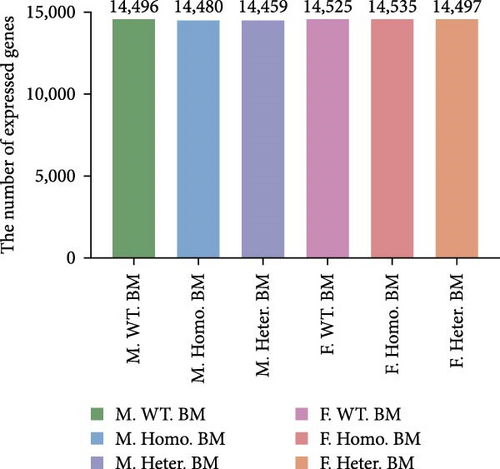
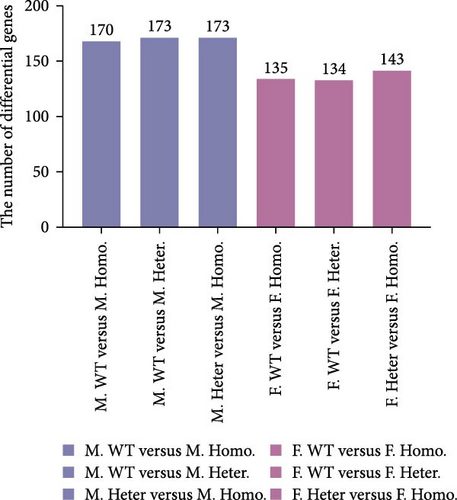
Among these detected genes, 14,496, 14,480, and 14,459 genes were expressed in BMDM of M. WT, M. Homo., and M. Heter., respectively (Figure 1B). For female mice, 14,525, 14,535, and 14,497 genes were expressed in BMDM of F. WT, F. Ezh1−/−, and F. Heter., respectively (Figure 1B). Notably, the number of DEGs in the male group exceeded that in the female group (Figure 1C).
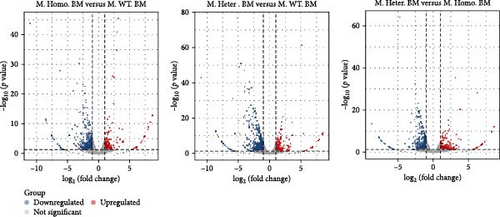
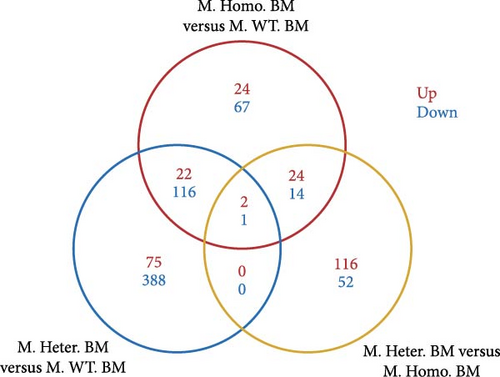
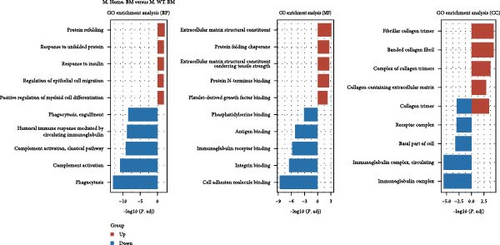
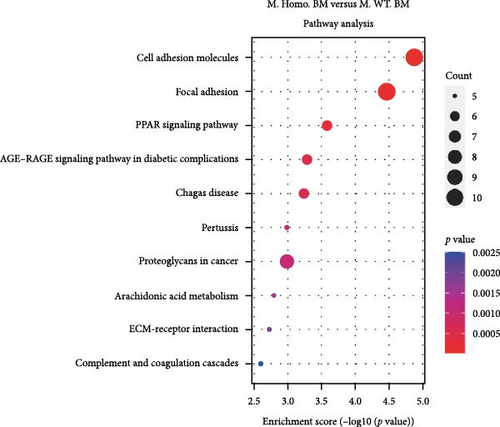
Subsequently, we conducted RNA-seq to identify DEGs in three pairwise comparisons: (1) M. Homo. BM versus M. WT. BM, (2) M. Heter. BM versus M. Homo. BM, and (3) M. Heter. BM versus M. WT. BM, visualized through volcano plots (Figure 2A). Venn diagrams illustrated unique DEGs for each comparison (Figure 2B). GO term and KEGG enrichment analyses highlighted DEGs related to cell adhesion molecules and the peroxisome proliferator-activated receptor (PPAR) signaling pathway in M. Homo. BM and M. WT. BM (Figure 2C,D).
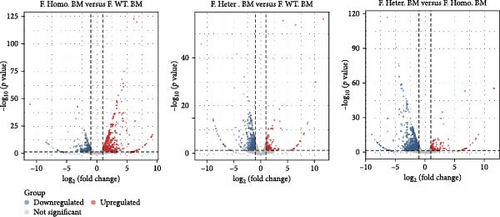
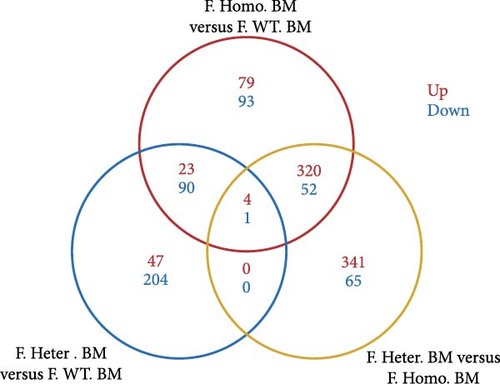
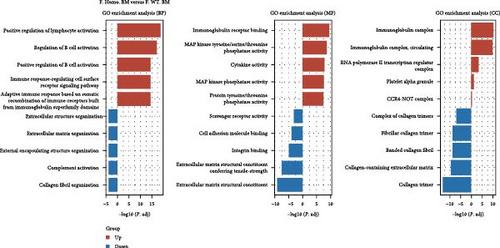
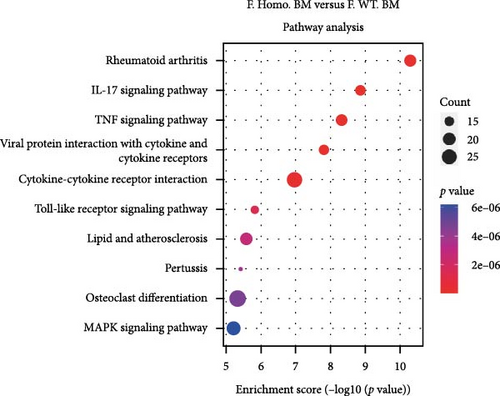
Given the observed gender differences in susceptibility to DENV infection, as well as sex-biased effects of Ezh1/Ezh2 loss in the liver [13, 20], we extended our analysis to include F. Homo. BM, F. Heter. BM, and F. WT. BM (Figure 3A). In these comparisons, we identified 79 upregulated and 93 downregulated unique DEGs in the F. Homo. BM versus F. WT. BM comparison, as illustrated by the venn diagram (Figure 3B). Enrichment analysis of these DEGs revealed associations with the IL-17 signaling pathway, TNF signaling pathway, viral protein interaction with cytokines and cytokine receptors, and cytokine–cytokine receptor interactions (Figure 3C,D).
3.2. Transcriptome Profiling of Spleen from Ezh1−/−, Ezh1−/+, and WT Mice
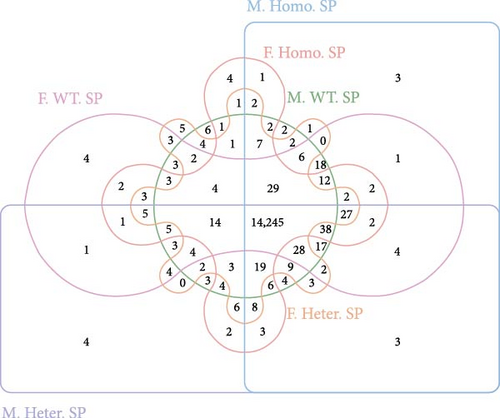
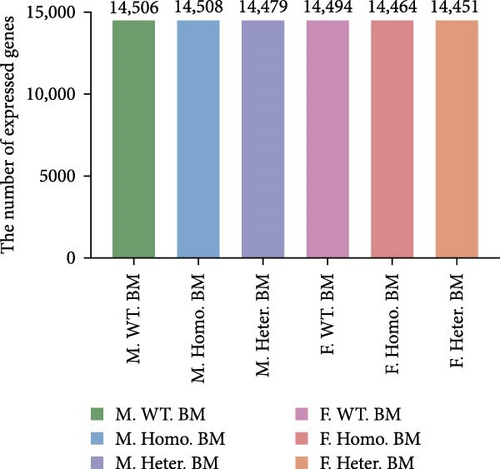
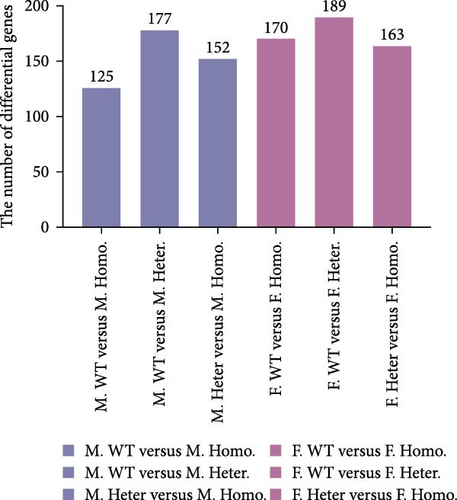
In our investigation, we analyzed the transcriptome of spleens obtained from male Ezh1−/−, male Ezh1−/+, and male WT mice, as well as from female Ezh1−/−, female Ezh1−/+, and female WT mice, denoted hereafter as M. Homo. SP, M. Heter. SP, M. WT. SP, F. Homo. SP, F. Heter. SP, and F. WT. SP, respectively. We established these categorizations based on an FPKM value threshold greater than 0, which resulted in the detection of 14,506, 14,508, 14,479, 14,494, 14,464, and 24,451 genes expressed in the spleens of M. WT, M. Homo., M. Heter., F. WT, F. Homo, and F. Heter mice, respectively (Figure 4A, B). Remarkably, the number of different genes in the female group exceeded that in the male group (Figure 4C).
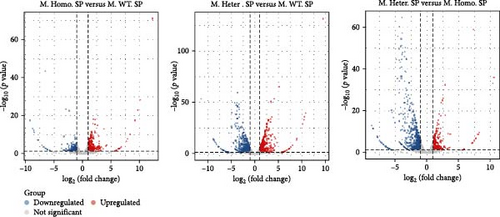
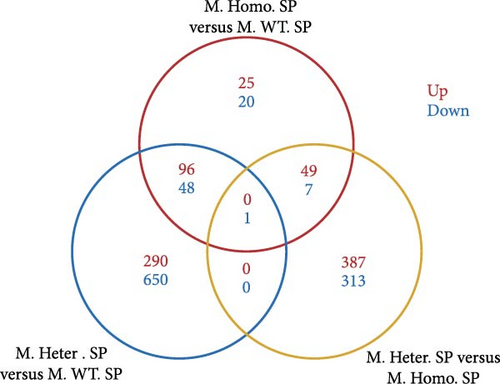
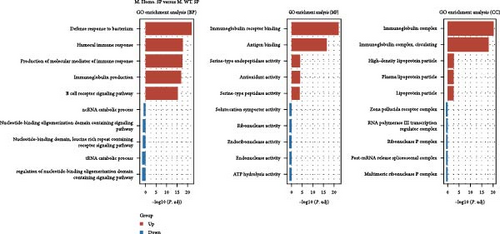
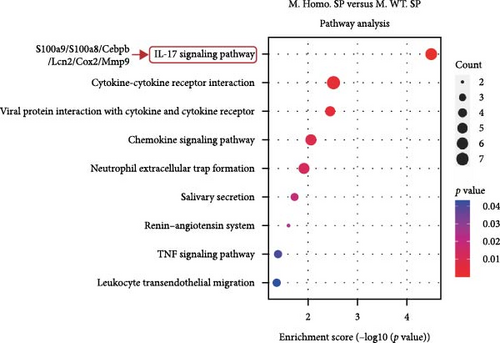
To assess the differences, we created volcano plots for three pairwise comparisons: M. Homo. SP, M. WT. SP, and M. Heter. SP (Figure 5A). Additionally, venn diagrams illustrated the numbers of upregulated and downregulated genes for each comparison (Figure 5B). Subsequent GO and KEGG enrichment analyses of the M. Homo. SP versus M. WT. SP comparison revealed enrichment of genes related to the IL-17 signaling pathway, viral protein interaction with cytokines and cytokine receptors, chemokine signaling pathway, and neutrophil extracellular trap formation (Figure 5C, D). Notably, DEGs of IL-17 signal pathway include S100 calcium binding protein A9 (S100a9), S100 calcium binding protein A8 (S100a8), CCAAT enhancer binding protein beta (Cebpb), lipocalin 2 (Lcn2), cyclooxygenase-2 (cox2), and matrix metallopeptidase 9 (Mmp9) (Figure 5D).
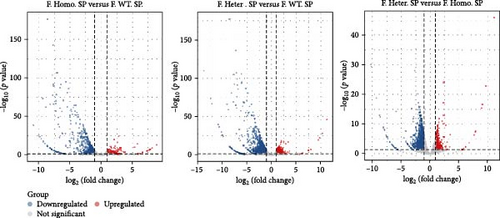
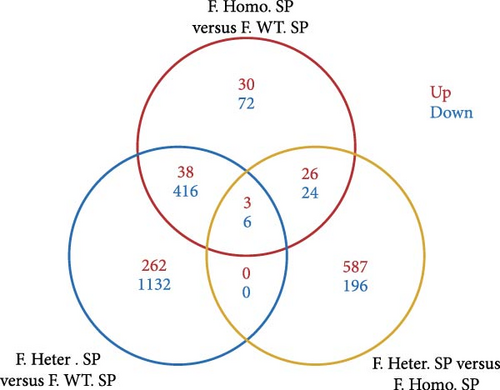
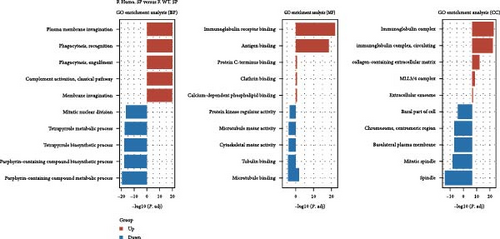
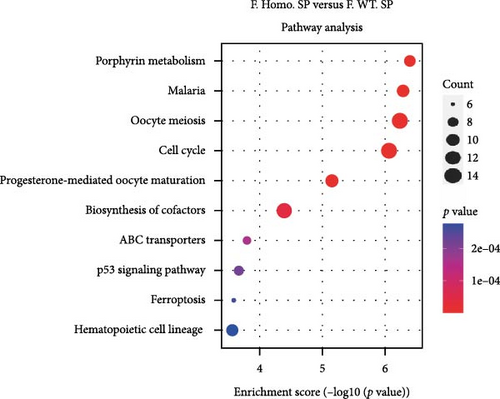
Considering gender differences, we analyzed the transcriptome data of F. Homo. SP, F. Heter. SP, and F. WT. SP, establishing lists of DEGs in three pairwise comparisons (Figure 6A). The venn diagrams of upregulated and downregulated genes revealed that F. Homo. SP versus F. WT. SP had the least number of specific differential genes compared to the other comparisons (Figure 6B). Further exploration of DEGs showed enrichment in porphyrin metabolism, cell cycle, and other pathways between F. Homo. SP and F. WT. SP (Figure 6C,D).
3.3. Effect of Ezh1 Knockout on DENV Viral Load and Cytokine Expression
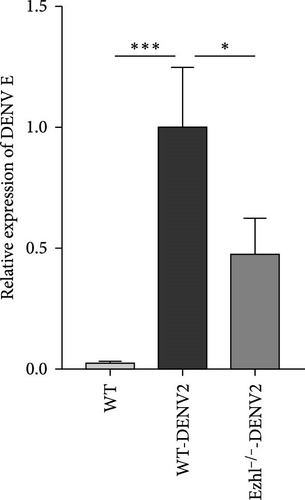
In our study, we investigated the impact of Ezh1 knockout on DENV viral load and the expression of key cytokines in the context of dengue infection. Recognizing the intricate role of estrogen in immune regulation [21] and the existing differences in gene expression between male and female knockout mice under unstimulated conditions, we chose male mice as subjects for subsequent experiments. We extracted bone marrow cells from male WT mice and male Ezh1−/− mice and induced their differentiation into BMDMs. Following infection with DENV2, we collected supernatants and detected viral transcription. Our results revealed that Ezh1 knockout significantly reduced the viral load, as shown in Figure 7.
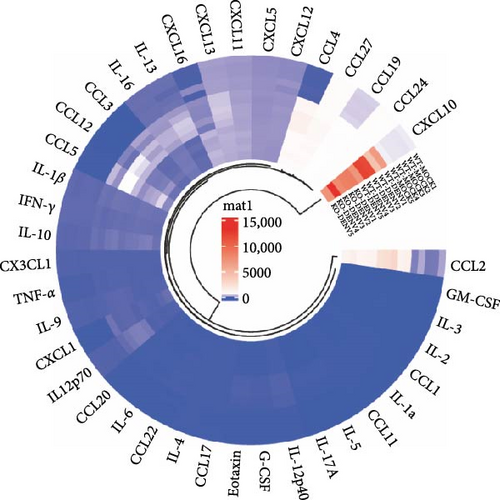
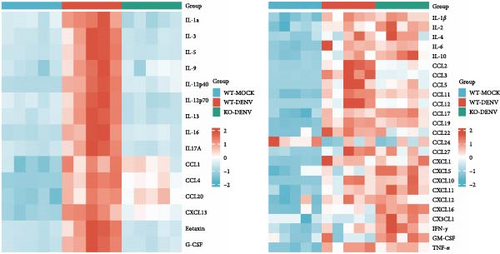
Furthermore, we analyzed the expression of various cytokines and chemokines in the supernatants obtained from DENV2-infected BMDM using Luminex liquid chip technology (Figure 7B). We observed that several factors, including IL-1α, IL-3, IL-5, IL-9, IL-12(p40), IL-12(p70), IL-13, IL-16, IL-17A, CCL-1, CCL-4, CCL-20, CXCL13, Eotaxin, and G-CSF, exhibited significant upregulation following DENV2 treatment. However, these elevated levels were nearly restored to those observed in the control group after Ezh1 knockout (Figure 7C).
Other factors, including CCL-2, CCL-3, CCL5, CCL-7, CCL-11, CCL-12, CCL-17, CCL-19, CCL-22, CCL-27, IL-1β, IL-4, IL-6, IL-10, IFN-γ, TNF-α, CXCL1, and CXCL10, also displayed increased expression following DENV2 treatment. However, there were no significant differences observed between the two groups of WT mice and Ezh1−/− mice (Figure 7C). Remarkably, CXCL11 exhibited even higher levels in the Ezh1−/− mice group after DENV2 treatment (Figure 7C).
3.4. Impact of Ezh1 Knockout on Immunophenotype of Immune Cells in Dengue Infection
In our study, we utilized the FlowJo platform to conduct a comprehensive analysis of immune cells isolated from mouse spleen treated with DENV2 in vitro. The staining panel employed for spleen cell analysis encompassed a wide array of phenotypic and functional markers, enabling the detailed categorization of immune cell subtypes and the characterization of their various states.
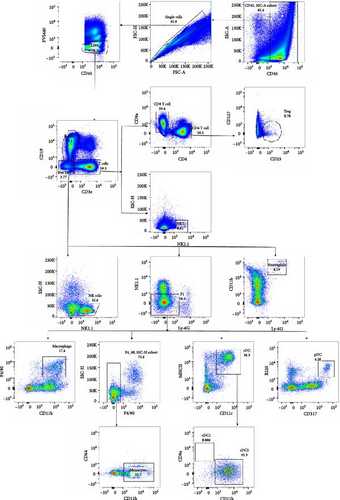
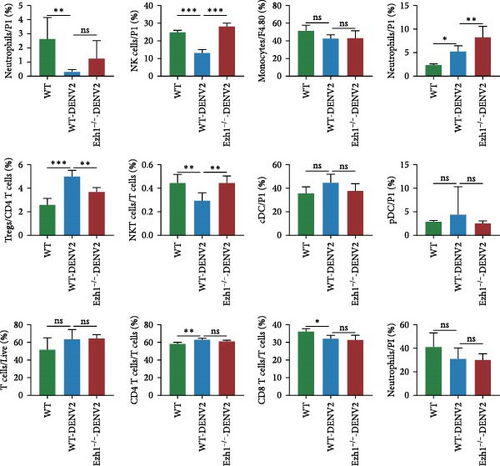
Employing a traditional gating strategy (Figure 8A), we performed t-distributed stochastic neighbor embedding (t-SNE) dimension reduction analysis to delineate the immune cell landscape (Figure 8B). As certain subgroups exhibited overlapping characteristics, we generated a distinct subgroup distribution map and summarized the percentage of each subgroup across samples (Figure 8C). Our analysis unveiled that natural killer cells (NK cells) and natural killer T cells (NKT cells) were significantly downregulated following DENV2 treatment, but their levels were largely restored to those of the control group after Ezh1 knockout (Figure 8C). Conversely, T regulatory cells (Tregs) exhibited an upregulation during dengue infection and were restored to control group levels after Ezh1 knockout (Figure 8C). Neutrophils showed decreased levels in both WT and Ezh1−/− groups, while macrophages exhibited an upregulation post-DENV2 treatment, with Ezh1−/− mice showing a further increase in this growth trend (Figure 8C). The levels of CD4 T cells were upregulated, whereas CD8 T cells were downregulated following DENV2 treatment. However, no significant difference was observed between the WT mice and Ezh1−/− mice groups (Figure 8C).
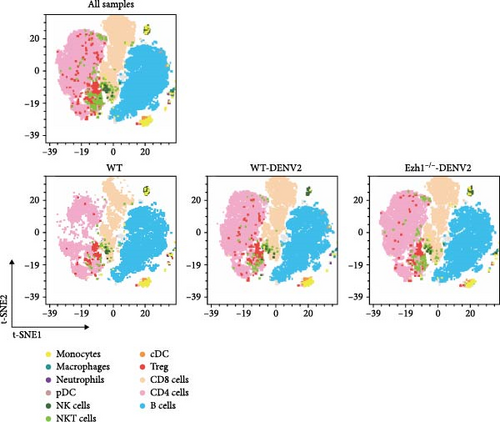
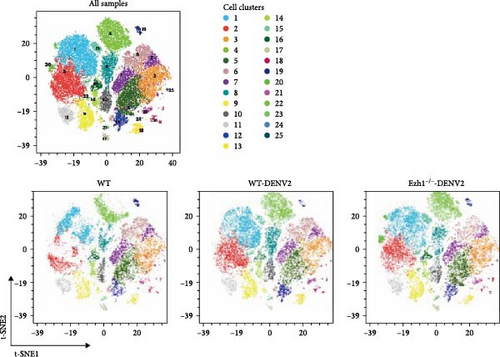
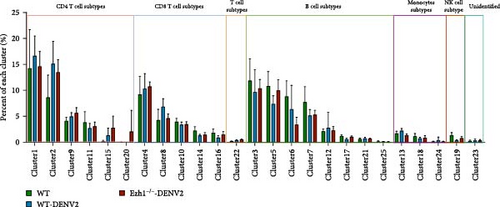
We extended our analysis by performing t-SNE dimension reduction and PhenoGraph clustering, which led to the identification of 25 immune cell clusters. Subsequently, we analyzed the profiles of these 25 immune cell clusters across all samples. Figure 9A presents a representative t-SNE profile of each group, and clustering analysis consistently grouped samples from the same treatment together, validating the t-SNE dimension reduction and PhenoGraph clustering analyses. To compare the distribution and abundance of the 25 identified immune cell clusters among the three treatment groups, we summarized the percentage of each cluster across samples (Figure 9B). In comparison with the traditional gating strategy, we identified clusters 4, 8, 10, 14, and 16 as five subtypes of CD8 T cells (CD3+ and CD8a+), and cluster 19 as a subtype of NK cells (CD4−, CD8a−, and NK1.1+). Clusters 3, 5, 6, 7, 12, 17, 21, and 25 were identified as eight subtypes of B cells (CD3− and CD19+). Clusters 1, 2, 9, 11, 15, and 20 were identified as six subtypes of CD4 T cells (CD3+, CD4+, and CD8a−). Clusters 13, 18, and 24 were identified as three subtypes of monocytes (CD11b+ and CD64−). Cluster 22 represented a subtype of T cells (CD3+, CD4−, and CD8−), while cluster 23 remained unidentified. Our analysis revealed that clusters 1, 8, 12, 13, and 24 exhibited significant upregulation following DENV2 treatment but were restored to control group levels after Ezh1 knockout (Figure 9B). To further visualize the expression levels of surface markers in each cell cluster, heat map analysis was employed (Figure 9C).

3.5. Ezh1 Knockout Suppresses the Expression of Immune Checkpoint Molecules in Dengue Infection
We conducted a comprehensive analysis of the expression of immune checkpoint molecules PD-1, LAG-3, CD86, and CD62L using t-SNE dimension reduction and created heatmaps across the three experimental groups (Figure 10).
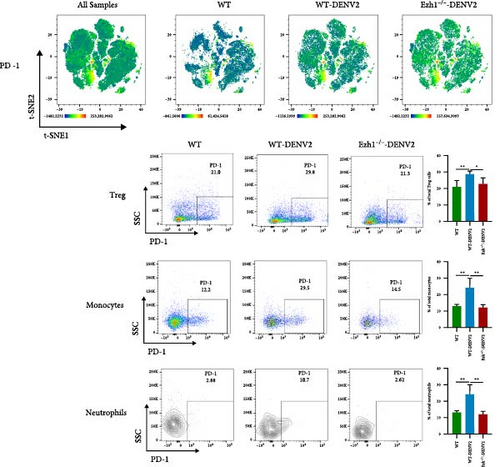
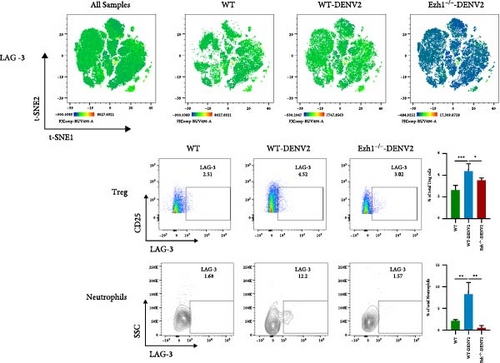
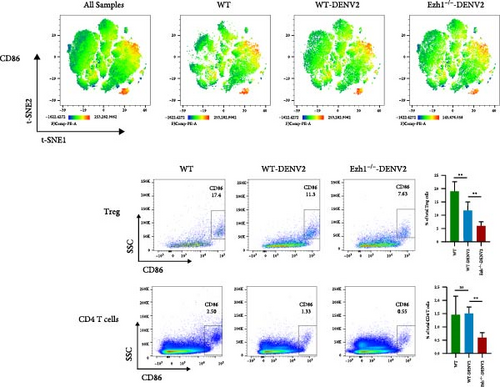
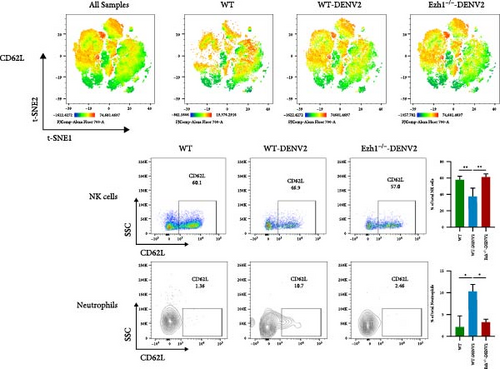
When compared to the WT mice group, we observed downregulation in the expression of PD-1 on Tregs, monocytes, and neutrophils within the Ezh1−/− mice group following DENV infection (Figure 10A). The expression of LAG-3 on Tregs and monocytes, as well as CD86 on Tregs and CD4 T cells, displayed a consistent downregulation (Figure 10B, C). Ezh1 knockout also led to the inhibition of CD62L expression in neutrophils, while promoting CD62L expression in NK cells post-DENV infection (Figure 10D). These findings collectively demonstrate the impact of Ezh1 knockout on the regulation of immune checkpoint molecules in the context of dengue infection.
4. Discussion
The global incidence of dengue has surged significantly over the past few decades. Reports to the WHO show a rise from 505,430 cases in 2000 to 5.2 million in 2019 [12]. Most cases are either asymptomatic or mild and are managed without professional intervention, leading to an underestimation of the true number of cases [12]. Additionally, many cases are misdiagnosed as other febrile illnesses [22]. In 2023, the highest number of dengue cases ever recorded was reported, impacting over 80 countries across all WHO regions [12]. Dengue illness is clinically classified as either dengue with or without warning signs or severe dengue, a classification introduced by the WHO in 2009 to improve clinical management [10]. Previous infection with DENV increases the risk of the individual developing severe dengue and the mortality rate for severe dengue is extremely high [12]. This is thought to be related to the antibody-dependent enhancement (ADE) phenomenon caused by infection with different serotypes of DENV, which ultimately leads to the development of a “cytokine storm”. In light of this, investigating the role of Ezh1 in DENV infection takes on added significance. In our previous study, we found that the let-7e/Ezh2/H3K27me3/NF-kB p65 pathway is a novelrequlatory axis of TNF-α expression [8]. Inhibitors of Ezh2/1 induce a potent antiviral state and uppress infection by diverse viral pathogens [6].Therefore, we hope to further explore the impact of Ezh1 on DENV infection. Such an exploration may provide valuable insights into the potential mechanisms and physiological importance of epigenetic molecules in the context of immune responses to inflammation. The clinical relevance of such discoveries could be profound, as they hold the promise of advancing our understanding of these diseases and potentially informing therapeutic strategies for tackling them.
Therefore, we used Luminex liquid chip technology to analyze the levels of various cytokines and chemokines in the supernatants collected from DENV2-infected BMDM. Following DENV2 treatment, several factors including IL-1α, IL-3, IL-5, IL-9, IL-12(p40), IL-12(p70), IL-13, IL-16, IL-17A, CCL-1, CCL-4, CCL-20, CXCL13, Eotaxin, and G-CSF were significantly upregulated, and these elevated levels were nearly restored to control group levels in Ezh1 knockout mice.
Besides, the transcriptome analyses of bone marrow and spleen from Ezh1 knockout mice and WT mice yielded several noteworthy observations. In the bone marrow of male Ezh1−/− mice compared to WT mice, gene differences primarily revolved around cell molecular adhesion. Conversely, in females, these differences were concentrated in autoimmune diseases, IL-17 and TNF signaling pathways, viral protein interaction with cytokines and cytokine receptors, and cytokine–cytokine receptor interaction. Interestingly, in male mouse spleens, the gene variances in Ezh1−/− mice versus WT mice were mainly linked to the IL-17 signaling pathway, cytokine–cytokine receptor interaction, and viral protein interaction with cytokines and cytokine receptors. However, such concentration was not observed in female mice. Surprisingly, while female Ezh1−/− mouse bone marrow and male Ezh1−/− mouse spleen presented enrichment in IL-17 signaling, cytokine–cytokine receptor interaction, and viral protein interaction with cytokines and cytokine receptors, the specific genes involved in these pathways differed significantly between the two groups. Notably, recent research has highlighted a link between an upregulation of Cox2, a key enzyme associated with inflammation, in the IL-17 signaling pathway and the promotion of DENV replication [23, 24]. Intriguingly, our study presents a contrary finding, showing a downregulation of Cox2 expression in the spleen of male Ezh1−/− mice when compared to WT mice. These findings contribute valuable insights to our understanding of the regulatory mechanisms in DENV infection and IL-17 signaling pathways.
At this point, we focused on IL-17. IL-17 is a cytokine produced by various immune cell types, including CD4+ T helper 17 (Th17) cells, CD8+ T cells, γδ T cells, NKT cells, and innate lymphoid cells [25]. IL-17 is primarily secreted by Th17 cells and plays a crucial role in both adaptive and innate immunity [25]. IL-17 is involved in regulating the protective and pathogenic immune response [26]. IL-17A may play an important role during the “cytokine storm” and, contributes to dengue immunopathogenesis [26–29]. Il-22−/− mice infected with DENV serotype 2 present greater disease severity, characterized by intense inflammation, liver damage and high production of IL-17A in the spleen and liver, compared with WT mice [30]. Notably, significant increases which were accompanied by high IL-9 and IL-17 concentrations were detected in DHF and DSS patients [31]. Our findings indicate that Ezh1 knockout in BMDM cells inhibits virus-induced IL-9 and IL-17, suggesting the crucial role of Ezh1 in the pathogenesis of severe reactions in DF.
Research indicates that NK cells are activated in the early stages of DENV infection. Their capacity to release cytolytic granules has been well-established, highlighting their essential role as a primary defense mechanism against DENV-infected cells [32]. Studies had shown that the phenotypic distribution of peripheral blood lymphocytes varies among patients with different severities of DF [33]. NK cells are divided into two main subsets based on their CD56 and CD16 expression. The CD56bright and CD16dim/neg subset is highly active in cytokine production, whereas the CD56dim/neg and CD16pos subset is primarily cytotoxic and carries KIRs and other inhibitory receptors [32]. Recent studied have found that during acute DENV infection, although the frequency of NK cells remains unchanged, the frequency of the CD56bright subset remains stable in severe dengue patients, while it significantly increases in patients with milder symptoms [34]. Simultaneously, characteristics of hyperinflammation are linked to the severity of dengue, such as elevated biomarkers, compromised NK cell function, and genetic polymorphisms in NK cell cytolytic function genes (KLRK1 and PRF1) [35]. Our research findings indicate that Ezh1 knockout appears to increase the number of NK cells during DENV infection, which might suppress inflammation. However, the impact of Ezh1 knockout on NK cell differentiation still requires further exploration in the future.
An increase in Tregs often signifies a negative impact as they function to restrain excessive immune responses, thus, potentially diminishing antiviral efficacy. However, some studies suggest that in the context of severe viral infections, changes in Tregs function can be seen either as an adaptation by the pathogen to evade the immune system or as a host strategy to reduce collateral damage caused by the immune response [36]. During the acute phase of a viral infection, Tregs can have a dual role, either protective or pathogenic. On the one hand, a suppressive Tregs response might be harmful early in the disease progression by inhibiting the activation and function of antigen-specific T-cells and preventing Tregs death, which can interfere with effective and timely viral clearance [37]. On the other hand, Tregs can also suppress pro-inflammatory signals, potentially offering protection against cytokine storms and tissue damage [37]. Our research findings indicate that Ezh1 knockout appears to increase the number of NK cells during DENV infection, which might suppress inflammation. However, whether the suppression of Tregs levels affects DENV infection still requires further investigation in the future.
In sepsis, the role of the PD-1 signaling pathway involves the innate and the adaptive immune system, which can lead to T cell exhaustion, apoptosis, impaired its proliferation, reduced production of pro-inflammatory factors, and enhanced secretion of anti-inflammatory factors [38]. Upregulation of programmed cell death 1 ligand 1 (PD-L1) on neutrophils may be involved in sepsis-induced immunosuppression [38]. Elevated levels of PD-1 have been associated with cellular dysfunction, and an increase in PD-1 expression in monocytes in septic mice has been linked to a decrease in their phagocytic function [38]. PD-1 has been explored as a potential marker for evaluating peripheral blood monocytes or macrophages dysfunction in septic patients and septic mice [38]. It was showed human leukocyte antigen (HLA) 35:01 DENV-specific T cells were associated with marked expression of PD-1 and raises the hypothesis that PD-1 might be a regulator that prevents excessive damage while preserving antiviral function [39]. In our study, we observed that Ezh1 knockout inhibited the expression of PD-1 on Tregs, monocytes, and neutrophils following DENV infection. The funcrions of PD-1+ Tregs, monocytes, and neutrophils need to be further investigated in the future.
A study has proposed that LAG-3 serves as a marker for regulatory T cell populations and contributes to their suppressor activity [40]. These CD4+, CD25−, and LAG-3+ regulatory T cells have demonstrated suppressive activity in murine models of lupus and humoral immunity, with this effect being TGF-β3-dependent. LAG-3 has garnered significant attention due to its association with T cell tolerance and its role in exhausted T cells present in the tumor microenvironment [41]. In our study, we observed that Ezh1 knockout inhibited the expression of LAG-3 on Tregs after DENV infection. The impact of LAG-3 in Tregs on DENV infection should be further explored in future studies.
The presence of CD86 on a subset of activated Tregs implies a role for these costimulatory molecules in regulating the dynamics of CD4+ T cell responses [42]. In our study, we observed that Ezh1 knockout inhibited the expression of CD86 on Tregs and CD4 T cells. Besides, CD62L marks a mature NK cell subset, as well as affects the magnitude of the local NK cell response to viral infection [43]. In addition, it has been reported that CD16brightCD62Ldim neutrophils are elevated in patients with sepsis-associated ARDS and are associated with infectious complications and poor prognosis [44]. Interestingly, our experiments found that Ezh1 knockout also led to the inhibition of CD62L expression in neutrophils, while promoting CD62L expression in NK cells post-DENV infection. The impact of high or low expression of CD86 and CD62L on immune cells in response to DENV infection still needs further investigation.
Our findings underscore the significant role of Ezh1 in DENV infection. Targeting Ezh1 may not only exert antiviral effects but also mitigate the inflammatory response, thereby, offering a novel therapeutic target for the treatment of DF.
Conflicts of Interest
The authors declare no conflicts of interest.
Author Contributions
Danping Liu and Ningxin Tan contributed equally to this work.
Funding
This work was supported by Science and Technology Program of Guangzhou, China (Grant 202103000007), National Natural Science Foundation of China (Grant 81871238), Natural Science Foundation of Guangdong Province (Grants 2021A1515010435 and 2024A1515010148), Guangdong Provincial Key Laboratory of Organ Donation and Transplant Immunology, The First Affiliated Hospital, Sun Yat-sen University, Guangzhou, China (Grants 2017B030314018, 2020B1212060026, and 2023B1212060020), Guangdong Provincial International Cooperation Base of Science and Technology (Organ Transplantation), The First Affiliated Hospital, Sun Yat-sen University, Guangzhou, China (Grant 2020A0505020003), and Guangdong Provincial Funds for High-end Medical Equipment (Grant 2020B1111140003).
Acknowledgments
We thank Prof. Xun Zhu, from Zhongshan School of Medicine, Sun Yat-sen University, for providing Dengue 2 virus New Guinea C strain and C6/36 cell line.
Open Research
Data Availability Statement
The data used to support the findings of this study are available from the corresponding author upon request.


