Optimization Design of Phononic Crystals Based on BPNN-MPA in Applied Mathematical Analysis
Abstract
Traditional finite element analysis methods have the problem of expensive and unstable band structure diagram calculation when generating phononic crystals. Therefore, this study combines back propagation neural networks with ocean predator algorithms to optimize the geometric structure of phononic crystals. The results show that the coefficient of determination for the predicted bandgap width and lower bound of Model 3 is 1.00, which is better than the comparison model. However, Models 2 and 5 have poor predictive performance for bandgap width due to overfitting during actual training. Therefore, after using the ocean predator algorithm for hyperparameter adjustment, it is found that the maximum number of failures in the validation set of Model 5 is 30, the number of hidden layer nodes is 30, and after 500 experiments, the average error of the bandgap width is 5.26%, and the average error of the lower bound of the bandgap is 1.33%. The average error of the bandgap width after hyperparameter adjustment is 4.89%, and the average error of the lower bound of the bandgap is 1.21%, both of which are effectively reduced and better than the comparison model. Overall, the combination model has high computational efficiency and stability in phononic crystal optimization and can be practically applied in the design and optimization of phononic crystal geometric structures.
1. Introduction
In actual engineering structural excitation, there are dynamic loads caused by natural reasons as well as dynamic loads caused by social activities. Among these loads, the hazards and protective measures brought about by shock wave collisions, earthquakes, and traffic environment vibrations are gradually receiving attention [1]. The existing vibration and noise reduction measures mainly rely on the energy absorption of materials and the response of elastic waves. Among them, the energy absorption generated by damping materials under the action of shock waves can cause significant damage to the materials and cannot effectively suppress the elastic waves in the target frequency band [2]. Phononic crystals are artificially synthesized materials that use periodic arrangements of two or more different materials. By using microstructure units to control the material’s bandgap characteristics, noise and vibration can be effectively reduced [3]. However, generating the band structure diagram of phononic crystals is a computationally expensive process that relies on many parameters, and the commonly used finite element method (FEM) is unstable and time-consuming for analyzing complex primary cell microstructures. Based on this, a study was conducted to select a back propagation neural network (BPNN) inspired by biological neural networks in artificial intelligence optimization algorithms to construct a mapping between the mathematical geometric structure of phononic crystals and bandgap parameters. The marine predator algorithm (MPA) algorithm was used to perform global multiobjective optimization on the trained phononic crystal neural network model. Thus, BPNN-MPA is constructed to optimize the design of phononic crystals. Its purpose is to save time on current phononic crystal design and manufacturing and optimize the geometric structure of phononic crystals accordingly.
The research is divided into four parts. The first part summarizes the current research on optimizing the design of phononic crystal structures. The second part is to study the optimization design of phononic crystals in applied mathematical analysis. The third part is to validate the BPNN-MPA proposed in the study. The fourth part is a summary of the entire article.
2. Related Works
As a high-performance metamaterial, phononic crystals have significant bandgap characteristics that enable their research to effectively control the vibration of noise. At the same time, purposefully adjusting the material composition and geometric configuration has potential value in developing perfect acoustic reflectors, sound isolators, and waveguide surfaces [4]. Therefore, scholars both domestically and internationally have conducted research on it. Lu and Huang proposed a method for optimizing the geometric structure of two-dimensional phononic crystals under the action of elastic waves by using the plane wave expansion method, aiming to address the related issues in optimizing the structure of two-dimensional phononic crystals. This not only optimized the resonance characteristics but also enhanced the optimization effect of phononic crystals [5]. Katch et al. focused on the defect problem in the manufacturing of phononic crystals in practical applications and conducted an in-depth analysis of their defect behavior and modeling of their defect cell using the wave FEM method, thereby optimizing their defect design and reducing computational costs [6]. Li, Liu, and Song addressed the issue of the inefficient calculation method of the Wiener phononic crystals themselves and constructed a one-dimensional phononic crystal wave dynamics model using the nonrestricted FEM method. This laid a theoretical foundation for the application of the Wiener phononic crystal structures while strengthening the elastic wave effect [7]. Jo and Lee conducted an in-depth analysis of the energy localization characteristics of phononic crystals with piezoelectric defects by using the FEM method to optimize the structure of phononic crystals. This effectively improved the prediction ability and computational efficiency on the basis of constructing a theoretical model [8].
In addition, the development of computer technology has also led to the gradual rise of artificial intelligence algorithms, which have provided new ideas for the design of phononic crystals. Miao et al. proposed a method for optimizing the structure design of two-dimensional phononic crystals by utilizing deep neural networks to address the issue of wave propagation efficiency in phononic crystals. This not only improved the accuracy of predicting the band boundaries of two-dimensional phononic crystals but also improved efficiency [9]. Yera et al. addressed the optimization problem of phononic crystal microstructure by utilizing grid search and neighboring point methods to enhance the feature function of the optimized phononic crystal cell, thereby improving the structural design method of phononic crystals through a joint concept approach [10]. Liu and Yu addressed the optimization design problem of phononic crystals and elastic metamaterials by utilizing deep learning to construct a new method for forward prediction and design of phononic crystals, thereby improving the accuracy and speed of the design [11].
From the research of domestic and foreign scholars, it can be seen that the current plane wave expansion method for studying phononic structures has some inherent defects when dealing with metamaterials with significant differences in elastic properties. However, FEM has disadvantages such as poor stability and expensive calculations when dealing with complex structures. At the same time, its inherent computational complexity also restricts the rapid development of phononic crystals. In addition, deep neural networks commonly used in artificial intelligence algorithms inevitably suffer from gradient vanishing and network degradation when training phononic crystal models, as well as overfitting and underfitting. Grid search, random search, and Bayesian algorithms all consume too much time when there are many parameters. Therefore, the study combines BPNN and MPA inspired by biological neural networks, theoretically solving the problem of overfitting in neural network algorithms and effectively improving computational efficiency. In fact, it also greatly saves the time required for the design and manufacturing of phononic crystals, making it innovative.
3. Optimization Design of Phononic Crystals in Applied Mathematical Analysis
In the application of mathematical analysis, traditional FEM has the problem of expensive and unstable band structure diagram calculation when generating phononic crystals. Therefore, this section mainly uses BPNN to construct the mapping between the mathematical geometric structure of phononic crystals and bandgap parameters and uses MPA to globally optimize the trained phononic crystal neural network model, thereby obtaining the optimal phononic crystal geometric parameters using BPNN-MPA.
3.1. Problem Description and Analysis of Phononic Crystal Dispersion Characteristics
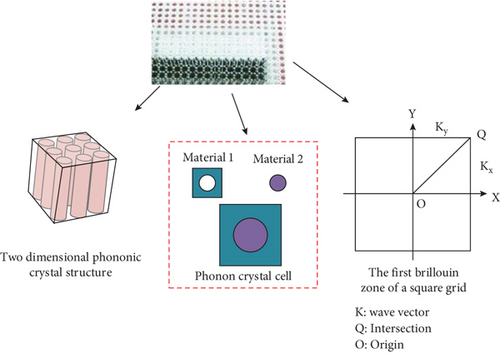
In Equation (1), ps and qs denote the cross and longitudinal directions with the circle as the origin and qs as the radius. ϕ denotes the scatterer rotation angle, whose value is between [0, 2π]. s0 denotes the parameter controlling the size of the scatterer core. a1 and a1 denote the parameters controlling the shape of the scatterer core. δ and γ denote the natural numbers. b denotes the length of the unit lattice. c denotes the initial porosity. The embedded shape starting from the cross-shaped core utilizes the modification of the length, width, and rotation angle of the cross to generate the relevant scatterers and applies these parameters to control the size and shape of the cross scatterers. Conventionally, phononic crystals can be categorized as fluid/fluid, solid/solid, fluid/solid, and solid/fluid phononic crystals, and when there are only longitudinal waves in the medium, there is a mixing of longitudinal and transversal waves with different velocities in the medium. However, the analysis of solid/liquid-type phononic crystals requires the simultaneous consideration of the solid–liquid phases, which makes the study of this problem difficult. The conventional method is used to calculate the bandgap of the flow-solid coupling type phononic crystal by utilizing FEM, in which the two-dimensional phononic crystal structure and the phononic crystal cell are schematically shown in Figure 1.
In Equation (8), Kl and Kj denote the strain matrix in the elastic domain and the pressure gradient in the fluidic domain.
3.2. Bandgap Parameter Prediction and Optimization Based on BPNN-MPA
In Equation (15), ƛY denotes the random number at [0,1]. μ denotes the random number. ϒ denotes the random binary matrix. ρτ1 and ρτ2 subscripts denote the random indexed prey matrix. C denotes the dimensionality vector, and FADs denote the probability of influence, which has the value of 0.2. Ultimately, the flow of the study for the design and optimization of the bandgap of the phononic crystal on the basis of the BPNN-MPA algorithm is shown in Figure 2.
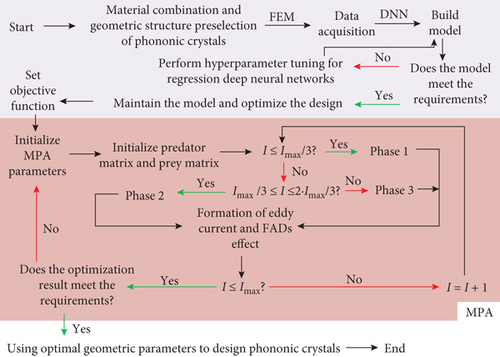
The BPNN-MPA model constructed through research is divided into three stages. The first stage is data collection, the second stage is the establishment of the initial model, and the third stage is the iterative optimization of MPA. When optimizing the bandgap design of phononic crystals, it is necessary to first preselect the materials and geometric structures of the phononic crystals, collect corresponding data, and establish an initial model. If the initial model meets the requirements, the model will be updated and optimized. If it does not meet the requirements, data modeling will be collected again until the model meets the requirements. Design an objective function for the model that does not meet the requirements and initialize the parameters of MPA. After completing the initialization of the optimization algorithm, it can start running until the optimal result is output or the maximum number of iterations is reached, and the design optimization of phononic crystals can be completed. In Figure 2, the flow models the energy band properties of phononic crystals through the BPNN model to achieve fast and accurate measurement of the energy band parameters, especially the acquisition of the energy band information, thus avoiding the problem of time-consuming traditional FEM calculations. On this basis, the performance of BPNN in dealing with complex structured phononic crystals is improved by superparameter adjustment of BPNN. Finally, the MPA is utilized to perform global multiobjective optimization of the neural network, so as to obtain the optimal phononic crystal structure parameters.
4. Numerical Experiments on Phononic Crystals
To verify the effectiveness of BPNN-MPA, the study in this section mainly focused on the numerical experiments of phononic crystals, including the analysis of the accuracy of the model in BPNN-MPA, the effectiveness of the MPA in adjusting the hyperparameters, and the effectiveness of the optimal design of the mathematical geometrical structure of the phononic crystals.
4.1. Validation Results of the BPNN Model
The study was mainly validated in the form of arithmetic examples. The first example was a liquid phononic crystal containing holes with mercury as the substrate and air as the scatterer, and the shape of the holes was used as the starting point to establish the hole topology. The hyperparameters δ and γ were set to 4 and 8, c to 0.4, and b to 10 mm, and a total of 1010 data sets were used, with 70% as the training set, 15% as the validation set, and 15% as the test set. In the BPNN model, the setting of various parameters directly affects the training results of the model. According to the research results of Chen et al., the hidden layer of the model is set to 1 layer, the weight is set to 0.3, the bias is 0, the learning rate is 0.001, and the momentum is 0.92 [19]. The training process of pore flow phononic crystals and the predicted bandgap parameters of Model 1 are shown in Figure 3.
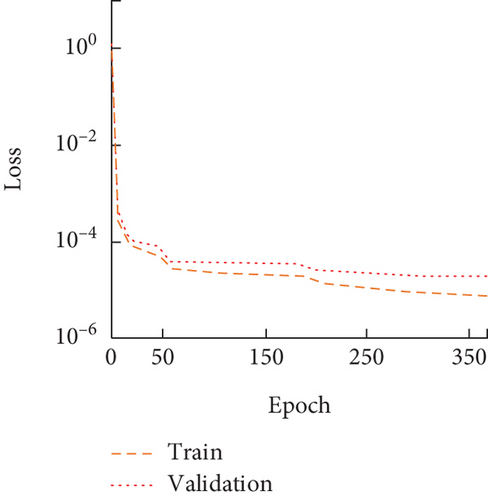
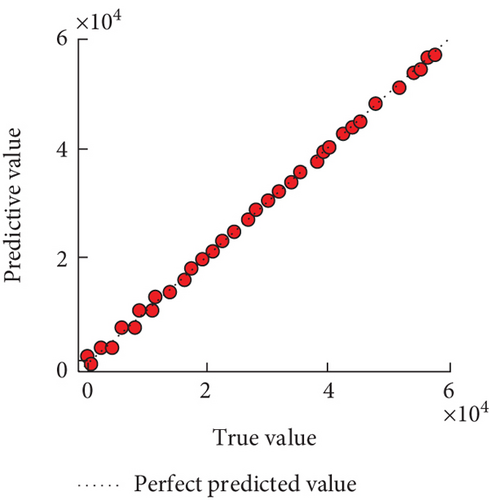
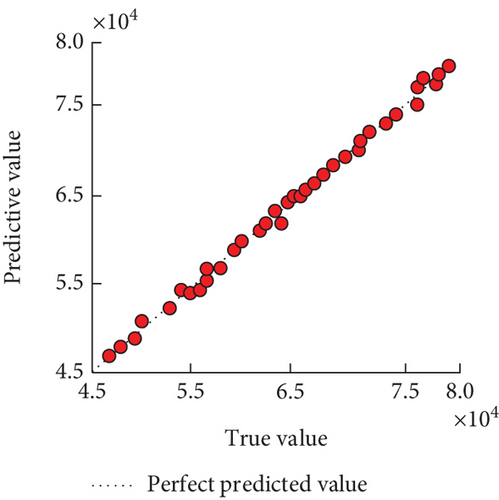
In Figure 3(a), the actual training of Model 1 was very good, with the training maintenance below 1e − 4 after 20 rounds. In Figure 3(b), the prediction results of the test set showed that the phononic crystal is predicted to have either a bandgap or a negative value of the bandgap width at the actual bandgap width of 0. Neither of them actually had a bandgap present. The coefficients of determination for the predicted bandgap width and the lower bound were 0.999 and 0.998, respectively, as can be seen in Figure 3(c). In addition, the second calculus was set up in the same way for solid phononic crystals with cavities, with δ and γ of 3 and 6, c of 0.25, and b of 10 mm, for a total of 609 samples. The third counting case was a fluid phononic crystal with a water matrix material and a mercury scattering material, with a c of 10 mm and a total of 61 data sets. The fourth algorithm was for solid/solid phononic crystals with c and γ of 4 and 8, c of 0.3, and b of 10 mm, for a total of 475 data sets. The fifth calculus was a fluid/solid phononic crystal with aluminum as the base material and water as the scatterer material, with a total of 546 samples, and the four calculus were set up as Models 2, 3, 4, and 5, respectively. The four models took the same training method as the fluid phononic crystal neural network with cavities, and then, the error evolution process of its training and validation sets is shown in Figure 4.
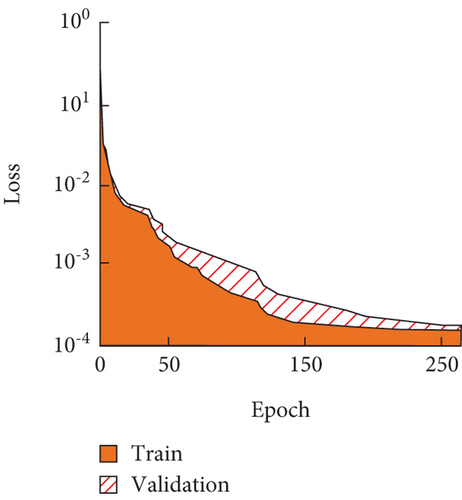
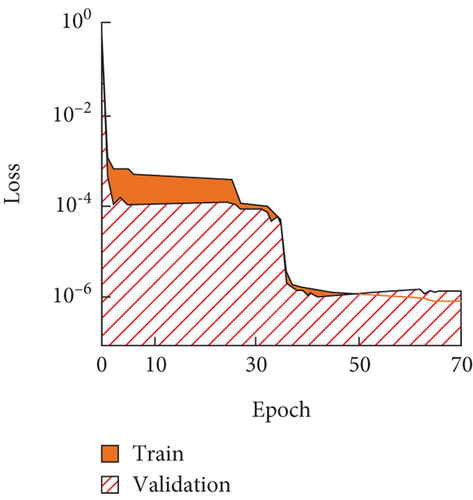
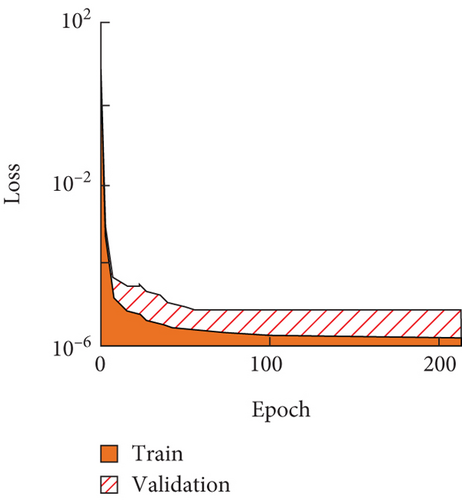
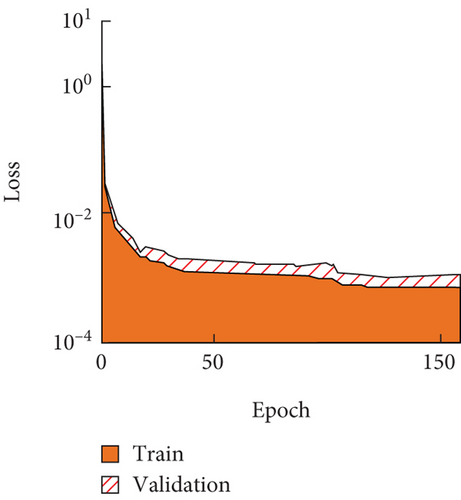
From Figure 4(a), Model 2 had a rapid decline in loss values from 0 to 100 rounds before converging after 250 rounds. Model 2 continued its loss value tendency to decrease after 250 iterations during training. From Figure 4(b), Model 3 completes convergence after 40 iterations, and the loss value is less than 10−6. From Figures 4(c) and 4(d), the decline in loss values of Models 4 and 5 tended to stabilize after a round number of 5. Among the four models mentioned above, the loss value of Model 1 did not show a convergence trend after 250 iterations. Model 3 completed convergence after 40 iterations, and the converged loss value was less than 10−6. Both Model 4 and Model 5 converged quickly, but their converged loss values were all greater than 10−6. Taken together, Model 3 had the best practical training results due to its simple scatterer geometry. On this basis, the predicted phonon crystal bandgap widths for the four models are shown in Figure 5.
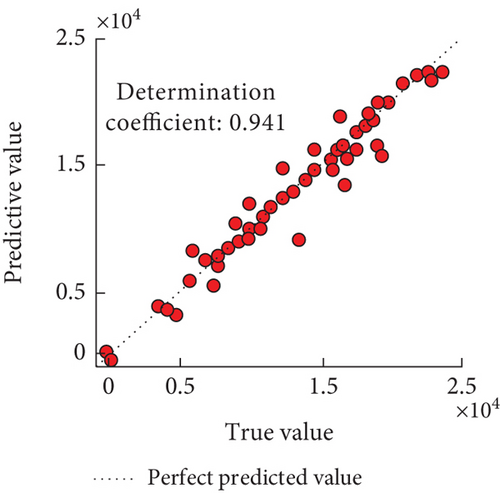
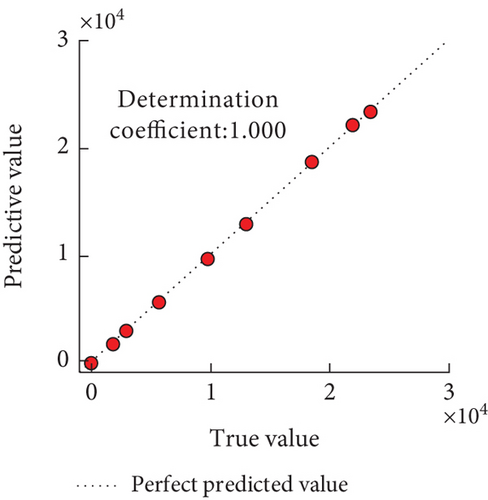
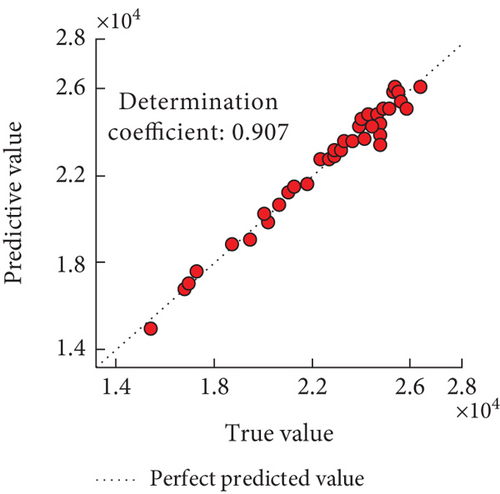
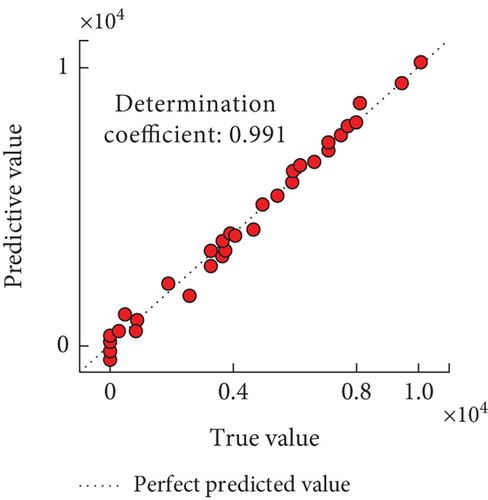
From Figures 5(a) and 5(b), the coefficients of determination of predicted bandgap widths for Models 2 and 3 were 0.941 and 1.000, respectively, and the values for Model 3 were closer to the actual values. From Figures 5(c) and 5(d), the coefficients of determination of the predicted bandgap widths of Models 4 and 5 were 0.907 and 0.991, respectively. Taken together, the coefficients of determination of Model 3 were higher, and the performance was the best. And the predicted results of the lower boundary of the phononic crystal bandgap for the four models are shown in Figure 6.
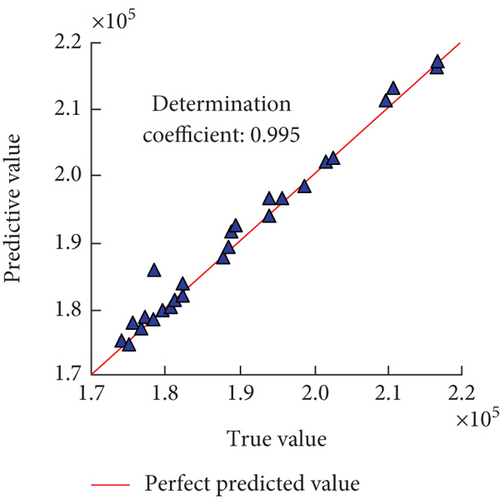
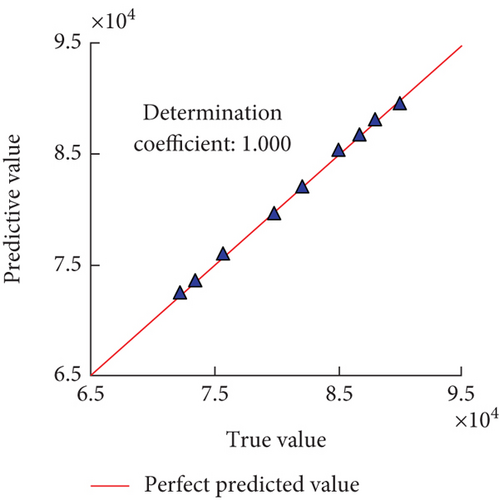
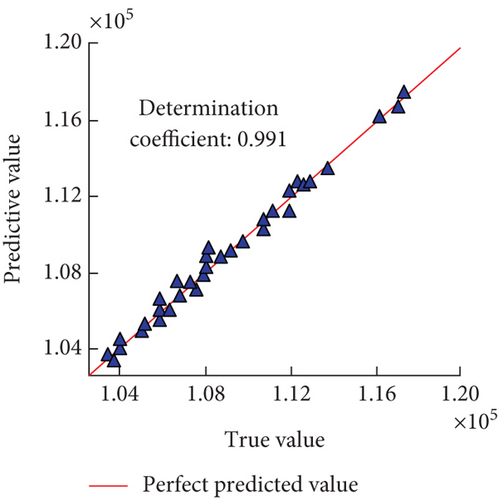
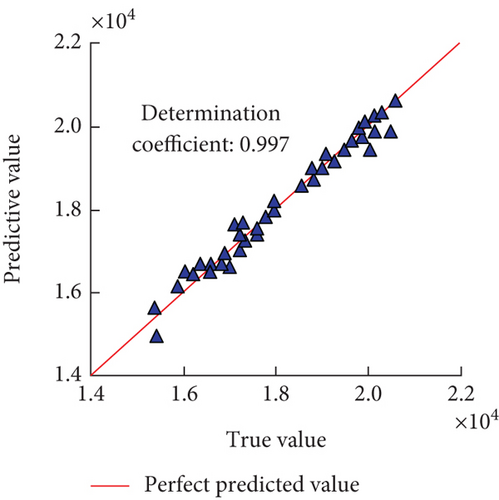
From Figures 6(a) and 6(b), the coefficients of determination of the lower bound of the predicted bandgap were 0.995 and 1.000 for Models 2 and 3, respectively, and the value for Model 3 was closer to the actual value. In Figures 5(c) and 5(d), the coefficients of determination for predicting the lower bound of the bandgap for models 4 and 5 were 0.991 and 0.997, respectively. Combining Figures 5 and 6, Models 2 and 5 were ineffective in predicting the width of the bandgap, but comparing with Figure 4, the two models were more excellent in terms of the training effect, which showed that the neural network model has overfitting phenomenon during the actual training process, and the overall BPNN model can accurately predict the bandgap parameters of phononic crystals under different geometrical structures in a short time.
4.2. MPA-Based Hyperparameter Tuning and Phonon Crystal Structure Verification
The BPNN is prone to overfitting and underfitting phenomena like Models 1 and 4 when using the FEM method for phononic crystal data acquisition, so the study utilized the MPA to tune its hyperparameters to validate the effect of hyperparameters on the model. The testing process used Model 3 with insufficient training for experimentation and modified its training frequency and number of hidden layer nodes. Each group conducted a total of 500 experiments. The size of the population in MPA will affect the search space and search efficiency of the optimal solution. According to the research results of Al-Betar et al., the initial population size can be set between 30 and 100. In the experiment, the initial population size was set to 50 [20]. The average and maximum errors were also used as dimensionless errors to evaluate the performance of the BPNN. Among the results, the error distribution of Model 4 itself in the test set is shown in Figure 7.
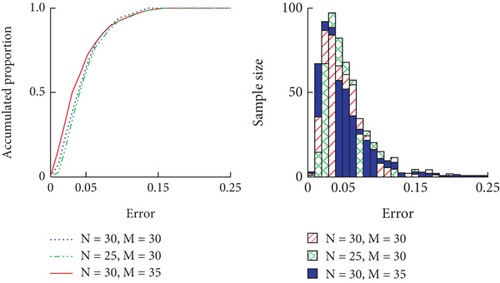
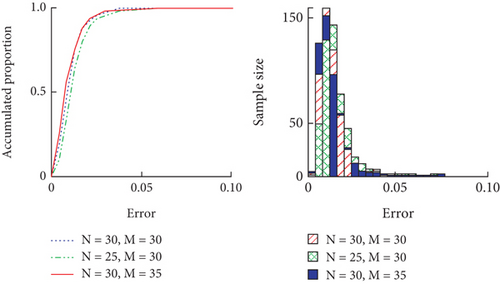
In Figure 7, M denotes the maximum number of failures. N denotes the number of hidden nodes. From Figures 7(a) and 7(b), the maximum number of failures in the validation set was 30, the average error of the bandgap width was 5.26% when the number of hidden layer nodes was 30, and the maximum error was 20.06%, and the average error of the bandgap lower bound was 1.33%, and the maximum error was 7.16%. The average error of bandgap width and lower bound was 4.97% and 1.28%, respectively, when the maximum number of failures was 35, and the maximum error was 25.50% and 7.28%. The average errors of bandgap width and lower bound for a hidden layer node count of 25 were 5.59% and 1.55%, and the maximum errors were 19.58% and 7.16%. Taken together, the performance of the model could be improved by appropriately increasing the number of training and regulating the number of hidden layer nodes, while reducing the complexity of the model could prevent overfitting to some extent. Therefore, the study sets the number of hidden nodes to 30, and the test set error distribution of Model 4 after hyperparameter tuning using MPA is shown in Figure 8.
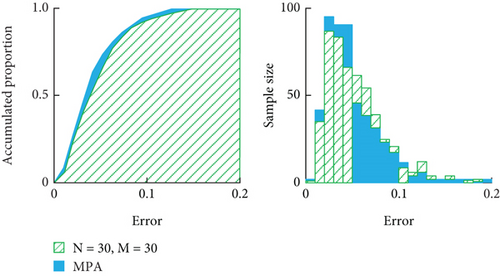
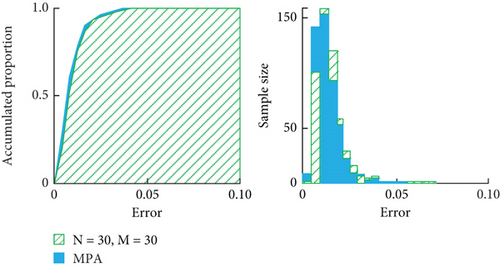
From Figures 8(a) and 8(b), the combination of hyperparameters obtained by searching with MPA was 200 maximum iterations, a learning rate of 0.2, and 22 hidden layer nodes, at which time the average errors of the bandgap widths and lower bounds were 4.89% and 1.21%, and the maximum errors were 19.49% and 5.60%. Comprehensively, the BPNN after hyperparameter tuning by MPA had better robustness. In order to further verify the superiority of the MPA, the study introduced the particle swarm optimization (PSO) algorithm and genetic algorithm (GA) for comparison. Then, the evolution of Model 4 under the optimization of the three algorithms is shown in Figure 9.
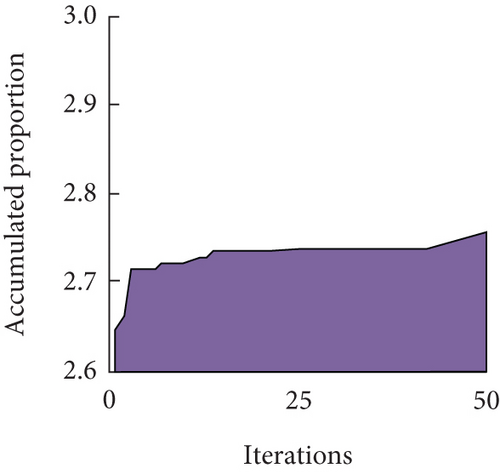
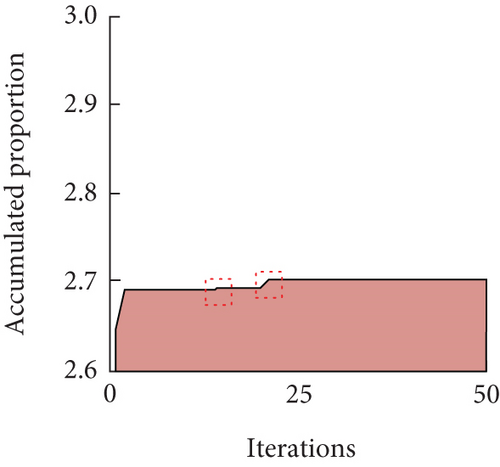
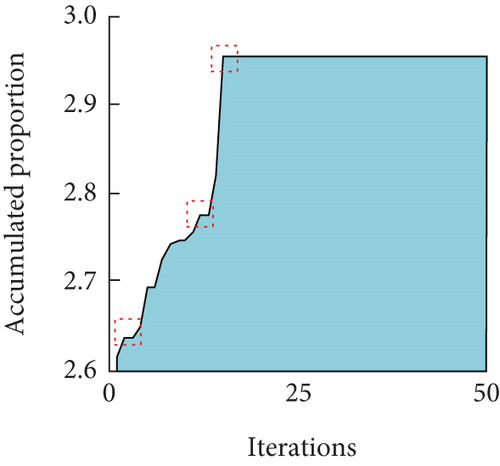
From Figure 9(a), the PSO algorithm started to rise smoothly after the number of iterations was three. From Figure 9(b), there were two jumps in the GA, that is, they occurred around iteration numbers of 2 and 20. From Figure 9(c), the MPA existed three distinct jumps, indicating that when the actual evolution process stagnated at the current stage, the correct direction could be explored at the next stage by changing the evolution strategy. Taken together, the MPA had high robustness and computational efficiency. On this basis, the study used three algorithms to evaluate the optimization ability of the three algorithms by comparing the evolution results of Models 1, 2, 3, and 5. Among them, the evolution results of Models 1 and 2 are shown in Table 1.
| — | GA | PSO | MPA |
|---|---|---|---|
| Model 1 | |||
| Best fitness | 45,645.37 | 47,106.95 | 47,164.95 |
| a1 | −0.35 | 0.20 | 0.20 |
| a2 | −0.23 | −0.10 | −0.10 |
| ϕ | 40.93 | 0.00 | 90.00 |
| Time | 47.96 s | 22.41 s | 46.11 s |
| Model 2 | |||
| Best fitness | 52,338.73 | 57,854.31 | 66,786.83 |
| a1 | −0.35 | −0.27 | −0.33 |
| a2 | −0.23 | −0.35 | −0.33 |
| ϕ | 40.93 | 95.32 | 0.00 |
| Time | 47.96 s | 23.67 s | 47.23 s |
From Table 1, the optimal fitness values of MPA on the two models were 47,164.95 and 66,786.83, which were higher than the comparison algorithm, but the training time was higher than the PSO algorithm. Taken together, the MPA was better optimized than the comparison algorithm under the same computation time for both models. The evolution results of Models 3 and 5 are shown in Table 2.
| — | GA | PSO | MPA |
|---|---|---|---|
| Model 3 | |||
| Best fitness | 28,837.12 | 28,837.76 | 28,837.76 |
| Radius | 4.50 | 4.50 | 4.50 |
| Time | 16.74 s | 6.33 s | 8.79 s |
| Model 5 | |||
| Best fitness | 27,047.27 | 27,560.23 | 29,557.65 |
| Cross rotation angle | 90.00 | 2.01 | 0.00 |
| Cross width | 2.42 | 2.62 | 3.21 |
| Time | 20.70s | 6.33 s | 10.76 s |
From Table 2, the optimal fitness value of MPA in Model 3 was the same as PSO, which was 28837.76, and the values of the radius parameter in the optimization result values of the three models were the same, while the time consumed by the MPA was 8.79 s, which was much lower than that of the GA. On the whole, MPA had a better optimization effect and the ability to search for the optimal value, as well as higher stability and accuracy. Finally, based on the MPA, the optimal results of the model under different objectives were investigated, and a total of three scenarios were set up, that is, the bandgap widths and lower bounds were 1.0 and 0.1, 0.8 and 0.3, and 0.4 and 0.4. Then, the optimization results of MPA for Model 4 under different scenarios are shown in Figure 10.
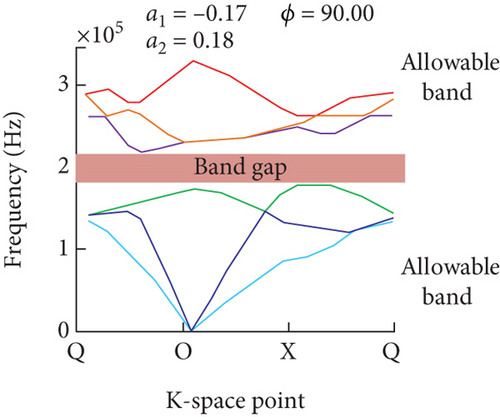
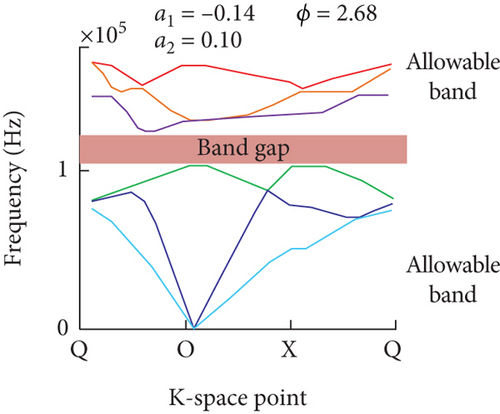
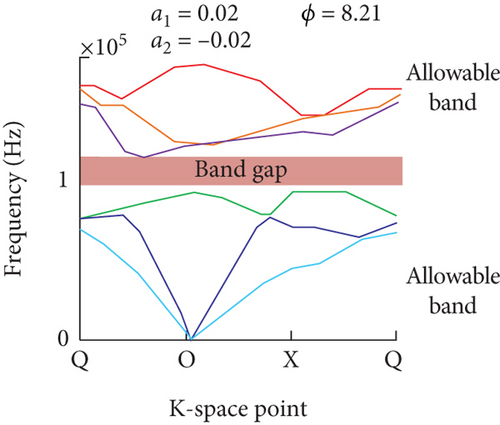
The Brillouin zone parameters from Figure 1 are used for the horizontal axis in Figure 10. From Figure 10(a), the optimization results of a1, a2, and ϕ under the optimal bandgap width scheme were −0.17, 0.18, and 90.00, respectively. From Figure 10(b), the optimization results of the three parameters that pay more attention to the lower bound of the bandgap were −0.14, 0.10, and 2.68, respectively. From Figure 10(c), the results of the bandgap width with the lower bound were 0.02, −0.02, and 8.21, respectively. Taken together, there was a match between the expected design requirements and the actual bandgap, and it also proved that the MPA can handle complex phononic crystal optimization problems.
5. Conclusion
Aiming at the problem of expensive and unstable calculation of energy band structure maps in generating phonon crystals by traditional FEM, the study proposed the BPNN-MPA to optimize the design of phonon crystals and verified its effectiveness. The experimental results showed that in the BPNN performance analysis, the coefficients of determination of Model 1 for predicting the bandgap range and the bandgap lower-bound frequency performance were 0.999 and 0.998, respectively. Model 2 had the best practical training effect due to its simple scatterer geometry. In the validation of the MPA, the average error of the superparametric combined bandgap width obtained by using the MPA search was 4.89%, and the maximum error was 19.49%. The average error of the lower bound of the bandgap was 1.21%, and the maximum error was 5.60%, while the MPA existed three obvious jumps, which is better than the comparison algorithm. In addition, the optimization results of a1, a2, and ϕ under the optimal bandgap width scheme were −0.17, 0.18, and 90.00, respectively, which match with the actual bandgap. Taken together, the BPNN-MPA algorithm possessed high efficiency and stability in the phononic crystal time-energy band structure map algorithm. However, the MPA is easy to fall into local optimality in more complex problems, so the FAD parameters need to be specified and analyzed subsequently to avoid the model falling into local optimality.
Conflicts of Interest
The author declares no conflicts of interest.
Funding
The author received no specific funding for this work.
Open Research
Data Availability Statement
The data used to support the findings of this study are available from the corresponding author upon request.


