A Smart Wearable Device Using Graphene Material-Based Sensor for Neonatal Respiration Monitoring
Abstract
Respiration monitoring is critical for the clinical treatment and nursing of neonates. Existing respiration monitoring protocols rely either on the indirect measurements of thoracic impedance or on other invasive techniques that pose a risk of discomfort and infection to infants. In addition, multiple wire loops around the infants hinder the delivery of parental and clinical care. Based on this demand, a graphene material-based neonatal respiration monitoring device was proposed. The system has the advantages of precision, flexibility, less pressure on the neonatal body, and suitable for embedding in daily clothing. Performance parameters, including stress, sensitivity, stability, and response/relaxation time of the sensor, were tested. Furthermore, the feasibility of the system was tested on a total of six neonates at the Children’s Hospital of Fudan University in Shanghai, China. The experimental results showed that the system had a strong correlation with the medical level multiparameter measurement equipment in respiratory measurement. Therefore, the system could serve as an alternative to the conventional respiratory monitoring system, making it a certain appeal in clinical and home applications.
1. Introduction
Respiration monitoring is critical for the clinical treatment and nursing of neonates [1, 2]. An increasing number of neonates in the neonatal intensive care unit (NICU) require innovative solutions to continuously monitor their respiratory signals, among which respiratory rate is particularly important. Respiratory rate, also known as breathing rate, is defined as the number of inhalation and exhalation movements per unit time. In fact, respiratory rate is ordinarily determined by counting the number of diaphragm expansions and contractions per minute. Common respiratory diseases, including pneumonia, pulmonary hemorrhage, and respiratory distress syndrome (RDS), can cause abnormal respiratory rates in neonates. Thereinto, RDS is commonly seen in premature infants, leading to increased respiratory rate and apnea (respiratory arrest) in neonates, which eventually escalates to respiratory failure and cardiopulmonary arrest [3]. On this basis, real-time monitoring and timely detection is indispensable for respiratory rate and its changes.
However, existing respiration monitoring protocols rely either on indirect measurement of thoracic impedance or on other invasive techniques that pose a risk of discomfort and infections to infants [4–11]. In addition, multiple wire loops around the infants hinder the delivery of parental and clinical care. An ever-growing number of researchers tend to focus on new breath detection techniques as the technology continues to evolve. Current techniques for monitoring respiratory rate include acceleration sensor, piezoelectric composites, impulse radio, ultrawideband radar, piezoresistive sensor, and fiber optic sensing [12–20]. Despite more options provided new technologies, respiratory monitoring still has some problems, such as the accuracy of respiratory rate detection, unsuitable materials or methods for neonates, and limited monitoring sites.
A wearable respiration monitoring system based on respiratory induction plethysmography (RIP) with a polydimethylsiloxane-graphene compound (PDMS-G) tensile sensor for neonatal monitoring was proposed in this paper. In previous work [21], the basic performance of the PDMS-G sensor was verified. We further develop the wearable neonatal respiration monitoring device (NRD). The proposed NRD sensor system has advantages over the thoracic electrical impedance method, as it avoids the utilization of adhesive electrodes and thus has no risk of sink damage to infants. Compared to the three-dimensional accelerometer and piezoelectric sensor, the proposed NRD is less susceptible to motion artifacts. Unlike the thermal flow sensor, the proposed NRD does not require an additional wearing mask and can be integrated into the clothes for more convenient and comfortable use. Compared with respiration band that measures inductance changes, NRD has much less tension, making it more suitable and comfortable for neonatal respiratory monitoring. Furthermore, the proposed sensor is more convenient and suitable for wearable products and can be developed as an elastic strap that can be embedded directly into clothing.
The differences between this work and our previously published work is mainly reflected in the following three aspects: Firstly, the sensor was designed in a comfortable elastic band to accommodate neonates of different sizes. Secondly, respiration of neonates is different from adult respiration. Neonatal abdominal changes are less than adults, making it easy to be affected by an external force. Therefore, more comprehensive tests and experiments were conducted to prove that the new system could be used for neonatal respiratory monitoring. Specifically, in order to prevent the excessive pressure of the respiratory bandage on the neonate from affecting respiration, a sensor stress test was conducted. Response/relaxation time and sensitivity of the sensor were tested to ensure that the system could obtain the respiratory signal from neonates. Moreover, the system performance at different frequencies was verified for system stability. Finally, the clinical experiments of six neonates at the Children’s Hospital of Fudan University in Shanghai, China, showed that the NRD had a strong correlation in respiratory rate measurement compared with the medical level multiparameter measurement equipment. Therefore, the proposed system could be an attractive alternative to conventional respiratory monitoring for neonates both in clinical and home settings.
The rest of the paper is organized as follows: Section 2 describes the design of the PDMS-G compound strain sensor and the hardware system. Section 3 introduces the performance evaluation of the NRD system. Section 4 demonstrates the clinical experiments with neonates. Section 5 discusses and concludes the full paper.
2. Fabrication of Wearable Neonatal Respiration Monitoring Device
A wearable neonatal respiration monitoring system based on respiratory induction plethysmography (RIP) with a polydimethylsiloxane-graphene compound strain sensor for neonatal monitoring was proposed. Respiration inductance plethysmography (RIP) is a noninvasive technique that measures respiration rate through strain bands, which is placed around the thoracic cage or placed on the abdomen at the level of the umbilicus. Strain bands were made of an extensible/deformable graphene-based conductive material, which was an extremely thin foil able to maintain its conductivity during the stretching process. The breathing of the neonate will cause changes in the circumference of the thoracic and abdomen. Therefore, the length of the sensor changes which leads to the impedance change during respiration, and the respiratory signal can be extracted by measuring the impedance change of the sensor.
2.1. Graphene Material-Based Sensor
Even though strain sensors with different materials have been formulated and developed for a significant amount of time, graphene-based sensors have proved to be an excellent candidate for strain-sensing applications. The manufacture of graphene-based sensors involves a mixture of different materials. The change in resistance per unit to the change in length per unit caused by strain determines the strain variable to be taken into account for the material. In our previous work [21], the PDMS-G compound was developed as a tensile sensor. PDMS, graphene sheets, and xylene are the main raw materials of the PDMS-graphene compound.
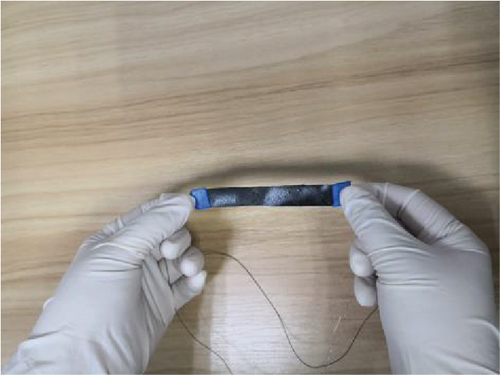
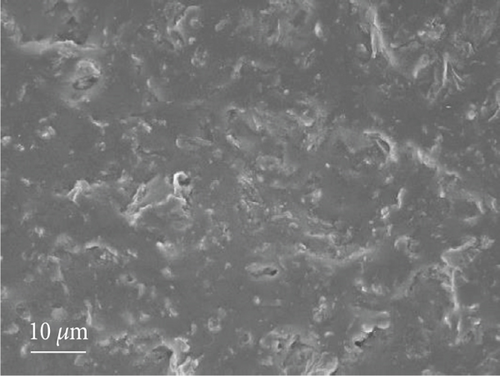
The final version of the PDMS-G compound is shown in Figure 1(a), and the scanning electron microscope (SEM) micrographs of the fracture surface of the PDMS-G compound are shown in Figure 1(b). It can be seen from the SEM that graphene was well dispersed in the PDMS matrix. PDMS-graphene has good electrical conductivity. When tensile strain occurred in the PMDS-G compound, the crack spacing on the graphene surface also increased, and the resistance of the sensor also increased rapidly, which enabled the graphene tensile sensor to have an excellent sensitivity.
2.2. Fabrication of Wearable Neonatal Respiration Monitoring Device
The skin of a neonate is sensitive. To make the wearable respiratory monitoring system more comfortable, the part of the system in contact with the neonatal body needed to be as soft as possible. Therefore, the system was designed as a respiration bandage and the signal processing module, as shown in Figure 2(a). The bandage part uses pure cotton material to wrap the sensor, which can prevent the neonatal skin from being damaged. The respiratory signal acquisition was connected to the AD converter of the single-chip computer by the PDMS-G compound through the voltage dividing circuit. As shown in Figure 2(b), one side of the signal acquisition module was connected to the voltage source VCC while the other side was connected to the 12-bit analog-to-digital converter (ADC) on the signal processing module, and the offset resistance R0 was grounded. The change of respiration over time was obtained by using the analog-to-digital conversion unit of the single-chip computer.
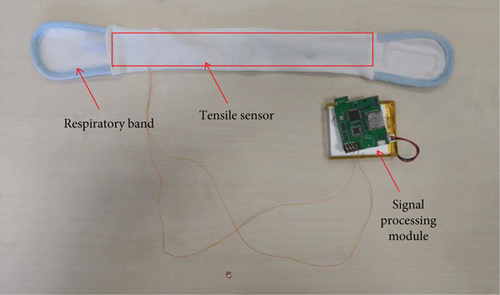

The PDMS-G sensor was wrapped in pure cotton fabric and made into a respiration band. The respiration band was attached to the neonate’s abdomen and was in direct contact with the skin. To accommodate neonates of different body sizes, we added soft Velcro to the band. The two ends of the sensor were connected to the signal receiving and processing unit by wires and conductive adhesive. The wires that connect the sensor to the signal processing module and the surrounding environment may generate noise. Therefore, preprocessing was carried out to filter out the noise. The signal processing module could be placed at the bedside without contact with the neonate. Compared with the commercial neonatal respiration monitoring device, NRD was smaller in size and lighter in weight, providing more possibilities for home monitoring.
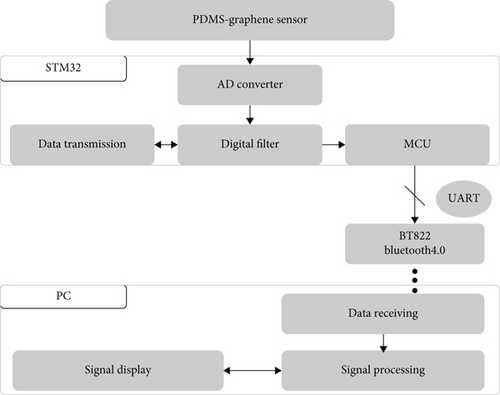
The block diagram of the proposed system with the detailed composition of the sign processing module is shown in Figure 3. The stretching of the sensor mainly resulted in the monotonical increase in resistance. A bleeder circuit with an adjustable resistor was designed to protect the system circuit. One end of the PDMS-G compound tensile sensor was connected to the voltage supply of the circuit, and the other end was connected to a 12-bit analog-to-digital converter (ADC) on the microcontroller unit (MCU) STM32F405 (STMicroelectronics), with the offset resistor to the ground in the circuit. The output voltage varied depending on the resistance of the sensor. The MCU acquired the output voltage at a frequency of 250 Hz and packaged the data to Bluetooth module BT822 (Feasycom) via Universal Asynchronous Receiver Transmitter (UART). The data package in the proposed system was set as a combination of 3-byte fixed frame headers, 2-byte digital data from the ADC, and 1-byte parity check of each package. In this process, direct memory access (DMA) was used to improve the communication efficiency. A digital high-pass filter with a passband frequency of 0.1 Hz was implemented on the MCU.
3. System Evaluation of Neonatal Respiration Monitoring Device
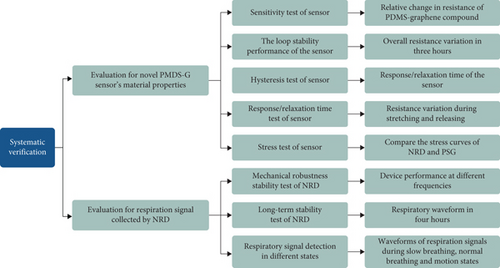
A systematic verification method for the feasibility of NRD was proposed. Figure 4 shows the evaluation framework for verifying the feasibility of the system. We evaluated the feasibility of NRD in terms of both material performance and system performance.
We preliminary evaluated the performance of PDMS-G sensor in [21]. Figure 5 shows the relative change of resistance at various elongation values. The nonlinear behavior of the sensor was found, but three distinct sensitivity regions were identified. In the first region, the sensor was from 8 cm to 10.4 cm in length; as a result, the sensitivity (S) was 4.67 cm−1. In the second region, the sensor elongation fanged from 10.4 cm to 11.6 range; as a result, the S value was 61.15 cm−1, while in the third region when the sensor was fully stretched to 12 cm, the S value was further increased to 152.68 cm−1. In the strain range of 30% to 50%, the material has better sensitivity. In fact, this is the strain range when the elastic band is connected to the body.
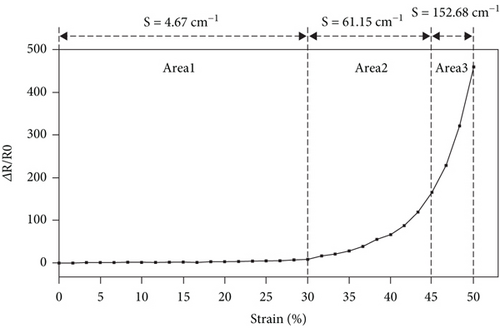
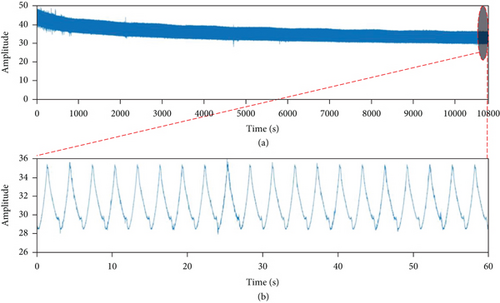
Figure 6(a) shows the 3-hour stability test results. From these diagrams, the sensor proved to have the advantage of stability. After 3,600 cycles for 3 consecutive hours, the response signal barely changed. At the beginning of the test, the decline in the baseline did not affect respiration monitoring. According to the experimental results, the sensor based on PDMS-G compound tensile sensor exhibited a stable signal output under continuous stretching for 3 hours.
In order to further test the performance of the sensor and respiration system, hysteresis test, response/relaxation time test, sensor stress test, and system performance test were carried out in this section.
3.1. Hysteresis Test of the Sensor
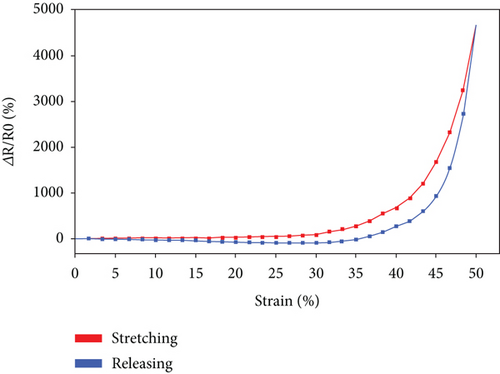
In this experiment, inductance capacitance resistance (LCR) meter (E4980AL, Keysight) was used to accurately measure the change of sensor resistance at different lengths. One end of the sensor was fixed, and the sensor was stretched to change the length. The lengths of the sensor and its resistance were recorded accordingly. The deformation range was 0-50% (8 cm-12 cm), and the step length at each recorded point was 5% (4 mm).
Figure 7 shows the change in relative resistance as the strain increases from 0 to 50%, during which stretching and release result in a hysteresis. This could be ascribed to the viscoelasticity of the PDMS.
3.2. Response/Relaxation Time Test of the Sensor
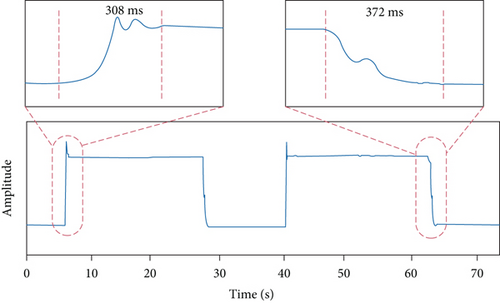
In order to verify the performance of the sensor and ensure that the sensor could obtain valid respiration data, the response/relaxation time of the sensor was tested. In this experiment, Arduino was used to test the response/relaxation time of the sensor. The real-time change of the voltage as the resistance of the sensor changes was recorded. The strain range of the sensor was fixed at 0-40%. One end of the sensor was fixed on the platform, and the other end was stretched by the free-fall motion of iron about 500 grams. During the straining process, the time spent on the voltage jumping from the first stable state to the second stable state was considered the response/relaxation time of the sensor.
The result of the response/relaxation time experiment is shown in Figure 8. The response time of the sensor was 308 ms at tension and 372 ms at relaxation. The above response satisfied the scheme of the respiration rate measurement.
3.3. Stress Test of the Sensor
To assess the basic monitoring performance of the device, the proposed device (NRD) was compared with the RIP module as part of the medical level multiparameter device—polysomnography (PSG). Unlike the proposed NRD, the respiratory band used in PSG was based on inductive changes formed by the coil within the band. The data from PSG was collected through the PSG software (Greal-PAG Oline 3).
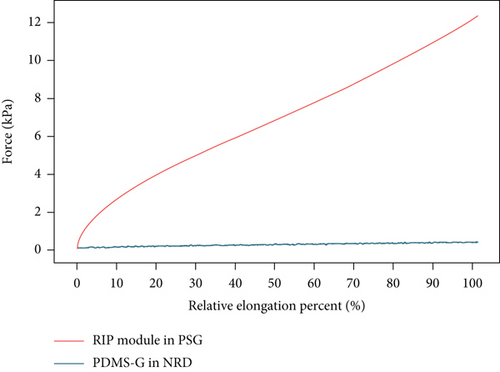
In order to prevent the excessive pressure of the respiratory bandage on the subject from affecting breathing, a sensor stress test was conducted with the aim of ensuring that the same strain pressure generated by the NRD was less than that generated by the RIP module in the PSG. The electronic universal testing machine (RGWT6000, Shenzhen Reger Instrument) was used in the test.
The stress curves of NRD and RIP module in PSG were compared, as shown in Figure 9. The stress of NRD was much less than that on the RIP module in PSG at the same tensile ratio. As a result, NRD for respiratory monitoring was more comfortable than PSG, especially for neonates.
3.4. Mechanical Robustness Stability Test of Neonatal Respiration Monitoring Device
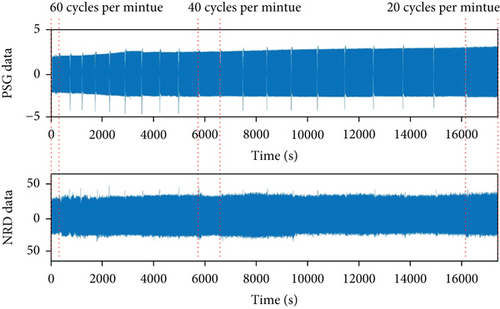
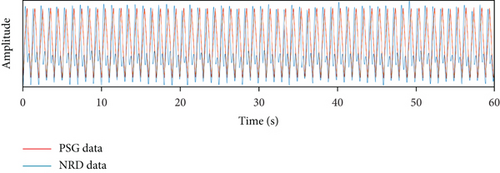
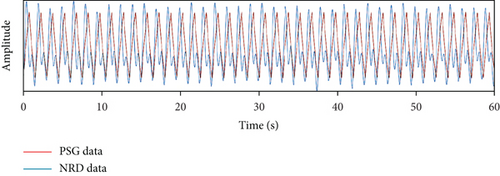
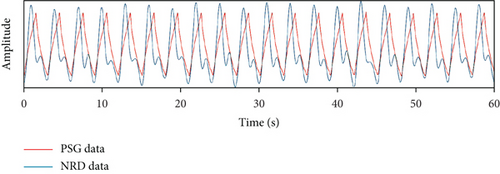
The device performance at different frequencies was verified. The stepper monitor used in this test was the same as the cyclic stability performance experiment. The frequency range was set at 60 cycles per minute to 20 cycles per minute, which covered the range of neonatal respiratory rate [13, 22]. There were 21 groups in this frequency range. In each group, the waveform of the proposed sensor with the RIP module in PSG was compared. A digital band-pass filter with a passband of 0.01 Hz to 5 Hz was implemented for the sensor data on MATLAB 2018b (MathWorks).
Figure 10(a) shows the overall waveform. Figures 10(b)–10(d) show partial results with 60, 40, and 20 cycles per minute correspondingly. It can be seen from this experiment that the NRD had a stable performance at different frequencies.
3.5. Respiration Monitoring Experiments of Neonatal Respiration Monitoring Device
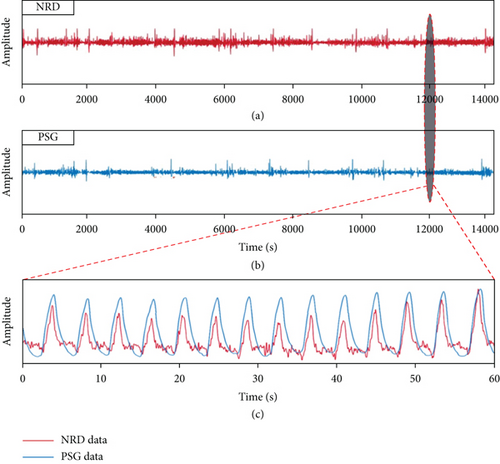
To assess the long-term stability of NRD, we immobilized the sensor to the adult abdomen and collected respiration data for four hours. PSG and NRD were simultaneously strapped to the subject’s abdomen to collect data. The sampling rate for both systems was set to 32 Hz. A 30-year-old male volunteer conducted the four-hour experiment. The subjects sat in a chair without strenuous exercise, during the trial.
Figure 11 shows the result of the long-term stability test for NRD. The result shows that the signals obtained from NRD have a similar beat structure with the same frequency as that from PSG. Despite the little difference in the attachment position of NRD and PSG in the abdomen region, the overall similarity of the data obtained during the inspiratory intervals can be noted, revealing NRD’s accuracy in measuring respiration rate.
3.6. Respiration Signal Monitoring under Different States
Respiratory monitoring experiment was conducted by NRD with a sampling frequency of 32 Hz. NRD collected respiration data in two states: slow breathing (deep breathing) and normal breathing. Since the experiment was simulated under the state of rapid breathing, we found that prolonged excessive deep breathing could lead to adverse symptoms such as brain hypoxia and dizziness. Therefore, only the respiration rates under slow breathing and normal breathing were collected during the experiment. In addition, we also collected breathing signals during the motion state.
Figure 12 shows the respiration signal waveforms under different states. Figure 12(a) shows the waveform under a slow breathing state, and Figure 12(b) shows the waveform under a normal breathing state. During slow breathing, there are more inspiration and more chest variation; therefore, the wavelength variation was greater than that during normal breathing. In addition, the frequency of normal respiration is significantly faster than that of slow respiration.
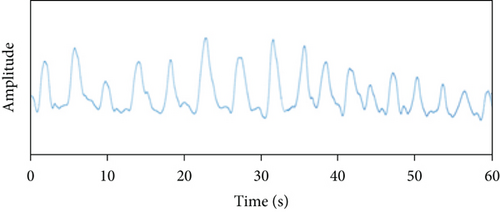
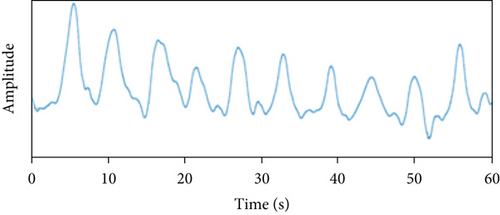
Figure 13(a) shows the raw data acquired by NRD under a walking state, and Figure 13(b) shows the respiration signal waveform after low-pass filtering. During the walking state, the respiration signal was obviously disturbed by movement, but the characteristics of respiratory waveform can be seen. After low-pass filtering, the data can clearly distinguish respiratory signals.


4. Neonatal Respiration Measurement and Results
To carry out the performance tests on neonates, permission was obtained from the Children’s Hospital of Fudan University Research Ethics Committee (approval no. (2017) 89) to recruit infant patients for respiratory monitoring. Inclusion criteria included age less than 60 days, in stable health conditions, and about to be discharged from the neonatal intensive care unit (NICU). Exclusion criteria included patients with diagnosed respiratory disorder history or allergy to medical-grade skin glue or latex.
4.1. Experimental Protocol
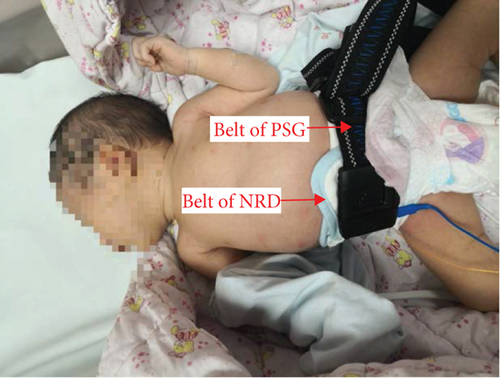
The NRD was compared with the RIP module as part of the PSG. Both devices were attached to the subject for simultaneous recording of respiration, as shown in Figure 14. The peak detection algorithm of MATLAB R2018 was adopted for respiratory rate extraction. The performance of the device on infants was tested mainly from the following three aspects:
Firstly, the respiratory signals collected by NRD and PSG were compared by studying the similarity between the initial waveform output of NRD and PSG.
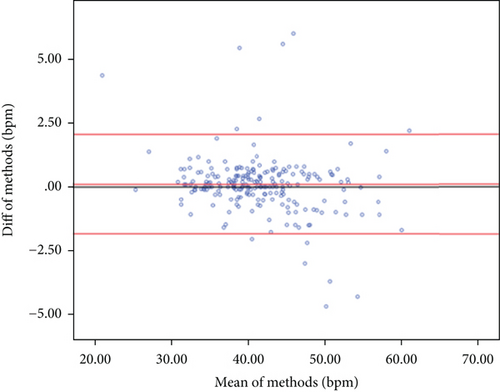
Secondly, the relationship between the average respiratory rates (RR) measured by the NRD and PSG was analyzed. The interval between each output RR point was 30 seconds. Mean, standard deviation, median, and range were used to summarize the difference in average RR between NRD and PSG during the 30-second interval. The 95% confidence interval of the mean difference between the average RR was used to determine the validity of the RR derived from NRD and PSG. The difference of three breaths per minute (bpm) was considered to be the minimal clinical relevance [23]. This was chosen from the early warning system (EWS) which identified a score difference of 3 bpm to be meaningful by defining the respiration scores in steps of 3 bpm. Pearson’s Bland-Altman analysis was used.
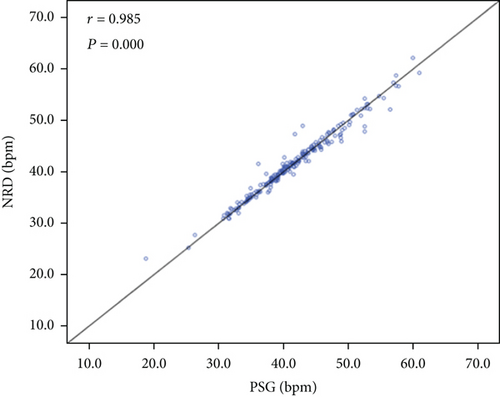
Thirdly, the correlation between respiratory rates measured by NRD and PSG was assessed. Based on the previously reported threshold [22], the expected correlation with PSG-derived RR was set at 0.8. The NRD would be considered effective in detecting changes in RR equivalent to PSG if a correlation coefficient (r) greater than 0.8 was achieved. The analysis results were presented graphically. Strong relationships between datasets with correlations greater than 0.8 were demonstrated to be similar and simultaneous in increasing and decreasing in measurements.
4.2. Neonatal Respiration Measurement and Results
A total of 6 patients (3 males, 3 females) who did not violate our exclusion criteria were enrolled in the experiments. The mean age of the subjects was 29.1 days (median 31.5, standard deviation 14.1, and range 18-58). The patients spent 60 minutes in the neonatal intensive care unit. No adverse respiratory events occurred during the test.
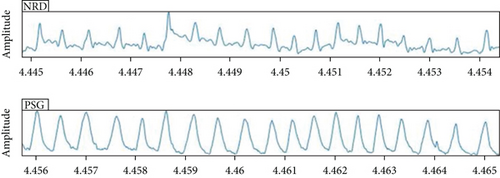
At first, the signal quality in the time domain was compared, as shown in Figure 15. The signal with the same beat frequency structure was obtained by NRD and PSG. Although NRD and PSG had slightly different attachment locations in the abdominal region, the overall similarity of the data obtained during the inspiratory interval was noted. Since neonates spend most of time sleeping or lying in swaddling clothes, they rarely have severe exercise, so the impact of motion artifacts received by the tension sensor is small.
Secondly, out of a total of 240 recorded data points, each RR point was spaced one minute apart to ensure the independence of variables in the Bland-Altman analysis. 218 points were available for analysis. Because of the nurses’ medical procedures (such as feeding and injection) for the subjects, the remaining 22 points were lost. The comparisons between NRD-derived RR and PSG-derived RR are shown in Table 1.
| NRD-PSG | |
|---|---|
| Number of data points | 218 |
| Mean | 0.816 |
| Standard deviation | 1.162 |
| Minimum–maximum | -4.68, 5.99 |
| 95% confidence interval | -1.46, 3.69 |
Figure 16 summarizes 218 data points for PSG versus NRD in the form of the Bland-Altman plot. The direction of difference was NRD-PSG. The red-dotted line indicated the deviation of the difference. The red solid line represented the 95% confidence limit for the difference. The mean RRR difference between NRD and PSG was less than 1 bpm (mean (SD) = 0.816 (1.162)). The 95% confidence interval (CI) for the difference in average RR was calculated to be [-1.46, 3.69], which did not exclude the clinically relevant difference of 3 bpm. However, the difference was greater than 3 bpm in the case of only eight intervals (3.7% of intervals).
Finally, the correlation analysis results of 218 data points are shown in Figure 17. The correlation coefficient (r) was 0.985, which indicated that NRD and PSG had a strong correlation in neonatal RR monitoring.
5. Conclusions and Future Work
A neonatal respiration monitoring device with a flexible PDMS-G composite strain sensor was proposed. The device was easy to obtain and track the resistance changes during the stretching of PDMS-G sensor. The sensor system embraced favourable sensitivity, especially in the strain range of 30% to 50% (S ≥ 61.15 cm-1). After 3,600 continuous cycle tests, the sensor system still demonstrated sound cyclic stability. In addition, compared with the respiratory band of PSG, the PDMS-G compound sensor had lower pressure during respiratory monitoring, which held promises for neonatal comfort monitoring.
Furthermore, experiments were conducted on neonates to compare the respiratory measurements of the proposed system with the commercial medical device—PSG. The results showed that NRD and PSG had a strong correlation in neonatal respiratory rate monitoring with a correlation coefficient of 0.985.
Neonatal respiration detection is affected by different locations or scenes, such as NICU, home, and parental embrace, and individual states of neonates, such as neonatal seizures and crying. These situations can cause interference and artifacts to the respiration measurements of the system. In future work, it is necessary to carry out quantitative analysis, design a robust system adapting to different postures, and develop signal processing approaches for artifact removal. In addition, elastomer materials are prone to fatigue and hysteresis, and the methods to combat these effects need to be further investigated.
Disclosure
Some of the experiments in this paper have been mentioned in Ph.D. thesis [24].
Conflicts of Interest
The authors declare that they have no conflicts of interest.
Acknowledgments
This work is supported by the Postdoctoral Start-Up Fund, Greater Bay Area Institute of Precision Medicine (P1006).
Open Research
Data Availability
Data sharing is not applicable to this article as no new data were created or analyzed in this study.


