Spatial Variation in Excess Mortality in Mexico during the First 2 Years of the COVID-19 Pandemic
Abstract
Background. Excess mortality from all causes is a reliable indicator of the direct or indirect effect of the COVID-19 pandemic. This study aimed to estimate excess deaths in Mexico during the first 2 years of the COVID-19 pandemic and to examine the spatial and temporal variations in relative excess mortality at the subnational level. Materials and Methods. This ecological study was based on publicly available governmental data and compared 2020–2021 total deaths with the average number of deaths in 5 previous years. The relative excess mortality was then analyzed as a function of time (waves) and space (distribution maps). Results. Between January 1, 2020 and December 31, 2021, Mexico recorded 2,136,611 deaths out of 1,385,240 expected deaths, representing 751,371 excess deaths (95% CI: 709,948.267–792,793.732). During this period, we identified three waves of excess deaths, the second being the most severe, with 109,846 more deaths than expected. When examining each wave, spatial variation in relative excess mortality was identified, with all 32 states experiencing more deaths than expected (values > 0%). However, in Mexico City, Tlaxcala and Queretaro recorded values greater than 100% at different times. Conclusions. During the first 2 years of the COVID-19 pandemic (2020–2021), the number of deaths increased excessively in the 32 states. The spatial variation in relative excess mortality in each observed wave demonstrated that the response to the effects of the pandemic in Mexico differed due to various factors, such as prevention measures against COVID-19, the beginning of the vaccination campaign, and pandemic fatigue which caused a certain relaxation and therefore a return of tourism, mainly in coastal areas. Therefore, it is necessary to implement equitable policies for the care of particularly affected areas.
1. Introduction
Mortality monitoring is an essential part of the public health response to the COVID-19 pandemic [1] and has had a major impact on mortality in most countries worldwide [2]. However, limited test availability and delays in reporting make it difficult to estimate the burden of mortality associated with COVID-19 [3, 4, 5]. In 2020, Latin America had the lowest testing rate in the world, at ∼63 per 100,000 inhabitants [6] and Mexico presented one of the lowest per capita COVID-19 testing rates, with 17 tests per 1,000 persons [7].
When a specific health condition occurs (e.g., COVID-19) during a given time period, the number of deaths from all causes can be compared to the number of deaths expected during the same period based on historical data [1, 3]. The number of deaths in excess may be a more reliable indicator of the effect of the COVID-19 pandemic on mortality in a given country or geographic region [3, 8]. These estimates are critical for tracking deaths directly or indirectly attributed to the pandemic, providing information on mitigation strategies and equitable policy responses [9, 10, 11]. In Mexico, efforts have been made to estimate excess mortality, mainly following Bortman’s endemic channel methodology [12], which was taken up by the Pan American Health Organization (PAHO) [13, 14, 15]. Other studies contemplated the spatial component by examining the variability and geospatial heterogeneity in excess deaths [2, 16]. The government of Mexico developed a platform for visualizing and monitoring excess mortality [17]. In addition, global mortality analyses revealed that Mexico was one of the most affected countries at the beginning of the pandemic, registering an excess mortality of more than 50% of the annual mortality expected for 2020 [4], and in the period 2020–2021, it was among the seven countries with the highest excess mortality in the world, with 798,000 excess deaths [18].
This study proposes to estimate excess deaths from all causes and examine the spatial and temporal variations in relative excess mortality, which might help to support public health officials in the geographic location of places particularly affected by direct or indirect deaths related to the pandemic, answering research questions about the spatiotemporal pattern of excess deaths in Mexico during the first 2 years of the pandemic.
2. Materials and Methods
2.1. Study Area
Mexico is located in North America, bordered by the United States (north), Guatemala and Belize (southeast), the Pacific Ocean (west), and the Gulf of Mexico (east). Administratively, it is divided into 32 states or federative entities. As of 2020, it had a population of 126,014,024, of which 51.2% were women and 48.8% were men, and the average age in this country was 29 years [19]. This same year, 1,062,745 deaths were registered, while in 2021, 1,073,866 deaths occurred [20].
2.2. Data and Processing Software
The monthly counts of all-cause deaths from January 2020 to December 2021 were obtained from the Mexico Excess Mortality Analysis Database [20]. The baseline mortality level [16] was obtained from the monthly counts of the previous 5 years (2015–2019), as extracted from the Death Registration Databases of the General Directorate of Health Information administered by the Ministry of Health [21]. The databases contain death certificates collected by the Civil Registry Offices. In this study, all records, filtered by the residence of the deceased and the date of death, were used to estimate all-cause mortality, including COVID-19.
Most of the statistical processing was carried out in the RStudio: Integrated Development Environment [22], and the results were mapped using ArcGIS software [23].
2.3. Data Analysis
Based on what was observed at the national level, three waves of excess deaths were defined, i.e., the beginning of each wave was detected in the month where the slope of the curve began to rise [13].
The cartography was elaborated based on the unified classification of five ranges (equal intervals) so that the maps would show the same symbology and the differences between the waves could be seen; the minimum (4) and maximum (157) values of the data were taken into account. The ranges are as follows: 4–35; 36–65; 66–95; 96–125; and 126–157.
3. Results
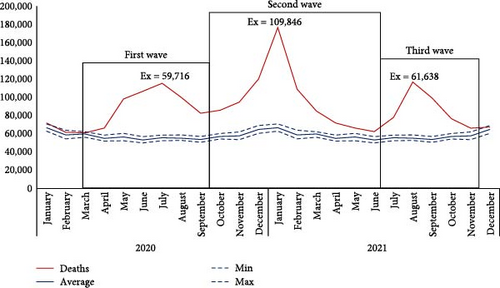
When analyzing the excess mortality curve (2020–2021), three waves, characterized by continuous growth until reaching a maximum point and then a decrease until reaching a minimum point [13], are observed. The first wave started in March 2020 and has been growing steadily. In July, it peaked with 59,716 excess deaths, subsequently ending in September of that year. During the following month (October), the curve began to increase, which initiated the second wave. In January 2021, the second peak was recorded with 109,846 excess deaths, and in June of that year, it decreased. The third wave observed began in July 2021, and in the following month (August), it peaked with 61,638 excess deaths; this wave ended in November 2021 (Figure 1).
Between January 1, 2020 and December 31, 2021, Mexico registered 2,136,611 deaths out of 1,385,240 expected, representing 751,371 excess deaths (95% CI: 709,948.267–792,793.732). All 32 federal entities experienced relative excess mortality during 2020–2021 (values > 0%), and consequently, there were more deaths than expected according to the mean for the years 2015–2019. Half of the entities (16) are above the national average (51%), and the remaining recorded relative excess deaths range from 21% to 49% (Table 1).
| Entity | 2020–2021 deaths | Expected deaths ∗ | 2020–2021 absolute excess (95% CI) | 2020–2021 relative excess (%) |
|---|---|---|---|---|
| Aguascalientes | 18,944 | 12,264 | 6,680 (6,073.101–7,286.899) | 54 |
| Baja California | 66,213 | 38,318 | 27,895 (25,672.427–30,117.572) | 73 |
| Baja California Sur | 10,812 | 6,860 | 3,952 (3,564.285–4,339.714) | 58 |
| Campeche | 14,092 | 9,684 | 4,408 (4,133.969–4,682.030) | 46 |
| Coahuila | 49,793 | 33,610 | 16,183 (15,335.466–17,030.533) | 48 |
| Colima | 13,798 | 9,010 | 4,788 (4,687.668–4,888.331) | 53 |
| Chiapas | 71,241 | 54,266 | 16,975 (15,975.876–17,974.123) | 31 |
| Chihuahua | 67,881 | 47,266 | 20,615 (19,300.981–21,929.018) | 44 |
| Ciudad de Mexico | 263,442 | 123,782 | 139,660 (137,422.548–141,897.451) | 113 |
| Durango | 25,076 | 18,932 | 6,144 (5,531.697–6,756.302) | 32 |
| Guanajuato | 108,080 | 68,104 | 39,976 (35,862.626–44,089.373) | 59 |
| Guerrero | 48,055 | 39,316 | 8,739 (7,471.665–10,006.334) | 22 |
| Hidalgo | 46,325 | 31,154 | 15,171 (14,210.188–16,131.811) | 49 |
| Jalisco | 138,434 | 92,736 | 45,698 (42,296.525–49,099.474) | 49 |
| Mexico | 260,257 | 167,222 | 93,035 (86,509.661–99,560.338) | 56 |
| Michoacan | 78,845 | 54,400 | 24,445 (22,663.143–26,226.856) | 45 |
| Morelos | 40,971 | 24,724 | 16,247 (15,066.041–17,427.958) | 66 |
| Nayarit | 17,135 | 13,228 | 3,907 (3,427.919–4,386.080) | 30 |
| Nuevo Leon | 88,905 | 54,104 | 34,801 (32,291.256–37,310.743) | 64 |
| Oaxaca | 60,279 | 49,810 | 10,469 (9,526.446–11,411.553) | 21 |
| Puebla | 120,387 | 73,958 | 46,429 (44,073.427–48,784.572) | 63 |
| Queretaro | 34,247 | 20,240 | 14,007 (13,004.105–15,009.894) | 69 |
| Quintana Roo | 21,681 | 13,130 | 8,551 (7,597.220–9,504.779) | 65 |
| San Luis Potosi | 43,143 | 31,324 | 11,819 (10,293.866–13,344.133) | 38 |
| Sinaloa | 45,003 | 32,060 | 12,943 (12,328.673–13,557.326) | 40 |
| Sonora | 53,999 | 34,428 | 19,571 (18,402.605–20,739.394) | 57 |
| Tabasco | 40,650 | 26,846 | 13,804 (12,704.693–14,903.306) | 51 |
| Tamaulipas | 52,677 | 38,706 | 13,971 (13,401.615–14,540.384) | 36 |
| Tlaxcala | 21,533 | 13,236 | 8,297 (7,828.421–8,765.578) | 63 |
| Veracruz | 148,840 | 107,482 | 41,358 (38,518.525–44,197.474) | 38 |
| Yucatan | 36,817 | 26,134 | 10,683 (10,227.427–11,138.572) | 41 |
| Zacatecas | 29,056 | 18,906 | 10,150 (9,556.501–10,743.498) | 54 |
| Total (national) | 2,136,611 | 1,385,240 | 751,371 (709,948.267–792,793.732) | 54 |
- ∗Expected deaths were calculated from the average of the years 2015–2019, multiplied by 2.
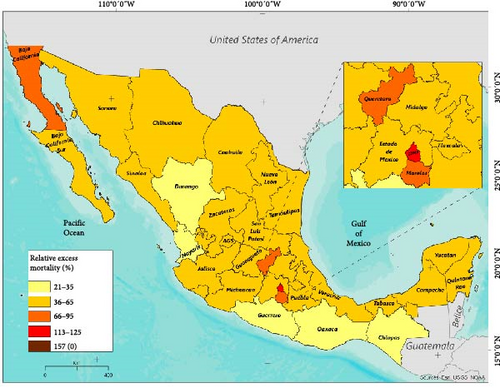
The map illustrating the whole studied period shows less regional variation than the wave-specific maps. The highest levels were recorded in Mexico City, Baja California, Queretaro, Morelos, and Quintana Roo. However, the Mexican capital (red) was the most affected entity, with 113% relative excess mortality and twice as many deaths as the rest. Twenty-three states registered values between 36% and 65%, a preponderant range 2 years after the COVID-19 pandemic. The least affected states (yellow) are located in the southwest and northwest regions, with values ranging between 21% and 35% (Figure 2).
When specific wave patterns were examined, greater regional variation in excess mortality could be identified. During the first wave (March–September 2020), 629,124 deaths were recorded, 240,806 more than expected (Table S1). Specifically, Mexico City and Tlaxcala (red) located in the center of the country were the most affected, with a relative excess mortality of 125% and 102%, respectively. Seventeen states are in the range of 36%–65%, of which six are above the national average of 50.5%. In the southwest and northwest regions, some states (in yellow) seemed to be less affected, with values ranging between 4% and 35%; this result is similar to that observed between January 2020 and December 2021 (Figure 3(a)).
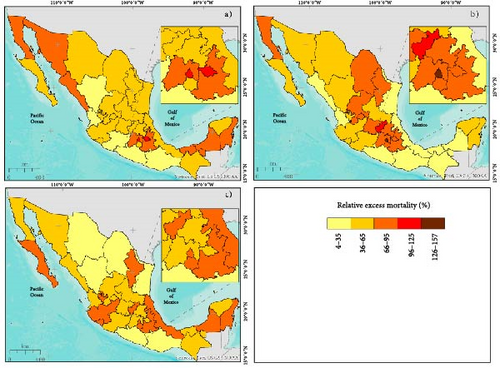
In the second wave (October 2020 and June 2021), 870,644 deaths were recorded out of 528,493 deaths expected (Table S1). During this wave, an increase in the number of states with high levels of relative excess mortality was observed in the northern, central, and northwestern regions (orange). However, two states located in the center of the country were the most affected: Queretaro (red) with 103% and Mexico City (brown), which reached the highest level of 157%. Ten states recorded values ranging between 36% and 65%, four of which were above the national average of 61.5%. In addition, there was an increase in the number of states with lower values (yellow), located in the southwest, northwest, and Gulf of Mexico regions, with values ranging between 4% and 35% (Figure 3(b)).
Between July and November 2021, the third wave of excess mortality was recorded, with 436,297 deaths, 157,686 more than expected (Table S1). During this period, Mexican states experienced a decrease in relative excess mortality, and there were no places with more than 88% relative excess mortality. However, moderate levels were recorded in 11 entities located in the northwest, southeast, and northeast (Nuevo Leon). Fifteen states had values ranging between 36% and 65%, with five having values above the national average of 56.5%. Some states in the northern region of the country recorded low levels, as did Guerrero and Oaxaca, which were among the least affected during the three waves, with values ranging from 4% to 35% (Figure 3(c)).
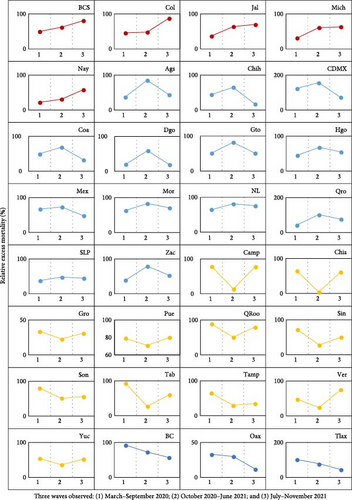
For each entity, we analyzed the trend of relative excess mortality during the three waves observed. The states of Baja California Sur (BCS), Colima (Col), Jalisco (Jal), Michoacan (Mich), and Nayarit (Nay) exhibited increasing trends in all three waves. For example, the state of BCS recorded values of 50%, 62%, and 81% in each corresponding wave (Table S1). Thirteen entities presented a high growth trend in the first wave, reaching a peak of relative excess deaths in the second, and during the third, their trend decreased. Mexico City (CDMX) and Queretaro (Qro) are clear examples, with values of 125% and 43% in the first wave, 157% and 103% in the second wave, and 73% and 77% in the third wave, respectively (Table S1). The opposite was the case in 11 states, which presented a high growth trend in the first wave and reached a low point in the second, and in the third, their trend was upward; we highlight Campeche (Camp) and Chiapas (Chis) with values of 79% and 65% in the first wave, 14% and 4% in the second, and 78% and 61% in the third, respectively (Table S1). The entities that showed a decreasing trend during the three waves were Baja California (BC), Oaxaca (Oax), and Tlaxcala (Tlax). For example, the latter recorded values of relative excess deaths of 102%, 79%, and 45%, respectively, in each corresponding wave (Table S1 and Figure 4).
4. Discussion
4.1. Excess Mortality
Estimates of excess deaths are critical for tracking the direct and indirect effects of the COVID-19 pandemic and for developing equitable policy responses [10, 26]. From January 1, 2020 to December 31, 2021, we estimated 751,371 excess deaths nationwide (95% CI: 709,948.267–792,793.732), which is greater than the number of 645,733 officially recorded by the Mexican government [17]. Our estimates are similar to those reported by COVID-19 Excess Mortality Collaborators [18], for the same period, who placed Mexico as the fourth country with the highest excess mortality in the world with 798,000, that is, 46,629 more deaths than those reported in this study.
We found that all 32 entities experienced excess mortality (values > 0%). This finding could have occurred for several reasons. The first is direct deaths from COVID-19 [16]. A previous study showed that COVID-19 was the leading cause of death in Mexico in 2020 and 2021 [27]. Deaths indirectly attributed to COVID-19 could also have been associated with excess mortality, mainly because of deficiencies in health care delivery due to the overload of the medical system [4, 28, 29] and the high burden of comorbidities [30, 31]. In Mexico, ischemic heart disease and diabetes mellitus were the second and third leading causes of death, respectively, during the 2 years studied [27].
In addition, the restrictive measures imposed by the pandemic had a significant impact on deaths caused by broader indirect factors. In the United States, Matthay et al. [32] estimated that 30,231 deaths in excess were attributable to COVID-19-related unemployment and suicide in the first year of the pandemic, while Mexico reached the highest number of suicides in the last decade (7,818). The states that showed increasing trends of excess mortality (BCS, Col, Jal, Mich, and Nay) registered suicide rates higher than the national average (6.2) [33].
Mexico City was more affected than the rest of the states, with an excess mortality of 113%. This finding is related to a previous study that reported the highest excess mortality rate (63.54) in this city, compared to the rest of the country (23.25) [5]. Specifically, Mexico City is the second most populated entity in the country (9,209,944 people) and is among the largest cities in North America [9, 34]. Worldwide, urban areas have been most affected by the COVID-19 pandemic, and ∼95% of the cases were located in these areas [35]. In addition, cities with marked social inequalities and with high rates of overcrowded conditions have been associated with a higher risk of mortality from COVID-19, as is the case in some places in Mexico City [36]. Recent research indicates that marginalized places with high population density experienced a greater risk of community transmission of COVID-19 [26].
4.2. Three Waves of Excess Mortality
Three waves of excess mortality were identified, each of which had a different spatiotemporal behavior. Previous research showed that in several countries, deaths were at expected levels in the absence of the pandemic but began to diverge to higher levels at different times in March 2020 [37]. Subsequently, in Mexico and Peru, excess mortality spread through many areas by the end of the second half of 2020, thereby initiating the second wave of the COVID-19 pandemic [6], and during the second half of 2021, excess mortality declined in all states of the country.
During the first wave, the government of Mexico implemented preventive measures against COVID-19, such as the “National Day of Healthy Distance” (March–May 2020), which included partial or total confinement of the population [38]. Later, there was a change in strategy called the “New Normality” (June 2020–May 2022) [39], and the main objective was to reactivate economic, social, and educational activities without neglecting the health of the population [40]. However, the first peak of excess mortality was recorded in July 2020, with the most affected states being Mexico City and Tlaxcala (center of the country), Baja California and Sonora in the northwest (border states), and Tabasco, Campeche, and Quintana Roo in the southeast (tourist states). This finding is consistent with that of Lima et al. [6], who reported that Campeche, Tlaxcala, Quintana Roo, Tabasco, and Sonora had an excess mortality of more than 200% in the first wave of COVID-19.
The second wave was the most severe because, in January 2021, it reached the second maximum point of excess mortality (highest value). In addition, the spatial pattern of excess deaths with high values extended from the center (Mexico City, Queretaro, State of Mexico, Hidalgo, Puebla, Tlaxcala, and Morelos) to the north and Baja California continued to figure. This result is similar to that of Lima et al. [6], who identified Mexico City, Baja California, the State of Mexico, and Chihuahua as the most affected states at the beginning of the second wave of COVID-19.
In the third wave, spatial patterns of excess mortality with high values were observed in different states, among which Colima, Baja California Sur, and Quintana Roo stood out. Interestingly, we found that the entities with low values are located mainly in the southeast: first wave: Michoacan, Oaxaca, and Guerrero; second wave: Chiapas, Guerrero, and Oaxaca; and third wave: Oaxaca and Guerrero. These results are in line with previous studies in which the most affected states were located in the center of the country, while the lowest excess mortality was observed in southern states [2, 14, 15]. This demonstrates the spatial variation in excess mortality since the central states registered the highest values during the three waves, which can be related to direct deaths from COVID-19, particularly in Mexico City, the epicenter of the pandemic in Mexico. In contrast, previous studies revealed that the highest excess mortality from non-COVID-19 causes, such as cardiovascular disease and diabetes, occurred in the southeastern states [41, 42].
We found four types of excess mortality trends. The increasing trend was in Colima, Jalisco, Michoacan, Nayarit (contiguous entities), and Baja California Sur; a peculiarity is that these places are part of Mexico’s tourist destinations due to their beaches on the Pacific. This trend could be related to increases in deaths from COVID-19 due to the relaxation of measures in favor of tourism, despite governments implementing information campaigns and international travel restrictions [43]. Thirteen entities presented a growth trend in the first two waves, and in the third, they registered a decrease. This behavior could be related to the relaxation of measures during the first and second waves. Knaul et al. [43] reported that, as of June 14, 2020, some public policies began to relax with the implementation of the “weekly epidemiological traffic light.” In the third wave, the population aged 40 years and older had received at least one dose of vaccination against SARS-CoV-2 [44], which could have influenced the decrease in deaths from COVID-19 at all ages, especially in older adults [45]. Eleven states presented an increasing trend in the first and third waves, while in the second wave, their trend decreased. This behavior could be explained by the vaccination campaign, mainly in the second wave. Asencio-Montiel et al. [46] noted that a vaccination strategy that initially focused on the most vulnerable groups caused a decrease in hospitalization rates for high-risk groups and consequently in deaths from COVID-19, while in the third wave, the easing of measures in favor of tourism in states on the Gulf of Mexico slope could have increased deaths from COVID-19. Baja California, Oaxaca, and Tlaxcala presented a decreasing trend during the study.
The excess mortality estimates in this study can assist public health officials in targeting health care interventions and health services in places particularly affected by deaths attributable or not attributable to COVID-19. In addition, the results showed regional variation in relative excess mortality during the three waves, calling for mortality monitoring to respond equitably to the impact of the pandemic in Mexico. Subsequent studies could focus on the main causes of excess mortality and on the social determinants of health to identify the relationship between the circumstances in which people develop and mortality.
Among the caveats to be mentioned for this study, the precision of input data is always a challenge. Previous research has proposed methods for estimating excess mortality based on a projection of population growth calculated from regression or hierarchical equations [1, 4, 47]. However, in the present work, it is assumed that the level of error in these data is similar across the country, so while the absolute value is probably inaccurate, the relative values between geographical locations remain comparable. More detailed calculations, such as carrying out a full-scale multiregional population projection and using the projected numbers as the basis for calculating excess mortality, would improve the results. However, our study aimed to provide a tool that could be implemented quickly in the event of a sudden event such as a pandemic or a natural disaster, in a middle- or low-income country.
Another limitation is related to the quality of the mortality statistics. The data sources do not allow an accurate assessment of possible underreporting in marginalized states and smaller health infrastructure (e.g., Oaxaca, Chiapas, and Guerrero); therefore, the results in these places may be biased. In addition, the total number of deaths can have been underestimated during the pandemic: rural areas with more difficult access to civil registry offices, database capture errors, or missing persons. We might expect that underreporting of deaths and underestimation of the population in less accessible communities can somehow compensate for each other. Therefore, the data can be considered among the most reliable for a relative study.
5. Conclusions
This study estimated excess mortality from all causes, which reflects the impact of the pandemic on mortality in Mexico, clearly showing three waves of excess mortality, each with different spatial variations and temporal trends, during the first 2 years of the pandemic (2020–2021). Our findings should motivate stakeholders interested in monitoring and mitigating direct or indirect mortality from COVID-19 since the number of deaths increased excessively in the 32 states.
The regional variation in excess mortality in each wave observed showed that the response to the impact of the pandemic in Mexico differed due to several factors, such as preventive measures against SARS-CoV-2, the start of the vaccination campaign, and pandemic fatigue leading to a certain relaxation and therefore a return of tourism (mainly in coastal areas).
In this context, to minimize excess mortality and disparities between regions during a COVID-19 pandemic, equitable policies need to address various aspects including health care access, economic support, education, and community resources.
Conflicts of Interest
The authors declare that they have no conflicts of interest.
Authors’ Contributions
Emmanuelle Quentin and Christian Sánchez-Carrillo designed the original study. Christian Sánchez-Carrillo was responsible for data curation and analysis. Emmanuelle Quentin and Christian Sánchez-Carrillo interpreted the results and wrote the first version of the manuscript. All authors read and approved the manuscript and made substantial contributions to the work.
Acknowledgments
We thank UTE University for providing the publication fees.
Open Research
Data Availability
The data analyzed that support the findings of the study are available from the corresponding author upon reasonable request.


