Performance Study and Formulation Optimization of Rapid-Curing Local Insulating Spray Coating Materials
Abstract
With the increasing incidence of bird damage affecting the reliability of transmission lines, addressing bird pest control has become an important task for the operation and maintenance of transmission lines. A viable solution involves the application of spray-coated polyurea elastomer composite materials to insulate exposed conductive points and weakly insulated connection parts of transmission line towers. To improve the comprehensive performance of polyurea elastomers, in this study, a polyurea curing system was modified by incorporating aluminum oxide (Al2O3), silicon dioxide (SiO2), and (boron nitride) BN nanoparticles. An orthogonal experiment was designed to investigate the influence of different fillers on the comprehensive performance of polyurea elastomers. These nanoparticles partially filled the defects inherent in the polyurea and BN microparticles, improving the alternating current (AC) breakdown strength of these elastomers. Compared with filler-free polyurea elastomers, optimal performance of the polyurea elastomers was achieved when using 5 wt% Al2O3, 0.4 wt% SiO2, and 5 wt% BN, resulting in a 15.75% increase in the AC breakdown strength and a 10.00% enhancement in the thermal conductivity.
1. Introduction
In recent years, the expansion of agricultural land and the development of industrial parks have led to a considerable reduction in the number of trees along transmission lines. This decline has resulted in a considerable increase in bird-related issues because many birds nest and traverse around transmission lines and transmission line towers. The presence of exposed conductive points (Figure 1) or weakly insulated connection parts in these towers can easily cause short-circuit faults, leading to power outages and severe equipment damage. The harm caused by birds to transmission lines is becoming increasingly severe [1, 2].
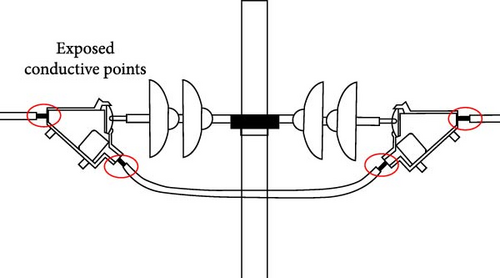
Numerous researchers have extensively investigated bird damage faults in transmission lines, incorporating statistical analyses and insights regarding the habits of birds along these lines. The investigation has yielded several key findings: (1) Bird droppings pose a threat to the insulation safety of air gaps in transmission line towers in two ways: First, when birds defecate near insulator suspension points on crossarms, the highly electrically conductive droppings can short-circuit part of the air gap. Even if the bird droppings do not penetrate the entire air gap, it may still cause flashover. Second, bird droppings contaminating insulator surfaces may cause flashovers along the insulator surface during humid weather, rain, and fog. (2) In addition to bird droppings, bird activities can cause similar faults. Birds preying on small animals might inadvertently bring the internal organs of these animals into contact with power lines during their flight, potentially causing short-circuit trips. Large birds with wingspans exceeding 1 m flying between power lines may cause phase-to-phase short circuits or single-phase grounding faults. (3) In spring, birds begin to nest and hatch on transmission line towers. Twigs, wires, and straws dropped by birds during nest building may accumulate in the air gaps of transmission line towers, causing line faults [3–5]. Statistics from 2006 to 2016 related to the Hubei area reveal the following distribution of bird-induced trips: Bird nests caused six short-circuit faults along the entire line section, accounting for 8.45% of all bird-induced trips; bird droppings led to 61 short-circuit faults, constituting 85.92% of bird-induced trips; bird bodies caused three short-circuit faults, comprising 4.23% of bird-induced trips; and no short-circuit faults were caused by bird damage to insulation devices [6]. A comprehensive understanding of these dynamics is essential for devising effective strategies to mitigate the escalating negative impact of birds on transmission lines.
With the increasing incidence of bird-induced faults in transmission lines, various bird control measures have been applied to transmission lines and along transmission line towers. Based on the bird control principle, these measures can be classified into three categories: (1) manually removing bird nests and cleaning of debris introduced by birds; (2) installing bird repellent and shield of bird guard; and (3) installing insulation sheaths and other devices to prevent direct contact between bird droppings and the exposed conductive points in transmission lines. Among them, the first category is labor-intensive and incurs high costs. Further, the effectiveness of bird repellents and shield of bird guard may vary based on bird habits, and their installation is difficult in narrow spaces or complex-shaped areas. In case of the third category, gaps are formed within insulation sheaths during their use. Moreover, these sheaths exhibit poor insulation protection ability, making them susceptible to moisture intrusion. In addition, the installation method of insulation sheaths is not suitable for complex parts of transmission line towers.
Bird-related foreign objects (bird bodies, nesting materials, and droppings) create conductive paths in the insulation gaps between towers and conductors, reducing the insulation strength of the tower gaps. Therefore, there is an urgent need to find an effective method to enhance the insulation strength of tower gaps in transmission lines, thereby, improving the stability, safety, and reliability of transmission lines. The use of polyurea to insulate the coating on exposed parts and locally damaged insulation on transmission line towers is an effective method for reducing bird-induced line faults. To meet the process requirements of insulation spraying, the insulation coating material should possess rapid room-temperature curing ability, strong electrical insulation properties, and strong surface hydrophobicity. Sprayed polyurea elastomer coatings are a type of A–B two-component, solvent-free, and fast curing elastic material. Component A is a semi-prepolymer prepared via the reaction of terminal amino or hydroxyl compound with isocyanate, while component B is a mixture comprising terminal amino resin and terminal amino chain extender. Moreover, component B must not contain any hydroxyl components and catalysts but can contain a small amount of pigments and additives. Components A and B are mixed and sprayed using a spray gun, and the elastomer coatings are formed by the rapid reaction and solidification of the two components. Moreover, the coatings exhibit many advantages, such as high solid content, low viscosity, and high mechanical properties [7]. The unparalleled rapid curing time (gel time = 5 s) of the polyurea elastomer coatings surpasses those of other coatings, such as the epoxy resin–thiol coating (gel time = 5 min) [8, 9]. However, a protective layer solely constructed with polyurea elastomer lacks optimal surface hydrophobicity, electrical insulation performance, and thermal conductivity. The combination of polymers with fillers has been reported to enhance various properties of local insulation coating materials. Commonly used fillers include ceramic particles, such as aluminum oxide (Al2O3), silicon dioxide (SiO2), and boron nitride (BN) [10–14].
Herein, an orthogonal experiment was designed to modify a polyurea prepolymer matrix with Al2O3, SiO2, and BN particles. The effects of filler content on the physical properties of polyurea, such as the alternating current (AC) breakdown strength, thermal conductivity, and water contact angle, were investigated. Additionally, AC breakdown tests were conducted on simulated transmission line tower gaps to analyze the effect of polyurea coating thickness on the ground potential side on the gap breakdown voltage. This study aims to provide a theoretical basis for the engineering application of rapid-curing local insulation coatings, addressing the shortcomings of traditional methods and advancing the efficacy of bird control measures in transmission line maintenance.
2. Materials and Methods
Polyurea coatings (SPE-220 grade; 99% purity) were purchased from Shijiazhuang Weishiqi New Materials Co., Ltd. (Shijiazhuang, China). Al2O3 nanoparticles (purity = 99.99% and size = 30–50 nm) and hydrophobic SiO2 nanoparticles (purity = 99.8%, size = 7–40 nm, and specific surface area = 115 m2/g) were supplied by Shanghai Maclin Biochemical Technology Co., Ltd. (Shanghai, China). The high-purity BN powder (purity = 99.99% and size = 1–3 µm) was supplied by Nangong Xindun Alloy Welding Materials Co., Ltd. (Nangong, China).
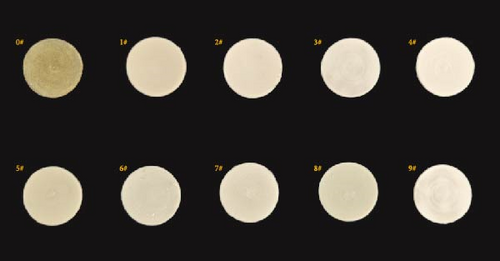
An orthogonal experiment was used to study the effect of various fillers on the properties of room temperature–cured epoxy resin systems. The study focused on three factors—nanoscale Al2O3, nanoscale SiO2, and micron-scale BN—each selected at three levels relative to 100 parts of polyurea. The designed orthogonal-factor levels are shown in Table 1, where 0# represents the control group without any fillers. The design of the orthogonal experimental table is shown in Table 2.
| Level | Factor | ||
|---|---|---|---|
| Al2O3 (wt%) | SiO2 (wt%) | BN (wt%) | |
| 1 | 1 | 0.4 | 1 |
| 2 | 3 | 0.8 | 3 |
| 3 | 5 | 1.2 | 5 |
- Abbreviations: Al2O3, aluminum oxide; BN, boron nitride; SiO2, silicon dioxide.
| Group | Factor level | ||
|---|---|---|---|
| Al2O3 (wt%) | SiO2 (wt%) | BN (wt%) | |
| 0# | 0 | 0 | 0 |
| 1# | 1 | 0.4 | 1 |
| 2# | 1 | 0.8 | 3 |
| 3# | 1 | 1.2 | 5 |
| 4# | 3 | 0.4 | 3 |
| 5# | 3 | 0.8 | 5 |
| 6# | 3 | 1.2 | 1 |
| 7# | 5 | 0.4 | 5 |
| 8# | 5 | 0.8 | 1 |
| 9# | 5 | 1.2 | 3 |
- Abbreviations: 0#, control group without any fillers; Al2O3, aluminum oxide; BN, boron nitride; SiO2, silicon dioxide.
A two-component polyurea composite material was used as the matrix. Equal masses of components A and B were measured; subsequently, other functional fillers were added. The measured nanoscale Al2O3 and high-purity BN powder were evenly divided and added to components A and B. Considering the low density and large amount of hydrophobic SiO2 nanoparticles, components A and B were added in a 1:2 ratio to ensure that the viscosities of these two components were the same. The components and fillers were thoroughly mixed in a vacuum planetary mixer (MT-300, Marath, Shenzhen) at 600 r/min. The two mixed components were then heated to 60°C in an oven; vacuum extraction was performed during the heating process to prevent the isocyanate in component A from reacting with moisture in air. Components A and B were mixed and poured into a mold coated with mold-release oil and rapidly stirred in the vacuum planetary mixer for at least 1 min. Figures 2 and 3 show the state of modified polyurea after curing.
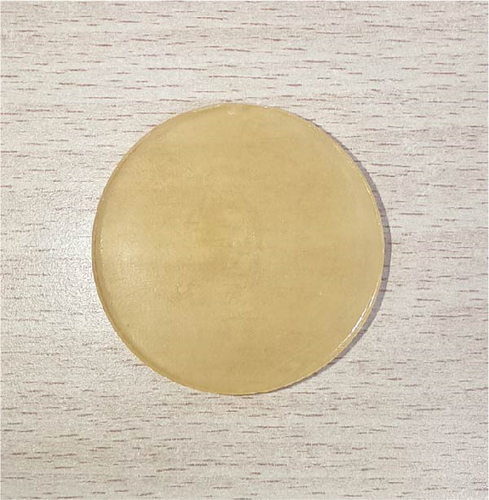
Modified polyurea blocks, measuring 4 cm in diameter and 4 cm in thickness, were cut at various thickness (Figure 3) using a table saw to meet different experimental requirements. A cutting thickness of 8 mm was selected for breakdown strength tests, while a cutting thickness of 4 mm was used for scanning electron microscopy (SEM; FEI QUANTA FEG250, US), necessitating manual tearing because the SEM observation surface was the fracture surface. The microstructure of the samples was observed via SEM at a working voltage of 5 kV, with platinum sputter coating applied to the samples before observation. The elemental composition of the samples was characterized via energy-dispersive X-ray spectrometry (EDS; EDAX Element, US) at a working voltage of 20 kV. The fracture surface morphology of the test sample and the distribution of filler nanoparticles were also investigated via SEM.
Fourier-transform infrared (FTIR; IRTracer-100, Shimadzu, Japan) spectroscopy was conducted on the sample powder after sandpaper polishing to characterize the chemical structure and functional group composition of the samples. Sample powder was dried overnight at room temperature at 20°C and then subjected to vacuum drying at 50°C to complete moisture removal. Subsequently, polyurea powder was added to potassium bromide (KBr) pellets for molding. Scanning was performed 200 times at a resolution of 2 cm.
In accordance with the Tui Jian Xing Guo Jia Biao Zhun (GB/T) 1408.1-2016 testing standard, the breakdown strength of the samples under an alternating electric field was measured at a voltage ramp rate of 1 kV/s and at room temperature. A spherical electrode was used for testing; the sample was fixed in a sphere–sphere gap and immersed in transformer-insulating oil, with efforts made to minimize air bubble introduction during immersion. Each sample was subjected to five tests, and the breakdown strength data were analyzed using the Weibull distribution function.
Contact angle testing was performed on the smooth surface of the cured polyurea specimen. According to the GB/T 30693-2014 testing standard, water was selected as the liquid medium for contact angle measurement using a contact angle tester (SZ-CAMD33; Sunzern Shanghai, China). Each sample was tested five times, ensuring the samples remained flat and dry between retests. The testing procedure required placing the sample at the platform center exposing it to a white light source, freezing the image after focusing the camera and saving it. The analysis software was then employed to measure and frame the water drop range, adjust the reference line, and record the contact angle.
Differential scanning calorimetry (DSC; NETZSCH DSC 3500; Sirius, Germany) was used to investigate the thermal characteristics of the modified polyurea elastomers. Sample specification for testing instruments in powder form, weighing between 3 and 5 mg, were subjected to an experimental temperature range of −30 to 400°C in a nitrogen atmosphere with a temperature increase rate of 15°C/min.
According to Dian Li Hang Ye Tui Jian Biao Zhun (DL/T) 1580-2016, where five copies of one group of polyurea samples with different filler ratios with a specimen thickness of 30 ± 0.5 mm are boiled in deionized water containing 0.1% NaCl for 100 h, wiped dry, and placed on a 12-kV plate electrode. A current sensor (Rigol-DM3068; Rigol, China) is used to measure the leakage current with an accuracy of ±0.1 μA. During the test, any breakdown or surface flashover was observed.
The dielectric properties of the samples were tested using an impedance spectrometer (Alpha-A; Novocontrol, Germany) at a frequency of 50 Hz. The samples were first cut into small disks with a diameter of 20 mm, sandwiched between two copper sheets, and finally placed on the sample stage for testing. The samples were tested at room temperature, and each sample was tested at least three times. Finally, the average value was considered.
A dielectric constant tester (WY2858-2; Shanghai Precision Instrumentation Co., Ltd., China) was used to determine the dielectric constants using a test frequency of 50 Hz and a sample size of 20 mm × 20 mm × 1 mm.
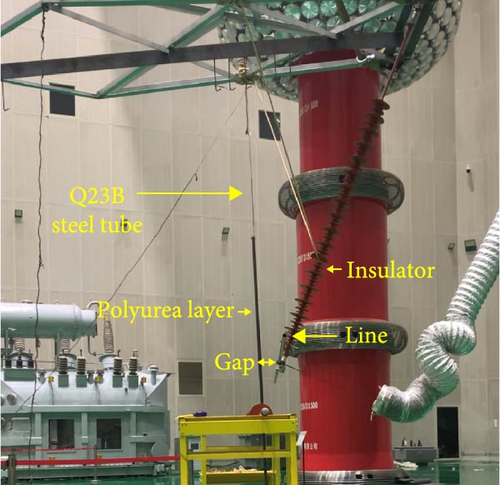
A tower gap breakdown test platform was constructed to test the improvement in gap breakdown strength after partial insulation, as shown in Figure 4. The platform’s steel structure was made of Q235B steel, simulating the actual conditions of a straight tower through a welded tower head-crossarm structure. A composite insulator was suspended below the crossarm, with its lower end connected to a 2-meter-long, 20 mm outer diameter aluminum tube. In this test, the aluminum tube was used instead of a steel-core aluminum stranded wire, and the ground electrode was a 20 mm diameter steel pipe. According to the national standard GB 50545 “Design Code for Overhead Transmission Lines of 110 kV ~ 750 kV” section 7.0.9, the minimum gap between the 110 kV live parts and the tower structure is 0.25 m. During the test, the distance between the high-voltage electrode and the ground electrode was adjusted to 0.25 m. Steel pipes with different polyurea coating thicknesses were used as ground electrodes. Voltage was applied through a power frequency transformer, increasing at a rate of 2 kV/s until breakdown. Each test group was repeated 10 times, and the voltage at which each sample broke down in the air–solid combined insulation gap was recorded.
3. Results and Discussion
Figure 5 shows the FTIR spectra of polyurea-cured materials with different filler loading combinations. These spectra reveal similar characteristic absorption peaks, including the absorption peaks observed at 1643 cm−1 corresponding to the C═O in the urea group, 1599 cm−1 corresponding to the N─H in the urea group, and 3292 cm−1 corresponding to the N─H stretching vibration, confirming urea group formation in polyurea-cured materials [15]. Additionally, the absorption peak observed at 2970 cm−1 corresponds to the C─H stretching vibration, while the absorption peaks observed at 2918 and 2870 cm−1 correspond to the asymmetric and symmetric stretching vibrations of methylene C─H, respectively. At a frequency of approximately 1085 cm−1, a vibrational peak corresponding to C─O─C stretching was detected. Furthermore, a characteristic peak for amino N═C═O stretching of isocyanate was observed at 1721 cm−1. Another peak observed at 1450 cm−1 indicated CH2 stretching, while the peak observed at 1370 cm−1 was due to CH3 stretching [16]. In particular, the CH3 peaks of 3#, 5#, and 7# are higher than the other samples, which may be related to the added BN content. As BN content increased, CH3 generation was promoted, resulting in an increase in CH3 content. This phenomenon, in turn, increased the intermolecular contact area and enhanced the van der Waals force, ultimately affecting the thermal conductivity of the polyurea coating.
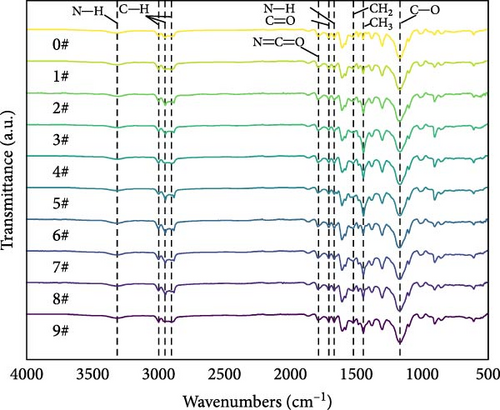
Figure 6 depicts the internal fracture morphology of cured samples with different mass fractions of fillers. The images highlight diverse surface nanofiller distribution densities, which affect the internal electrical insulation structure, thermal conduction network, and surface roughness of the resulting cured samples. In particular, samples 3#, 4#, and 9# exhibit low nanofiller distribution on their surfaces, resulting in reduced surface roughness and consequently, affecting the hydrophobicity of the polyurea-cured coating. Furthermore, the morphology of BN, SiO2, and Al2O3 was observed via SEM. The SEM image of BN revealed a smooth sheet-like structure (Figure 6d), while the SEM images of SiO2 and Al2O3 revealed nearly spherical nanostructures (Figure 6g). Additionally, some of the nanofillers were found to be agglomerated (Figure 6j).
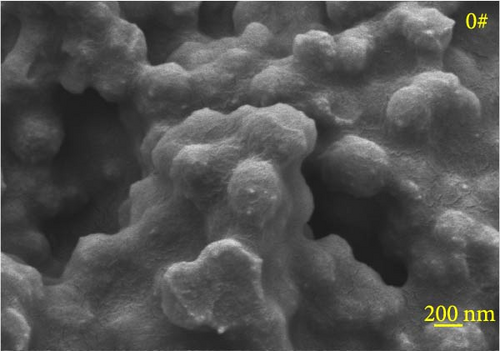
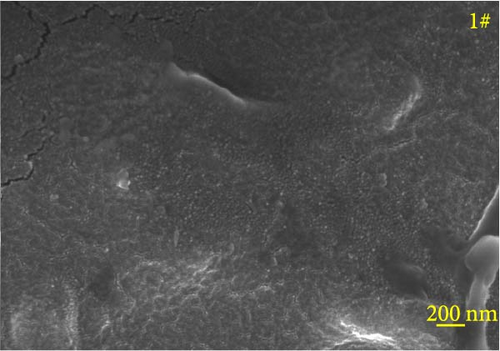
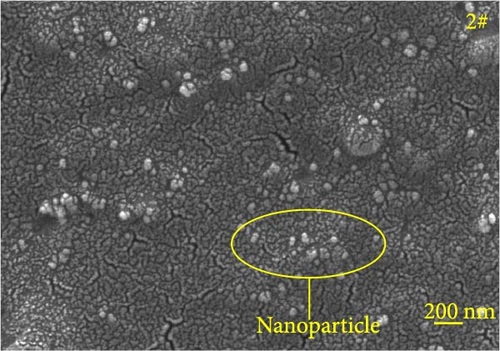
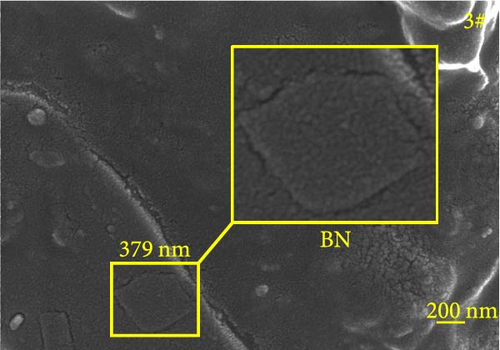
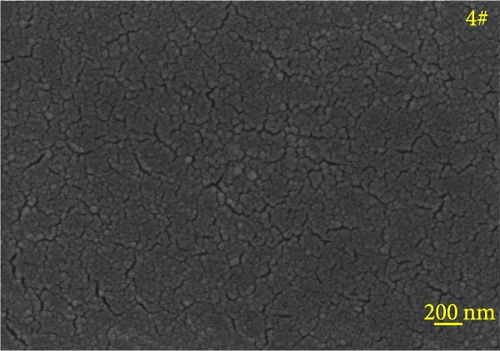
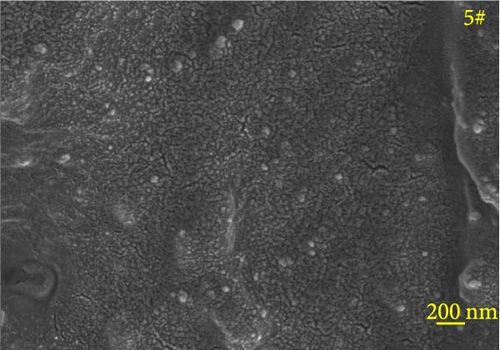
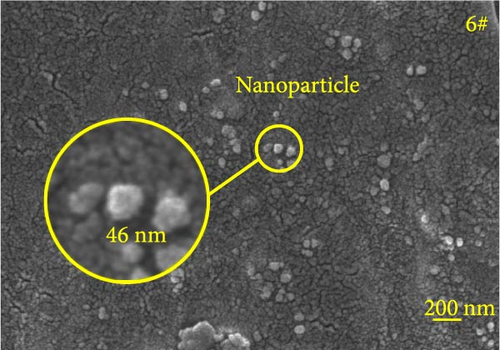
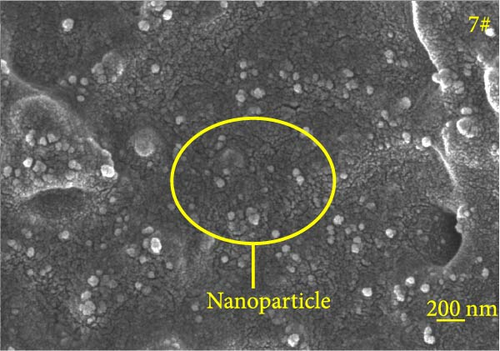
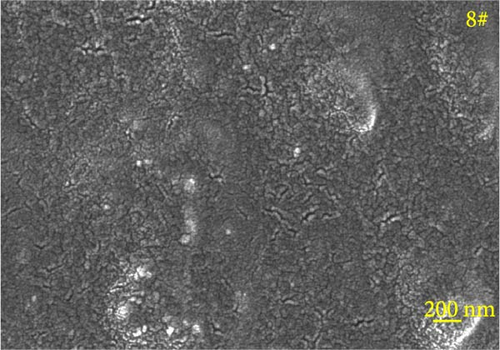
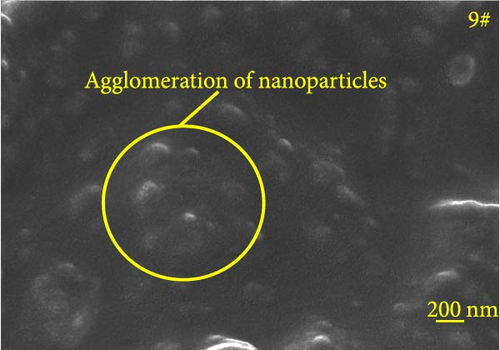
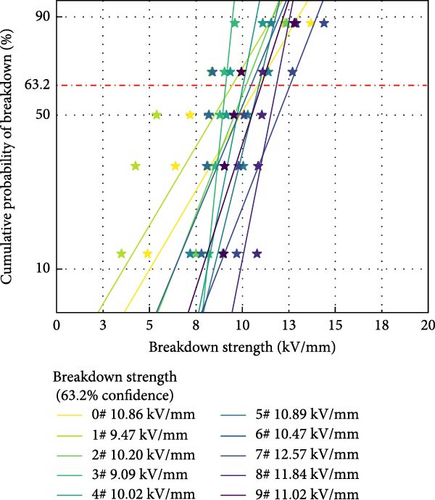
Figure 7 shows the Weibull probability distribution of the AC breakdown strength for polyurea-cured products doped with fillers at different mass fractions. Table 3 presents the mean and range of the AC breakdown strength at different levels of each factor. The influence of each factor on the AC breakdown strength is in the order of X > Y > Z. Increasing Al2O3 content enhances the AC breakdown strength of the polyurea-cured product. This is because when nanoparticles with a large specific area are doped into polyurea, they eliminate the defects in the curing system without introducing new defects. However, excessive nanoparticle content leads to their agglomeration, decreasing the AC breakdown strength of the polyurea-cured product. Therefore, the AC breakdown strength of the polyurea-cured product first increases and then decreases with increasing SiO2 content. When micron-sized particles are doped into polyurea, they do not form a close bond with the matrix owing to their large particle size and small specific surface area. This results in the formation of additional defects, which decreases the AC breakdown strength of the polyurea-cured product [17]. However, when the content of nanoparticles is high, their presence can eliminate defects to a certain extent. Therefore, the AC breakdown strength of the polyurea-cured product will first decrease and then increase with increasing BN content.
| Project | Factor | ||
|---|---|---|---|
| Al2O3 (X) | SiO2 (Y) | BN (Z) | |
| Level 1 mean | 9.59 | 10.75 | 10.59 |
| Level 2 mean | 10.52 | 10.98 | 10.47 |
| Level 3 mean | 11.81 | 10.19 | 10.85 |
| Range | 2.22 | 0.79 | 0.38 |
- Abbreviations: AC, alternating current; Al2O3, aluminum oxide; BN, boron nitride; SiO2, silicon dioxide.
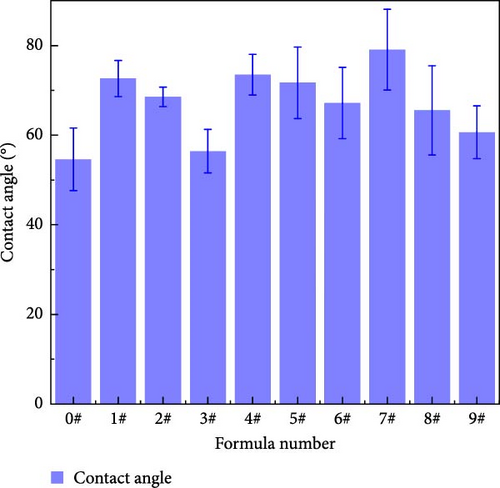
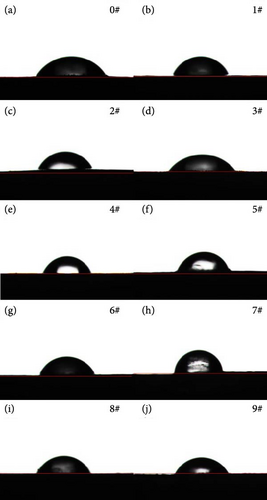
Figure 8 shows the contact angle of polyurea-cured products doped with fillers at different mass fractions. Table 4 presents the mean and range of contact angles at different levels for each factor. The influence of each factor on the contact angle is in the order of Y > X > Z. As shown in Figure 9, doping nanofillers into the curing system leads to a varying increase in the water static contact angle of the polyurea-cured product. This increase is attributed to the elevated surface roughness of the sample induced by microparticles and nanoparticles, causing reduced surface wettability and increased material contact angle. Notably, SiO2 exerts a more substantial influence on the contact angle of the cured product than the other two fillers. Increased SiO2 mass fraction promotes nanoparticle agglomeration on the sample surface, combined with the effect of micron-sized BN, resulting in reduced surface roughness and hydrophobicity [18].
| Project | Factor | ||
|---|---|---|---|
| Al2O3 (X) | SiO2 (Y) | BN (Z) | |
| Level 1 mean | 65.87 | 75.08 | 68.45 |
| Level 2 mean | 70.80 | 68.59 | 67.56 |
| Level 3 mean | 68.42 | 61.41 | 69.07 |
| Range | 4.93 | 13.67 | 1.51 |
- Abbreviations: Al2O3, aluminum oxide; BN, boron nitride; SiO2, silicon dioxide.
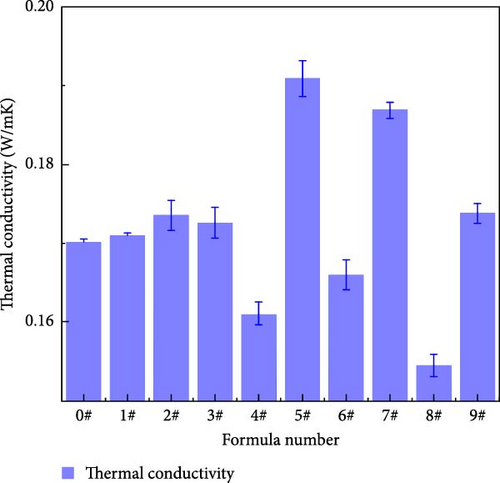
Figure 10 illustrates the thermal conductivity of polyurea-cured products doped with fillers at different mass fractions. Table 5 provides the mean and range of the thermal conductivity at different levels of each factor. The influence of each factor on the thermal conductivity is in the order of Z > Y > X. Polymer materials inherently possess low thermal conductivity owing to the disordered structure of their molecular chain segments. Incorporating thermally conductive particles into polymer materials is an effective method to enhance the thermal conductivity of these materials [19]. When BN nanosheets connect with polyurea molecules to form thermal conductive channels, heat is conducted through the hexagonal BN lattice. When the BN filler is uniformly dispersed in the polymer matrix and present in high content, it connects individual filler particles to form a thermal conductive network structure. Therefore, the thermal conductivity of the polyurea-cured product increases with increasing BN mass fraction in the polyurea curing system.
| Project | Factor | ||
|---|---|---|---|
| Al2O3 (X) | SiO2 (Y) | BN (Z) | |
| Level 1 mean | 0.17240 | 0.17295 | 0.16387 |
| Level 2 mean | 0.17265 | 0.17300 | 0.16943 |
| Level 3 mean | 0.17172 | 0.17082 | 0.18347 |
| Range | 0.00093 | 0.00218 | 0.01960 |
- Abbreviations: Al2O3, aluminum oxide; BN, boron nitride; SiO2, silicon dioxide.
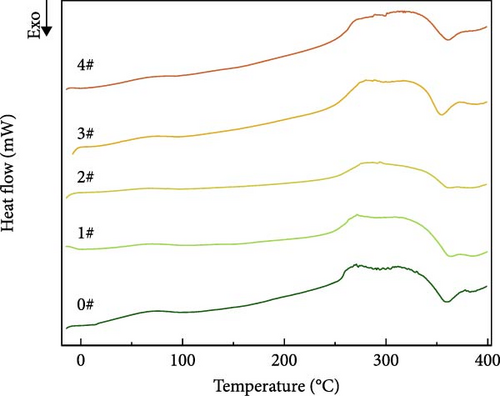
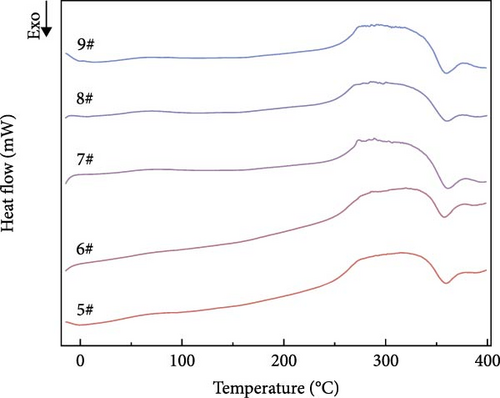
DSC curves for polyurea cures containing different mass fractions of fillers were analyzed. As shown in Figure 11, all the curves showed a main transition near 25°C, which is the glass transition temperature of polyurea according to the literature [20]. Interestingly, no notable peak heat absorption was observed near 300°C, which may be attributed to decreased regularity within the microregions of the hard segments caused by chemical cross-linking bonding. In addition, a sharp exothermic peak appeared in all the samples near 350°C. This could be attributed to the fact that some reactants were not yet involved in the reaction due to the fast curing rate of the samples, and when the samples melted at 300°C, these reactants were able to come into contact with each other again and thus continue the reaction, which led to exothermic effects of varying degrees. As shown in Table 6, the mean and extreme deviations of the glass transition temperature at different levels for each factor demonstrate that Z > X > Y in terms of the influence on thermal stability. This is likely due to in situ chemical bonding between the amino group on the surface of BN and the isocyanate group. This results in strong hydrogen bonding and enhanced molecular cohesion strength, which improves the interfacial interaction [21]. With increasing mass fraction of BN in the polyurea cure system, the thermal stability of the resulting material increases.
| Project | Factor | ||
|---|---|---|---|
| Al2O3 (X) | SiO2 (Y) | BN (Z) | |
| Level 1 mean | 30.6 | 25.4 | 20.3 |
| Level 2 mean | 26.1 | 23.7 | 29.7 |
| Level 3 mean | 24.1 | 30.1 | 30.8 |
| Range | 6.5 | 6.4 | 10.5 |
- Abbreviations: Al2O3, aluminum oxide; BN, boron nitride; SiO2, silicon dioxide.
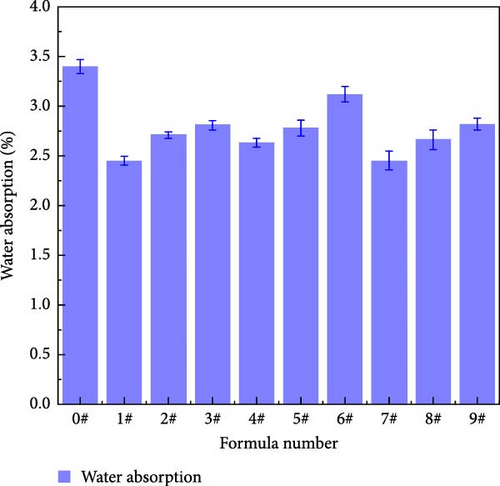
The water absorption rates of the polyurea curing compounds containing different mass fractions of fillers are shown in Figure 12. The mean and extreme differences in water absorption at different levels of each factor are presented in Table 7; these differences indicate that the impact of each factor on the water absorption rate follows the order of Y > X > Z. The presence of urea groups in polyurea increases the water absorption rate due to the formation of hydrogen bonds between NH2 and water, which increases the hydrophilicity [22]. With the addition of nanofillers, all the polyurea molecules display, to some extent, a decrease in water absorption. This is because the nanoparticles fill in the pore defects and reduce water penetration into the material. However, increasing the content of nano-SiO2 leads to nanoparticle agglomeration, which amplifies the defects and increases the number of fine pores connected to the outside surface of the polyurea, ultimately increasing the water absorption rate.
| Project | Factor | ||
|---|---|---|---|
| Al2O3 (X) | SiO2 (Y) | BN (Z) | |
| Level 1 mean | 2.66 | 2.51 | 2.80 |
| Level 2 mean | 2.84 | 2.72 | 2.67 |
| Level 3 mean | 2.64 | 2.92 | 2.68 |
| Range | 0.2 | 0.41 | 0.13 |
- Abbreviations: Al2O3, aluminum oxide; BN, boron nitride; SiO2, silicon dioxide.
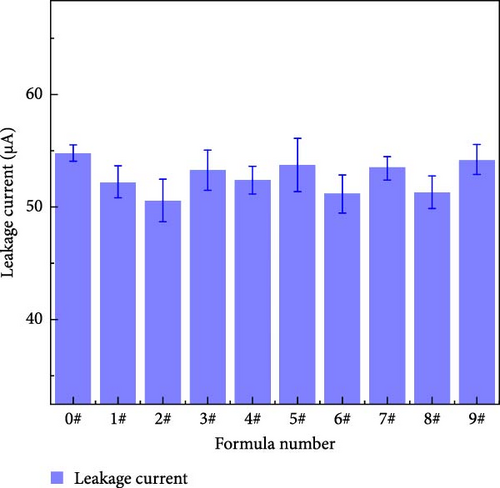
Figure 13 shows the leakage currents of the polyurea samples containing different mass fractions of fillers. Table 8 shows the means and extreme differences of the leakage current at different factor levels. As shown in Table 8, the degree of influence of each factor on the leakage current follows the order of Z > Y > X. The leakage current of the cured material initially decreases and subsequently increases with increasing nanoparticle content. Nanoparticles can effectively connect polyurea molecules, which reduces electron mobility while eliminating the internal defects of polyurea, which decreases the leakage current. However, with increasing nanoparticle content, the particle agglomeration causes the leakage current to increase again. With increasing BN content, because the specific surface area of the micron BN is smaller than that of the nanoparticles and the particle size is excessively large to eliminate the defects in polyurea, micron particles may introduce new defects; therefore, leakage current gradually increases with increasing BN. When the content of micron-sized BN is low, the ability of other nanoparticles to eliminate defects may be greater than the ability of micron-sized BN to introduce defects; therefore, the leakage current appears to decrease slightly compared with that of the control group. In addition, the addition of fillers had little effect on the polyurea leakage current. This may be due to the change in the leakage current being mainly the result of the presence of penetrating defects inside the material; therefore, the introduction of fillers does not result in the polyurea samples having larger internal defects inside; therefore, the change in the leakage current is not obvious [23].
| Project | Factor | ||
|---|---|---|---|
| Al2O3 (X) | SiO2 (Y) | BN (Z) | |
| Level 1 mean | 2.66 | 2.51 | 2.80 |
| Level 2 mean | 2.84 | 2.72 | 2.67 |
| Level 3 mean | 2.64 | 2.92 | 2.68 |
| Range | 0.2 | 0.41 | 0.13 |
- Abbreviations: Al2O3, aluminum oxide; BN, boron nitride; SiO2, silicon dioxide.
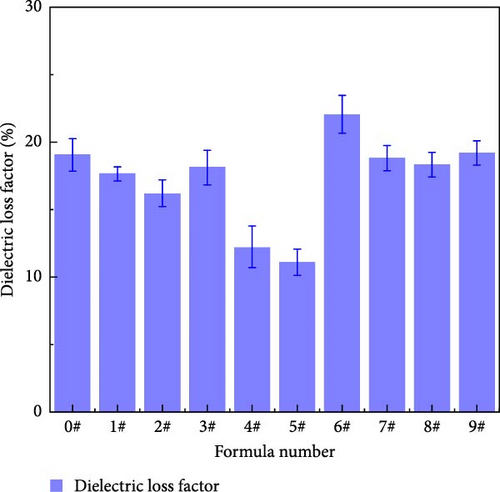
Dielectric loss is one of the most important quality indicators for dielectrics used in AC electric fields. Dielectric loss not only consumes electrical energy, but also heats up the components on transmission towers, affecting their normal operation. Figure 14 shows the dielectric loss factors of different polyurea samples. Table 9 shows the means and extreme differences of the dielectric loss factors at different levels of each factor. The degree of influence of each factor on the dielectric loss follows the order of Y > X > Z. With increasing mass fraction of nano-SiO2, dielectric loss factor (tan δ) first decreases and then increases. This may be due to the fact that when the nano-SiO2 content is low, it is more evenly distributed in the polyurea; tan δ decreases owing to the large specific surface area of the nanoparticles, which increases their connection with the polyurea matrix, binds the movement of the carriers, and inhibits the polarization of the material. However, with increasing SiO2 content, the resulting agglomeration causes the interfacial layer formed by the nanoparticles and polyurea to overlap. Thus, the ability to inhibit the material polarization is weakened, which results in increased tan δ [24]. Furthermore, the case of nano-Al2O3 is similar to that of SiO2, where tan δ decreases at low contents and clustering occurs at 5%, resulting in overlap of the interfacial layer; thus, tan δ tends to first decrease and then increase [25]. Compared with that of the nanoparticles, the specific surface area of the micron-sized particles is smaller; therefore, the effect of hindering the polarization of the medium is not obvious after doping with the micron-sized particles. Moreover, increasing the BN content enhances the polarization behavior of the composites to a certain extent, which may be attributed to the larger molecular size of the micron-sized particles. In addition, the presence of BN disturbs the distribution of the polarized molecules and inhibits friction and collision between the polarized molecules, which continuously reduces the dielectric loss of polyurea [26, 27].
| Project | Factor | ||
|---|---|---|---|
| Al2O3 (X) | SiO2 (Y) | BN (Z) | |
| Level 1 mean | 17.33 | 16.58 | 19.34 |
| Level 2 mean | 15.46 | 15.21 | 16.22 |
| Level 3 mean | 18.8 | 19.79 | 16.03 |
| Range | 3.67 | 4.58 | 3.31 |
- Abbreviations: Al2O3, aluminum oxide; BN, boron nitride; SiO2, silicon dioxide.
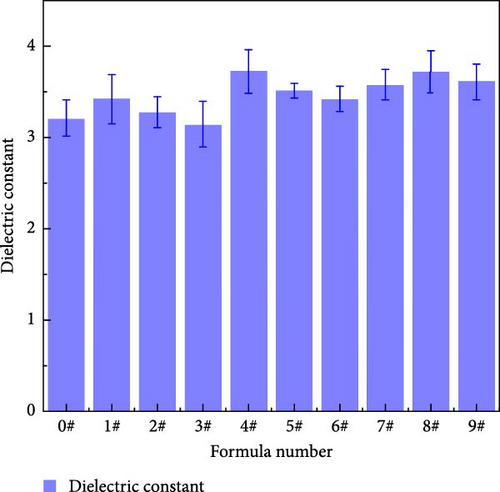
The dielectric constant is the most fundamental dielectric parameter of a material and is closely related to the macroscopic electrical properties of the material, such as flashover voltage along the surface and electrical strength [28]. Figure 15 shows the dielectric constant at 50 Hz for samples with different polyurea samples. Table 10 shows that the degree of influence of each factor on the dielectric constant follows the order of X > Y > Z, which is the same as the results of the AC breakdown strength test. However, from the dielectric constant data, the filler ratio does not have an obvious effect on the size of the dielectric constant. This may be due to the polyurea dielectric constant being mainly determined by the number of carbon atoms in the molecular chain [29]. However, although increased nanofiller content will affect the molecular interchain force, which improves the dielectric constant, the superposition of three fillers will result in internal electric field distortion in the material, which makes the enhancement of the polyurea dielectric constant not obvious [30].
| Project | Factor | ||
|---|---|---|---|
| Al2O3 (X) | SiO2 (Y) | BN (Z) | |
| Level 1 mean | 3.28 | 3.58 | 3.52 |
| Level 2 mean | 3.55 | 3.50 | 3.54 |
| Level 3 mean | 3.64 | 3.39 | 3.41 |
| Range | 0.36 | 0.19 | 0.13 |
- Abbreviations: Al2O3, aluminum oxide; BN, boron nitride; SiO2, silicon dioxide.
The results of orthogonal experiments show that the dosage of nano-SiO2 is the main factor affecting the contact angles, water absorption, and dielectric loss factor of polyurea composite and that it is the secondary factor affecting the AC breakdown strength; accordingly, it is determined that the optimal dosage of nano-SiO2 is 0.4%. Furthermore, the dosage of nano-Al2O3 is the main factor affecting the AC breakdown strength of the material, and it is the secondary factor affecting the contact angles and water absorption rate; therefore, the optimal dosage of nano-Al2O3 is determined to be 5%. Moreover, the dosage of micron BN mainly affects the thermal conductivity of the material; accordingly, it is determined to be 5% of the dosage of micron-sized BN.
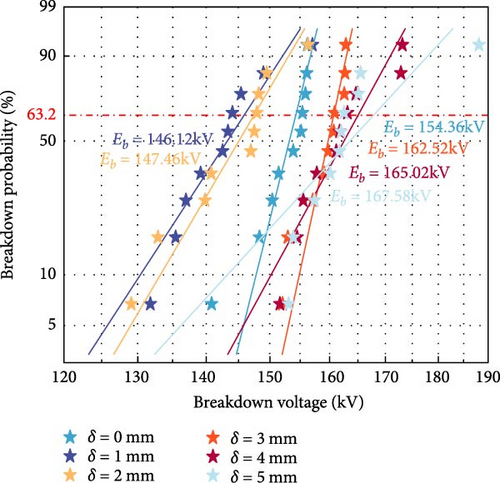
The best formula of polyurea composite material was used to carry out the gap breakdown test. Figure 16 shows the Weibull distribution of the breakdown voltage of the combined insulation gap with different polyurea coating thicknesses at a minimum gap distance of 0.25 m. The analysis shows that compared to the uncoated gas insulation gap, the characteristic breakdown voltage of the gas-solid combined insulation gap formed by applying a polyurea coating at the ground potential has shown varying degrees of improvement. The characteristic breakdown voltages (Eb) were 146.12 kV, 147.46 kV, 154.36 kV, 162.52 kV, 165.02 kV, and 167.58 kV, respectively. When the polyurea coating thickness is relatively small (1 or 2 mm), the characteristic breakdown voltage decreases, with the maximum voltage drop being 8.24 kV. This phenomenon may be due to the fact that although a thinner polyurea coating reduces the maximum electric field strength on the coating surface to some extent, this reduction is not sufficient to effectively influence the breakdown voltage of the entire combined gap. Additionally, the low conductivity of the polyurea coating surface leads to charge accumulation on the coating surface, thereby, reducing the insulation performance of the air gap and consequently lowering the breakdown voltage of the combined insulation gap. As the thickness of the polyurea coating further increases, the characteristic breakdown voltage of the combined insulation gap shows an upward trend. When the thickness δ increases from 1 to 5 mm, the characteristic breakdown voltage increases from 146.12 to 167.58 kV, representing a maximum percentage increase of 8.564% compared to the local insulation before the tower side of the transmission line. The reason is that as the thickness of the polyurea coating increases, the maximum electric field strength on the coating surface further decreases, significantly inhibiting the development of streamers in the air gap, thereby, increasing the breakdown voltage. In summary, applying a polyurea coating with a thickness of 4–5 mm on the ground potential side of the tower can significantly improve the insulation strength of the tower gap.
4. Conclusions
In this study, the physicochemical and electrical properties of a modified polyurea composite containing different fillers were investigated. Moreover, the effects of different particles and their dosage on the comprehensive performance of the polyurea curing system as well as the synergistic effects of three types of particles on the polyurea curing system were analyzed through orthogonal experiments. Furthermore, the optimal formulation of the local insulating spray coating material was determined based on the results of the orthogonal experiments. The main factors affecting the performance of polyurea were related to the content and type of these fillers. When the content of is large, the agglomeration phenomenon of the nanoparticles will make the relevant properties of the material decrease to different degrees. In addition, the results of SEM analysis, the AC breakdown strength test, and the dielectric properties test demonstrated that the nanoparticles can be combined with polyurea and compensate for the defects of polyurea to a certain extent; therefore, modified polyurea composite can withstand high voltages. DSC and thermal conductivity tests show that the addition of fillers enhances the intermolecular cohesion strength of polyurea, improves the thermal stability and thermal conductivity of polyurea. Tower gap breakdown test demonstrate effectiveness of composites for bird damage faults protection.
In conclusion, this paper provides a new and feasible material formulation for the use of polyurea insulating coatings on transmission line towers, and when the dosages of Al2O3, SiO2, and BN are 5, 0.4, and 5 wt% respectively, exhibiting the best overall performance. The AC breakdown strength, water contact angle, thermal conductivity, water absorption, leakage current, dielectric loss factor, and dielectric constant of the polyurea composite at the optimum fillers ratio were 12.57 kV/mm, 79.08°, 0.187 W/mK, 2.45%, 53.44 μA, 18.85%, and 3.58, respectively. As a local insulation for the tower side of transmission lines, tests have proven that when the polyurea coating thickness reaches 5 mm, the gap breakdown voltage increases by 8.564%. A 5 mm thickness of polyurea coating can significantly enhance the insulation strength of tower gaps, reduce the risk of bird-related faults, and thus, improve the stability and safety of transmission lines.
Conflicts of Interest
The authors declare no conflicts of interest.
Funding
This research received no external funding.
Acknowledgments
The authors would like to thank NES Institution for helping in proofreading the grammar of the manuscript.
Open Research
Data Availability Statement
The data used to support the fndings of this study are available from the corresponding author upon request.


