Construction and Identification of Eukaryotic Expression Vector pEGFP-N1-MIC-1 for Mouse MIC-1 Gene and Its Effect on Gastric Cancer Cells
Abstract
This study aimed to construct an eukaryotic expression vector, pEGFP-N1-MIC-1, for overexpressing the mouse macrophage inhibitory cytokine-1 (MIC-1) gene. Additionally, we transfected the MFC cell line to observe the upregulation of MIC-1 gene expression and assess its impact on macrophage phenotype conversion. Enzyme digestion and DNA sequencing confirmed the successful construction of the pEGFP-N1-MIC-1 vector. The transfected MFC cells exhibited a significant increase in MIC-1 protein expression levels. Furthermore, transfection with pEGFP-N1-MIC-1 increased the migration and colony formation capabilities of MFC cells. These results may contribute to future research and the development of therapeutic interventions targeting MIC-1 in macrophages, particularly in the context of gastric cancer.
1. Introduction
Gastric cancer, a malignant tumor affecting the digestive tract, poses a significant threat to individuals, families, and communities, with a 5-year survival rate of less than 40% [1]. Currently, effective treatments for gastric cancer are lacking, necessitating a multidisciplinary approach to diagnosis and treatment. Therefore, it is crucial to investigate the mechanisms underlying gastric cancer development and prevention.
Macrophage inhibitory cytokine-1 (MIC-1), a vital member of the transforming growth factor-β superfamily, was initially discovered by Bootcov et al. [2] and isolated from the cDNA library of U937 macrophages. MIC-1 plays a pivotal role in the development of various digestive system tumors [3]. In early stages of gastric cancer, MIC-1 induces apoptosis and inhibits proliferation, demonstrating anticancer effects. However, in the advanced stage of gastric cancer, changes in the internal environment lead to a pro-cancer effect of MIC-1. These effects are potentially mediated through various mechanisms, including inhibition of β-catenin gene expression, increased protease activity, enhanced degradation of stromal collagen, and decreased cell adhesion. Ultimately, these changes result in cancer cell detachment and metastasis [4].
To further investigate the regulatory role of MIC-1 in gastric cancer development, this study aimed to construct an eukaryotic expression vector, pEGFP-N1-MIC-1, for the MIC-1 gene. The successful construction of this vector will provide a solid foundation for future research endeavors.
2. Materials and Methods
2.1. Cell Culture and Treatment
The MFC cells were cultured in RPMI-1640 (01-100-1A, BI, Kibbutz Beit Haemek, Israel) medium supplemented with 10% fetal bovine serum (FBS; 04-001-1A, BI, Kibbutz Beit Haemek, Israel) and antibiotics at 37°C with 95% humidity and 5% CO2. The cells were seeded at a density of 1 × 10⁶ cells/well in a 6-well plate. Transfection was performed using Lipofectamine TM 2000 (Invitrogen, Carlsbad, CA, USA) according to the manufacturer’s instructions. After 24 hr, the cells were divided into control and pEGFP-N1-MIC-1 groups. The transfection procedure involved separately dissolving the recombinant plasmid pEGFP-N1-MIC-1 and Lipofectamine TM 2000 in serum-free RPMI-1640 culture medium, followed by mixing and incubation. The plasmid–lipid mixture was added to the 6-well plate and incubated at 37°C with 5% CO2 for 6 hr. After that, the medium was replaced with normal culture medium containing serum without antibiotics, and the cells were cultured for another 24 hr. Cell growth and enhanced green fluorescent protein (EGFP) expression were observed using a fluorescence microscope.
2.2. Extraction and Reverse Transcription of Mouse Gastric Tissue RNA and PCR Amplification of MIC-1 Gene Sequence
Healthy mouse gastric tissue was isolated, and total RNA was extracted using Trizol (9108). RNA integrity was assessed using a 1% agarose gel. The intact RNA was reverse transcribed into cDNA using 5x Primescript RT Master Mix. The MIC-1 gene sequence was obtained from the GenBank database, and primers for MIC-1 were designed with QuickCut HindIII (1,615) and QuickCut EcoRI (1,605) restriction endonuclease sites in the forward and reverse primers, respectively. The PCR reaction mixture contained GoTaq qPCR Master Mix (M722), forward and reverse primers, MIC-1 DNA, and sterile water. The resulting PCR products were analyzed by agarose gel electrophoresis.
2.3. Construction and Detection of Recombinant Plasmid pMD18T-MIC-1
PCR products, pMD-18T vector, and ligation solution were mixed for ligation and transformed into competent E. coli DH5α. Plasmid extraction was performed on the resulting bacterial culture, and QuickCut HindIII and QuickCut EcoRI restriction enzymes were used for plasmid digestion. The digestion products were analyzed by agarose gel electrophoresis, and the plasmid with correct restriction patterns was sent for sequencing analysis.
2.4. Construction and Detection of pEGFP-N1-MIC-1 Plasmid
Fragments of pMD18T-MIC-1 plasmid with correct sequencing were cut out from the agarose gel using QuickCut HindIII and QuickCut EcoRI enzymes and then recovered using a gel recovery kit. Large fragments of pEGFP-N1 plasmid were cut with the same enzymes, and the recovered fragments were used for ligation. The ligation product was sent for sequencing analysis to confirm the correctness of the final recombinant plasmid, named pEGFP-N1-MIC-1.
2.5. Cell Transfection
MFC cells were seeded in a 6-well plate and transfected with the pEGFP-N1-MIC-1 plasmid using Lipofectamine TM 2000. After 6 hr, the medium was replaced, and the cells were cultured for an additional 24 hr. Transfection efficiency was evaluated by monitoring cell growth and EGFP expression under a fluorescence microscope.
2.6. Western Blotting to Identify MIC-1 Protein Expression
Total protein was extracted from transfected cells and subjected to western blot analysis using an anti-FLAG-Tag antibody (RG001060). The expression of MIC-1 protein was observed using chemiluminescence.
2.7. Cell Cycle Analysis
After 48 hr of cell transfection, cells were collected by digestion with trypsin, washed twice with PBS, and the supernatant was discarded. Then, 1 ml of 70% precooled ethanol was added to the cells, and they were gently vortexed and fixed at 4°C for at least 24 hr. After that, the cells were washed twice with PBS and resuspended in 0.5 ml of PBS. Then, propidium iodide (PI, Solarbio, IP5030) and RNaseA (R8023) were added to a final concentration of 50 µg/ml, and the cells were incubated at 37°C for 30 min. Finally, cell cycle analysis was performed using flow cytometry. PI, propidium iodide, was prepared at a concentration of 1 mg/ml in PBS and stored at 4°C. RNase A was prepared at a concentration of 10 mg/ml.
2.8. Cell Migration Assay
The migratory ability of MFC cells after pEGFP-N1-MIC-1 transfection was detected by using wound healing assay. Briefly, transfected cells were seeded onto a 6-well plate until they reached 90% confluence. Subsequently, the cell layers of the treated and control groups were uniformly scratched, and the floating cells were washed with sterile PBS and replaced with serum-free medium. The migration of cells in the two groups was observed under a microscope at 24 hr, and the change in the migration ability of both groups was analyzed using the ImageJ software.
2.9. Colony Formation Assay
To further observe its proliferative ability, after transfection for 48 hr, we seeded the cells onto a 6-well plate. The cells were cultured in a medium containing 10% FBS for 2 weeks, with medium change every 3 days until visible colonies grew. Subsequently, the cells were washed once with 1 ml of PBS to remove the supernatant, fixed with 1 ml of methanol, and stained with crystal violet. Colonies containing more than 40 cells were counted, and the results were analyzed using ImageJ software.
3. Results
3.1. Mouse Gastric Tissue RNA Extraction
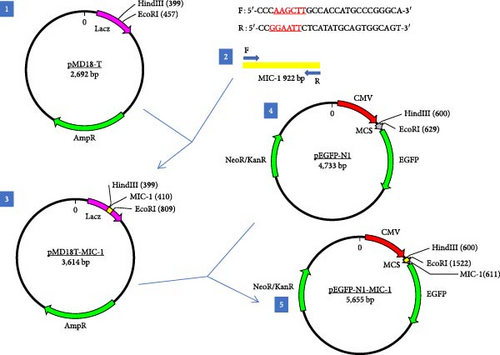
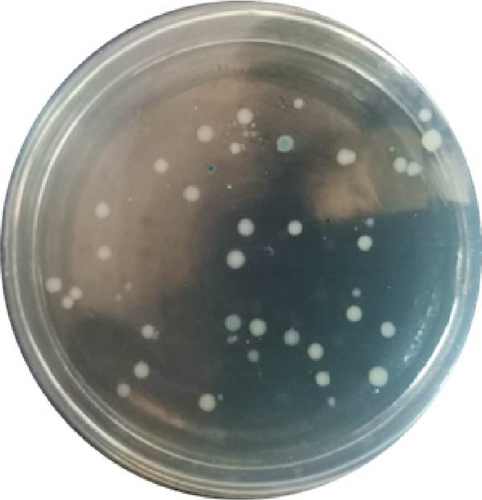
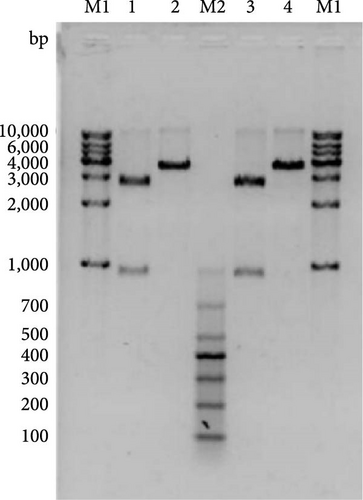
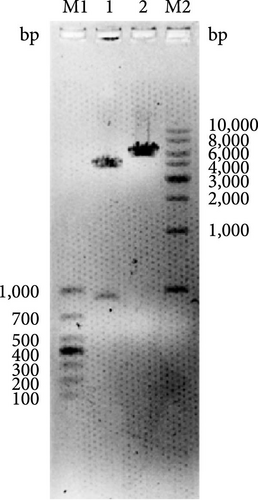
The vector construction process is illustrated in Figure 1. PCR amplification demonstrated that the amplified MIC-1 target fragment aligned with the theoretical result of 922 bp (Figure 2(a)). The purified and recovered PCR-amplified MIC-1 gene fragment was ligated with the pMD18-T vector, resulting in visible positive colonies after transformation (Figure 2(c)). The positive recombinant plasmid was named pMD18-T-MIC-1 following further extraction and digestion with QuickCut HindIII and QuickCut EcoRI. Gel analysis revealed two bands, representing the pMD18-T vector and the 922 bp target fragment, confirming the correct plasmid connection (Figure 2(d)). The pEGFP-N1-MIC-1 vector was digested with QuickCut HindIII and QuickCut EcoRI, resulting in bands that matched the expected 922 bp target fragment and a large fragment of 4.7 kb. Single digestion with QuickCut EcoRI generated a band between 5,000–6,000 bp, consistent with the expected result (Figure 2(e)). MIC-1 protein expression was observed in the pEGFP-N1-MIC-1 group, with a molecular weight of ~34 kD. The EGFP exhibited a molecular weight of 27 kD, while the fusion protein displayed a molecular weight of ~61 kD. The target protein closely matched the theoretical value of 63 kD. These results confirmed successful MIC-1 protein expression in MFC cells transfected with the pEGFP-N1-MIC-1 plasmid (Figure 2(f)).



3.2. Flow Cytometry Analysis of Cell Cycle
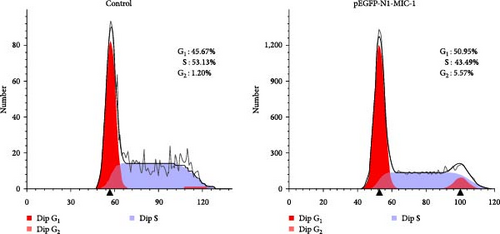
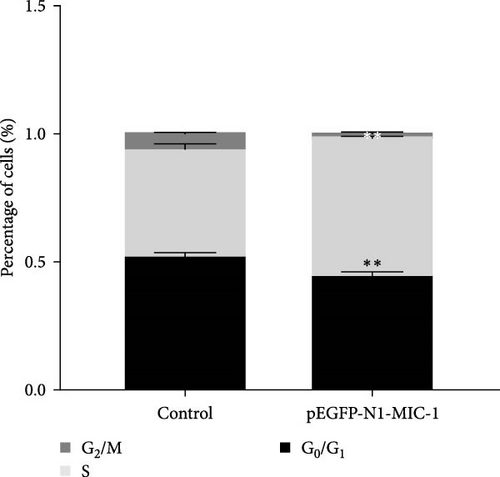
Compared to the NC group, the MFC cells in the pEGFP-N1-MIC-1 group exhibited a decrease in the proportion of G0/G1 phase cells and an increase in the number of cells entering the S phase (Figure 3; ∗∗p < 0.01).
3.3. Cell Migration Assay
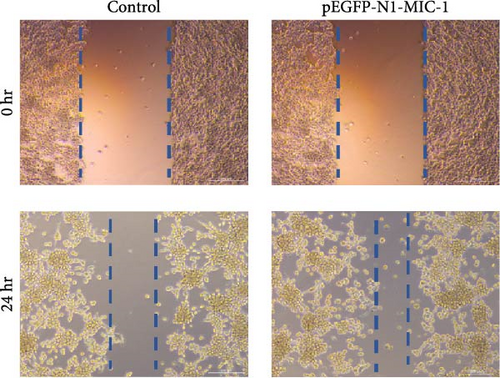
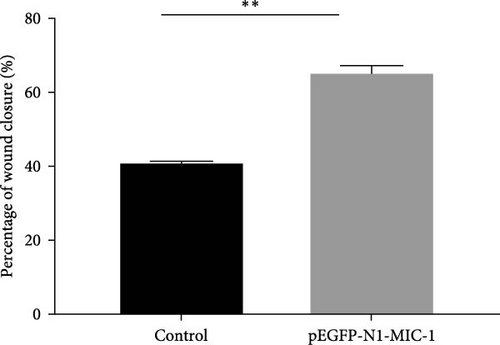
To evaluate the impact of MIC-1 on the migration capability of MFC gastric cancer cells, cell scratch assays were performed. Remarkably, overexpression of the MIC-1 gene significantly enhanced the migration ability of MFC cells. Quantitative analysis at 24 hr using TScratch software revealed that MFC cells with MIC-1 gene overexpression exhibited stronger scratch healing ability compared to the control group (Figure 4; ∗∗p < 0.01). These findings suggest that inhibition of the MIC-1 gene negatively regulates the migration of MFC cells.
3.4. Colony Formation Assay
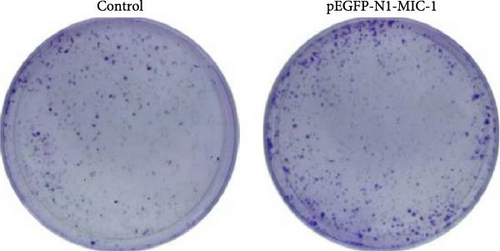
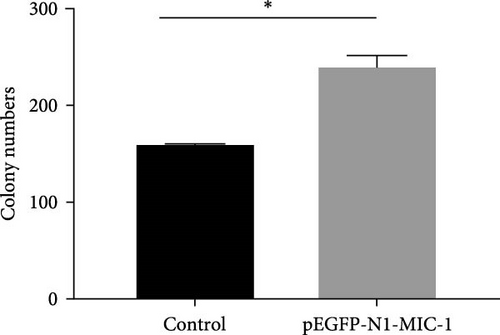
The results demonstrated that the pEGFP-N1-MIC-1 transfected group displayed an increased number of colony-forming cells compared to the control group (Figure 5; ∗p < 0.05). These findings suggest that MIC-1 expression is associated with proliferation of colony formation by MFC cells.
4. Discussion
The occurrence and development of gastric cancer is a continuous and complex process [5]. With advancements and profound research methods, researchers have explored the mechanisms of gastric cancer occurrence and metastasis from various perspectives and made significant breakthroughs. These factors can be broadly classified into four categories, including environment, infection, genomic DNA level, and epigenetics [6]. All these factors play a role in multiple stages of gastric cancer progression, interact with each other, and collectively promote the occurrence and metastasis of gastric cancer.
MIC-1 belongs to the transforming growth factor-β superfamily. It is secreted by active macrophages and has a dual role of inhibition and promotion, participating in multiple stress responses [7, 8]. MIC-1 is expressed to varying degrees in placental, digestive tract, nervous system, and prostate epithelial tissues. Studies have found high expression levels of MIC-1 in various cancer cells and tissues, such as esophageal cancer, lung cancer, prostate cancer, colon cancer, and pancreatic cancer [9, 10, 11]. Its expression level is closely related to the formation, occurrence, and development of tumors, and it participates in tumor cell proliferation, invasion, and metastasis processes [12, 13, 14]. Given its dual role of inhibition and promotion, this study constructed a pEGFP-N1-MIC-1 eukaryotic expression vector by amplifying the MIC-1 gene. Enzymatic cleavage and sequencing analysis confirmed the successful construction of the vector, which was then transferred into MFC cells. Increased EGFP expression was observed under fluorescence microscopy, and western blot analysis showed a significant increase in MIC-1 protein expression, indicating the successful construction of the MIC-1 overexpression cell line and laying the foundation for subsequent studies.
There is evidence indicating that MIC-1 has both carcinogenic and anticancer effects [15]. Literature reports suggest that MIC-1 plays an antitumor role and acts as a negative growth factor in the early stages of cancer [16]. Its activation region is targeted by the tumor suppressor gene p53, which can induce an increase in MIC-1 expression by causing cell cycle arrest and apoptosis [17]. Some studies have also demonstrated that in the middle and late stages of cancer, as the tumor microenvironment changes, MIC-1 expression increases with cancer progression, depth of invasion, and lymph node metastasis, encompassing the entire process of tumor progression [18, 19].
The dual biological roles of MIC-1 in promoting and inhibiting tumors still require further research. Previous studies have found a direct correlation between MIC-1 levels in the serum of gastric cancer patients and the progression of gastric cancer [20]. However, the mechanism of MIC-1 in the occurrence and development of gastric cancer remains unclear. Our study aims to further investigate the biological functions of MIC-1 and its related mechanisms in the occurrence and development of gastric cancer using the MIC-1 overexpression cell line.
5. Conclusions
The MIC-1 indeed exerts an impact on the cellular proliferation of gastric cancer cells while promoting their migration and invasive abilities, potentially leading to further deterioration of gastric cancer. These findings hold certain prognostic significance for the clinical management of gastric cancer.
Conflicts of Interest
The authors declare that they have no conflicts of interest.
Authors’ Contributions
The study was designed by Yiqiang Zhang and HuiPeng Zhang. Data collection was undertaken by HuiPeng Zhang, Zhongyu Qin, and Shuaishuai Shi. HuiPeng Zhang, Yang Song, and YunFei Li have verified the authenticity of all raw data. The final manuscript has been reviewed and approved by all authors.
Acknowledgments
This work was supported by Applied Basic Research Project of Shanxi Province under Grant (numbers 20210302124327, 20210302124574, and BS202118) and Shanxi Scholarship Council of China under Grant (number 2022-167).
Open Research
Data Availability
All research data are documented in the submitted files.


