Efficiency and Safety of Temperatures Management in Aortic Arch Surgery: A System Review and Meta-Analysis
Abstract
Objective. The study evaluates the safety and efficacy of hypothermic cardiac arrest (HCA) at various temperatures in aortic arch surgeries. Methods. We conducted a literature search in PubMed, Google Scholar, and Embase databases. For single proportion assessments, we employed fixed-effect and random-effect models in the general linear mixture model and the inverse variance model for other computations. We analyzed factors such as age, sex, operation time, and postoperative complications, with subgroup and metaregression analyses. We used funnel plots to depict potential publication bias. Results. Our research incorporated 43 papers with 34,797 cases. HCA temperatures were divided into five groups (A: 30–32°C, B: 28–30°C, C: 26–28°C, D: 24–26°C, and E: <24°C). There is no statistically significant difference in myocardial ischemia time (P = 0.90) and isolated cerebral perfusion (ICP) time (P = 0.95). Groups A and C have the best performance in avoiding postoperative complications including transient nerve injury (TNI), permanent nerve injury (PNI), renal failure (RF), and mortality occurrence rate. Group A has the lowest occurrence rate in PNI (3%) and mortality (3%). Group C has the lowest RF incidence (5%). Conclusion. Maintaining temperatures of 30–32°C in en bloc anastomosis or 26–28°C during arch replacement with separate grafts can significantly reduce complications including PNI, RF, and in-hospital mortality.
1. Introduction
Aortic arch surgery is a highly complex procedure within cardiac surgery. Techniques such as hypothermic cardiac arrest (HCA) and selective perfusion are critical in maintaining circulation across multiple organs during open aortic arch surgery. Traditionally, organs have been supported with deep hypothermic cardiac arrest (DHCA) [1, 2]. However, the optimal temperature to induce HCA remains a contentious issue. Despite DHCA’s ability to decrease the metabolic rate and oxygen consumption of primary organs, it concurrently leads to functional impairment [3]. With rapid advancements in cardiac surgery and hybrid techniques, the duration of HCA has been progressively reduced. Concurrently, our understanding and methodologies for monitoring and safeguarding organ function have significantly improved [4].
With an increasing number of centers reporting satisfactory results using moderate HCA in aortic surgeries [5–7], we seek to investigate the most effective temperature for HCA during aortic arch replacement. We aim to strike a balance between reducing oxygen consumption and mitigating low-temperature injury. A number of studies have indicated that antegrade, retrograde, and bilateral cerebral perfusion yield comparable outcomes [8–10]. Hence, we postulate that the operation time and cerebral perfusion temperature play a pivotal role in determining the results of HCA during aortic arch replacement. Our goal is to ascertain the efficacy and safety of HCA at varying temperatures during open aortic arch surgery. We believe that the findings from this investigation will provide valuable guidance for clinical practice.
2. Materials and Methods
2.1. Literature Search Strategy
The PubMed database, Google Scholar database, and Embase database were searched to find related articles. Then, we used these search terms: [(“total” OR “aortic”) AND (“arch replacement”) AND (“temperature” OR “degree” OR “°C”)]. The inclusion time range began in 1990, and the final search was updated until Sep. 2022, with English language only. We filtered duplicated and other fields or types of literature. Finally, we excluded meta-analyses, case reports, letters, reviews, or articles with either too small of a sample size (less than 25) or low quality, as determined by missing data, flawed design, and an overall assessment of the journal’s impact.
2.2. Inclusion Criteria
Inclusion criteria specified that patients in the studies must have undergone aortic arch replacement surgery, encompassing both total arch replacement and hemiarch replacement, and that the surgical procedure must involve a median sternotomy. Additional data points to be recorded included the proportion of male patients, patient age and distribution, cardiopulmonary bypass (CPB) time, myocardial ischemia time, isolated cerebral perfusion (ICP) time, hypothermic circulatory arrest (HCA) temperature, and complication rate.
2.3. Exclusion Criteria
- (1)
Lack of a detailed description of the operation time, patients’ number, HCA temperature, or complication incidence
- (2)
The article presented HCA-related parameters, yet the operating procedures were not included aortic arch replacement
2.4. Data Extraction
Two independent reviewers were involved in data extraction, with a cardiac surgery specialist available for consultation on specific descriptions. Data were organized and input into a form that included the following categories: (a) author, (b) HCA classification (mild, moderate, and deep) and HCA temperature (or core temperature), (c) number of patients, mean age, age standard deviation (SD), male proportion, (d) CPB time, CPB SD, cardiac ischemia time, cardiac ischemia time SD, ICP time, ICP SD, (e) transient nerve injury (TNI) number and proportion, permanent nerve injury (PNI) number and proportion, renal failure (RF) number and proportion, mean ventilation time and SD, mean 24-hour drainage volume and SD, and mortality and proportion.
For the author’s naming convention, we adopted the format of the author’s name followed by the year of publication (e.g., He2019). If an article presented two or more temperature comparisons, the suffixes “.1”, “.2”, and “.3” were employed for distinction (e.g., Dong2020.1 and Dong2020.2). Furthermore, we divided our data into five groups (A: 30–32°C, B: 28–30°C, C: 26–28°C, D: 24–26°C, and E: <24°C) based on the core temperatures recorded during HCA. Core temperature, as indicated by rectal, bladder, and nasopharyngeal measurements, was considered. As nasopharyngeal temperature tends to be higher in the same individual, any such reading was assigned to the next higher group (e.g., a reading of 24–26 degrees would be classified under group C).
In the analyzed articles, the cross-clamp time was treated as cardiac ischemia time, and the circulatory arrest time was considered as ICP time. If both ICP time and circulatory arrest time were provided, we defaulted to using ICP time.
We included four types of complications and postoperative evaluation parameters. The complications considered were TNI, PNI, renal failure, and mortality. TNI refers to largely reversible neurological complications present before discharge, while PNI encompasses irreversible conditions such as stroke, paralysis, paraplegia, and hemiplegia. Renal failure includes indications of kidney replacement, acute kidney injury (AKI) stage 3, and hemofiltration. Mortality includes 30-day mortality, in-hospital mortality, and intraoperative mortality. Ventilation time and postoperative 24-hour drainage were extracted as evaluation variables.
2.5. Statistical Analysis
In this study, we combined data on gender, operation time, TNI, PNI, RF, and mortality to quantify the impact of cerebral protection temperature during HCA. We utilized complication and mortality rates to reflect the risk associated with the aortic arch replacement procedure. To mitigate potential biases, such as those arising from primary diseases (e.g., diabetes and hypertension) and diagnoses (e.g., acute type A dissection, Marfan syndrome, and degenerative aneurysm) that could affect certain parameters (such as complication or mortality rate), we used the general linear mixture model (GLMM) for single proportions and the inverse variance (IV) model for other variables to analyze data distribution [11, 12]. We adjusted the weights of the variables using both fixed-effects and random-effects models in the IV approach to help capture random attributes and decrease risk bias. The Knapp–Hartung adjustment was nested to lessen heterogeneity among the datasets, and maximum likelihood estimation was applied to constrain the model, deriving optimal parameters and a wider 95% confidence interval [13].
We quantified heterogeneity using the inconsistency index I2 (I2 > 25% suggests low heterogeneity; I2 > 50%, moderate; and I2 > 75%, high) along with the Q statistic and P value [14]. If P > 0.05 and I2 < 50%, we applied the fixed-effect model; if not, we used the random-effects model to prevent false positives due to high heterogeneity and low sample quality, specifically when P ≤ 0.05 and I2 > 50% [15, 16]. We used funnel plots to visually assess publication bias. For subsequent bias correction, we utilized the trim-and-fill model following the Egger test for continuous variables or the Peters test for binary proportion variables [17]. If the postcorrection P value was greater than or equal to the precorrection P value, we used the precorrection results; otherwise, we used the postcorrection results. For articles using median and quartile ranges in lieu of mean and SD values, we used transformation tools developed by Luo and Wang [18, 19].
Lastly, we conducted a subgroup analysis of all combined effect sizes. Additionally, through a metaregression, we sought to identify potential relationships between age, gender, and CPB time with the outcomes. All processes were executed using R Studio software (version 1.4.1717) with the “meta”, “metafor”, “dmetar”, and “ggplot2′ packages [20–23].
3. Result
3.1. Literature Search
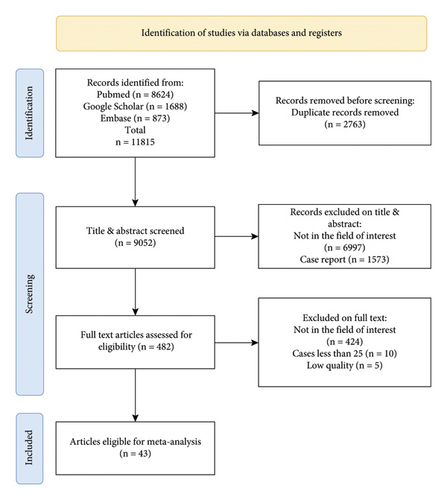
The main search process is shown in Figure 1. We searched 11815 papers, of which 43 papers and 34797 cases were selected [5–7, 24–63]. The rest of them include duplicated (2763), not in the field of interest (7412), case report (1573), case is less than 25 (10), and paper has low quality (5). All articles, Newcastle–Ottawa Scale assessments, and data availability are presented in the statement part.
3.2. Age and Sex Distribution
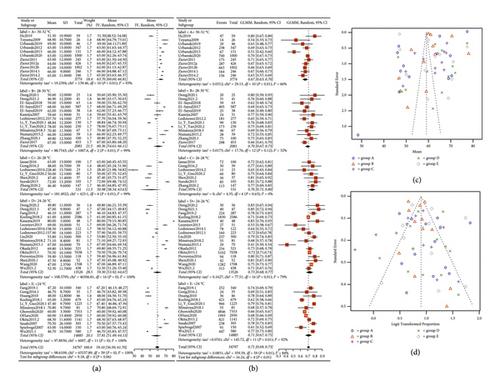
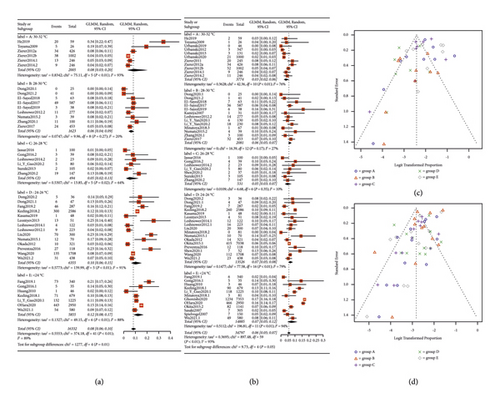
The statistical analysis results for age and male distribution (Figure 2) indicate that the pooled age is 59.1 (95% confidence interval (CI): 56.5; 61.7), exhibiting no statistically significant variation between groups (P = 0.06). However, the proportion of males is statistically significant (pooled proportion: 0.71, 95% CI: 0.69; 0.73, P < 0.01). The Egger test and Peters test for the funnel plot revealed that the P value for age is 0.4423 and for sex is 0.2243, indicating no publication bias.
3.3. Main Operation Time Presentation
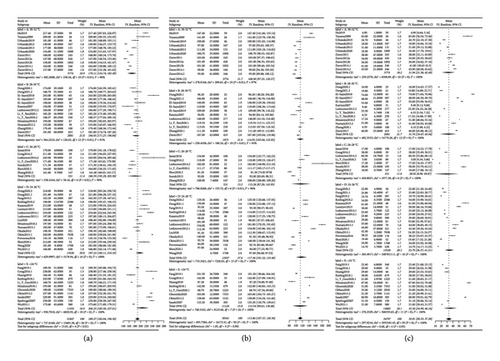
We also performed the same pooled statistical analysis on CPB time, myocardial ischemia time, and ICP time. The results (Figure 3) showed that CPB has intergroup differences (P < 0.01, A < C < B < D < E), while the others do not (P = 0.90 and P = 0.95). The pooled results showed that the mean value of CPB is 189.27 (95% CI: 182.04; 196.5), myocardial ischemia time is 113.89 (95% CI: 107.37; 120.36), and ICP time is 32.81 (95% CI: 28.33; 37.28). The Egger test for the funnel plot revealed that the P value for CPB is 0.8945, and no publication bias was detected.
3.4. Complications and Mortality
We used the random-effect model to summarize the TNI, PNI, RF, and mortality, respectively. A pooled forest plot showed the main results of TNI and PNI proportion (Figure 4).
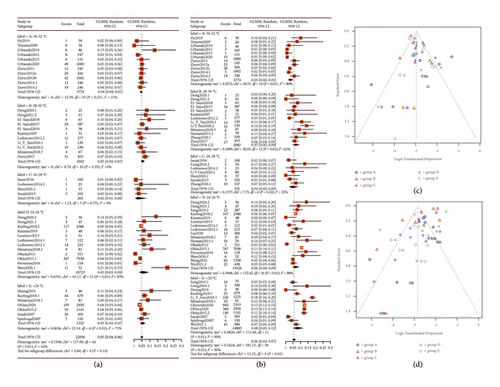
The subgroup analysis indicated that the P values for statistical differences between the TNI and PNI groups were 0.14 and 0.02, respectively. The incidences of TNI and PNI were significantly lower in groups A (4% and 3%) and C (2% and 4%) compared to the other groups. Furthermore, RF and in-hospital mortality rates were also compiled into forest plots, as depicted in Figure 5. The pooled results showed an 8% incidence of RF (P = 0.01, 95% CI: 0.06; 0.10) and a 6% in-hospital mortality rate (P = 0.05, 95% CI: 0.05; 0.07). The best subgroup analysis outcomes were observed in group C for RF (5%) and in group A for in-hospital mortality (3%). We conducted the Peters test for the funnel plot which revealed a P value for PNI of 0.2434, for RF of 0.5059, and for mortality of 0.1175 indicating no publication bias. However, the P value for TNI was <0.0001, prompting us to use the trim-and-fill model for correction. Nevertheless, the significance after correction was unchanged from the pre-trim-and-fill model analysis. Consequently, we believe that our study is not affected by publication bias, and all the pooled results are shown in Table 1.
| Variables | Group | Temperature (degrees Celsius) | Patients’ numbers | Events | Estimate | Heterogeneity (I square) (%) | P value | Interaction-p (subgroup-P value) |
|---|---|---|---|---|---|---|---|---|
| Age | A | 30–32 | 3774 | NA | 63.70 [60.60; 66.81] | 93 | <0.01 | 0.06 |
| B | 28–30 | 2081 | NA | 60.36 [54.61; 66.11] | 99 | <0.01 | ||
| C | 26–28 | 531 | NA | 50.98 [38.34; 63.63] | 99 | <0.01 | ||
| D | 24–26 | 13526 | NA | 59.30 [53.92; 64.67] | 100 | <0.001 | ||
| E | <24 | 14885 | NA | 57.81 [51.49; 64.13] | 100 | <0.001 | ||
| Pooled outcome | 34797 | NA | 59.10 [56.50; 61.70] | 100 | <0.001 | |||
| Sex (male) | A | 30–32 | 3774 | 2540 | 0.67 [0.63; 0.70] | 66 | <0.01 | <0.01 |
| B | 28–30 | 2081 | 1444 | 0.70 [0.67; 0.73] | 32 | 0.12 | ||
| C | 26–28 | 531 | 405 | 0.76 [0.71; 0.80] | 0 | 0.63 | ||
| D | 24–26 | 13526 | 9817 | 0.73 [0.68; 0.77] | 79 | <0.01 | ||
| E | <24 | 14485 | 10190 | 0.71 [0.67; 0.73] | 92 | <0.01 | ||
| Pooled outcome | 34797 | 24386 | 0.71 [0.69; 0.73] | 84 | <0.01 | |||
| CPB time (minutes) | A | 30–32 | 3774 | NA | 170.11 [154.74; 185.49] | 96 | <0.01 | <0.01 |
| B | 28–30 | 2081 | NA | 184.05 [171.27; 196.84] | 91 | <0.01 | ||
| C | 26–28 | 531 | NA | 180.59 [155.29; 205.90] | 90 | <0.01 | ||
| D | 24–26 | 13526 | NA | 197.22 [184.11; 210.33] | 100 | <0.001 | ||
| E | <24 | 11935 | NA | 206.25 [185.50; 227.01] | 100 | <0.001 | ||
| Pooled outcome | 31847 | NA | 189.27 [182.04; 196.50] | 100 | <0.001 | |||
| TNI | A | 30–32 | 3774 | 166 | 0.04 [0.04; 0.05] | 21 | 0.25 | 0.14 |
| B | 28–30 | 1942 | 104 | 0.05 [0.04; 0.07] | 0 | 0.55 | ||
| C | 26–28 | 265 | 6 | 0.02 [0.01; 0.08] | 0 | 0.75 | ||
| D | 24–26 | 10723 | 444 | 0.05 [0.03; 0.09] | 83 | <0.01 | ||
| E | <24 | 5352 | 238 | 0.05 [0.04; 0.07] | 73 | <0.01 | ||
| Pooled outcome | 22056 | 958 | 0.05 [0.04; 0.06] | 62 | <0.01 | |||
| PNI | A | 30–32 | 3774 | 109 | 0.03 [0.02; 0.05] | 80 | <0.01 | 0.02 |
| B | 28–30 | 2081 | 142 | 0.07 [0.05; 0.09] | 61 | <0.01 | ||
| C | 26–28 | 531 | 25 | 0.04 [0.02; 0.09] | 22 | 0.26 | ||
| D | 24–26 | 13526 | 1147 | 0.06 [0.04; 0.09] | 88 | <0.01 | ||
| E | <24 | 14885 | 1809 | 0.08 [0.05; 0.12] | 90 | <0.01 | ||
| Pooled outcome | 34797 | 3232 | 0.06 [0.04; 0.07] | 90 | <0.01 | |||
| RF | A | 30–32 | 2005 | 119 | 0.08 [0.03; 0.20] | 93 | <0.01 | 0.01 |
| B | 28–30 | 1623 | 106 | 0.06 [0.04; 0.09] | 20 | 0.27 | ||
| C | 26–28 | 494 | 32 | 0.05 [0.02; 0.13] | 64 | 0.02 | ||
| D | 24–26 | 6355 | 669 | 0.10 [0.06; 0.15] | 91 | <0.01 | ||
| E | <24 | 5855 | 779 | 0.12 [0.08; 0.17] | 88 | <0.01 | ||
| Pooled outcome | 16332 | 1705 | 0.08 [0.06; 0.10] | 89 | <0.01 | |||
| Mortality | A | 30–32 | 3774 | 156 | 0.03 [0.02; 0.06] | 76 | <0.01 | 0.05 |
| B | 28–30 | 2081 | 129 | 0.06 [0.05; 0.07] | 27 | 0.17 | ||
| C | 26–28 | 531 | 24 | 0.05 [0.03; 0.07] | 10 | 0.35 | ||
| D | 24–26 | 13526 | 920 | 0.07 [0.05; 0.08] | 79 | <0.01 | ||
| E | <24 | 14885 | 2070 | 0.07 [0.05; 0.12] | 94 | <0.01 | ||
| Pooled outcome | 34797 | 3302 | 0.06 [0.05; 0.07] | 93 | <0.01 | |||
- For the age variable, the pooled outcome is statistically significant with a P value <0.001. However, it is also worth noting the high heterogeneity (I2 = 100%), which suggests that there is a lot of variability in the results across the different age groups. And for the sex variable, the pooled proportion of males across all groups is 0.71, and this result is statistically significant with a P value <0.01. However, there is significant heterogeneity in the results across the groups (I2 = 84%). Besides, for CPB time, the pooled outcome is 189.27 minutes with a 95% confidence interval of (182.04 and 196.50), and the P value for the pooled outcome’s heterogeneity is <0.001, indicating that the heterogeneity is statistically significant. Finally, in all complication variables, including PNI, TNI, RF, and mortality, all suggest that there is a lot of variability in the results across the different groups with a P value <0.01.
3.5. Metaregression Analysis
We conducted a metaregression analysis with age, sex, and cardiopulmonary bypass (CPB) time as independent variables and TNI, PNI, RF, and mortality as dependent variables. The primary outcomes include age, which was not statistically significant with any of the results. Statistically significant findings include that sex was significantly associated with TNI (P = 0.0456, estimate value = −0.0001) and mortality (P = 0.0398, estimate value = 0.0002); CPB time was significantly associated with mortality (P = 0.0232, estimate value = 0.0067). A Q statistic (QE) test showed significant heterogeneity for all results (P < 0.0001).
4. Discussion
DHCA has long been the gold standard for aortic arch surgeries. Despite DHCA’s recognized ability to lower cellular metabolism rates and safeguard organs in a hypothermic environment, it also can induce neural system damage and coagulation anomalies, among other detriments [64, 65]. Prior research suggests that optimal brain protection temperatures range from 32 to 34 degrees Celsius, while kidney protection is best achieved between 28 and 32 degrees Celsius [66–69]. In this study, we have grouped temperatures in two-degree intervals to illustrate the relationship between decreased temperature and increased tissue damage, mindful of the 32-degree boundary. This methodology elucidates why Group A manifests the least neural complications, and Group C exhibits diminished renal complications. However, given that clinical treatments often encompass multiple primary diseases, our systemic review amalgamates data from various centers to provide more robust evidence for clinical decisions.
Our meta-analysis and systematic review encompassed 43 articles, 60 groups, and 34,797 cases. Statistically, Groups A and C showcased the best results through subgroup comparison. Group A, which maintains temperatures between 30 and 32 degrees Celsius, had the lowest rates of peripheral neuropathy injury (PNI) (3%) and mortality (3%), illustrating a significant statistical difference. Conversely, Group C, where temperatures were kept within the 26–28 degrees Celsius range, had the lowest incidence of renal failure (RF) (5%). For other parameters, such as age (P = 0.06), myocardial ischemia time (P = 0.90), ICP time (P = 0.95), and traumatic neural injury (TNI) occurrence rate (P = 0.06), no significant statistical difference was observed. Similarly, the male proportion (P < 0.01) and CPB time (P = 0.01) showed no statistical difference. Accordingly, we suggest that maintaining the temperature at 30–32 degrees Celsius or 26–28 degrees Celsius during HCA is safe and effectively decreases the incidence rate of each type of complication. Furthermore, our funnel plots reveal no significant publication bias, and this conclusion is supported by our center’s experience [70].
Due to current state-of-the-art techniques in cardiac surgery, such as advancements in suture devices and anastomosis methods, the time and bleeding involved in arch replacement procedures have significantly reduced. As a result, the need for low-temperature protection has also decreased. In our research, we found that some articles had ICP times of just a few minutes, which was achieved using a debranch hybrid aortic replacement surgery method that reduces the operation time and simplifies the surgery. Most of our sample population had type A aortic dissection, but surgical techniques varied among medical centers. Nevertheless, en bloc anastomosis and HCA techniques remained commonly used in these procedures. The findings of this research may aid in decision-making when clinicians need to induce CA in dissection patients.
From our perspective, the perfusion strategy is a crucial factor during ICP. By monitoring the organs’ function, guided perfusion strategies can make organs tolerant of transient hypoxia during HCA [71]. During HCA, maintaining balanced cardiac and cerebral perfusion pressure is essential. Though there have been controversial discussions on antegrade, retrograde, and bilateral cerebral perfusion strategies, single-center studies or meta-analyses showed no significant differences [8–10]. We believe that this may be related to the routine use of near-infrared spectroscopy (NIRS) monitoring. In cases where there is abnormal cerebral oxygen saturation monitoring, changing the perfusion strategy and implementing local cooling methods can predict and help to avoid peripheral neuropathy injury (PNI). Improvements in CPB, such as acid-base management (alpha-stat and PH-stat management), can retain homeostasis and the goal-guided perfusion strategies, resulting in better performance in maintaining DO2/VO2 balance during CPB and reducing damage to critical organs [72–74].
Aortic arch replacement is a complex procedure, and various surgical techniques are currently in use. Some of the research analyzed in this study was performed by the same operators, which might result in potential bias. Additionally, imbalanced distributions of valve diseases, cerebral infractions, and other diseases that could influence the results were observed in some of the samples, potentially resulting in heterogeneity in all analyses. We understand that factors such as operator experience and sample differences can be responsible for this heterogeneity, making it impossible for our models to address all related problems. Consequently, this is the main limitation of our study.
However, based on our study, maintaining a temperature of 30–32°C during en bloc anastomosis or 26–28°C during longer HCA time operation, such as in total arch replacement, is safe and significantly reduces the incidence rate of complications such as stroke, hemiplegia, or neural system complications, RF, and in-hospital mortality.
Conflicts of Interest
The authors declare that there are no conflicts of interest.
Authors’ Contributions
GTX, YY, and DZ designed the study; SEY and YY calibrated the datasheet and design parameters; DZ collected the data and carried out the computation and generated figures; YY and DZ analyzed the data and wrote the manuscript. Yang Yu and Zheng Ding contributed equally to this work.
Acknowledgments
We appreciate all faculties in our department for their active work, support, and help.
Open Research
Data Availability
The data supporting this meta-analysis are from previously reported studies and datasets, which have been cited. The processed data are available from the corresponding author upon request.


