Modeling and Performance Analysis of Flying Mesh Network
Abstract
Maintaining good connectivity is a major concern when constructing a robust flying mesh network, known as FlyMesh. In a FlyMesh, multiple unmanned aerial vehicles (UAVs) collaborate to provide continuous network service for mobile devices on the ground. To determine the connectivity probability of the aerial link between two UAVs, the Poisson point process (PPP) is used to describe the spatial distribution of UAVs equipped with omnidirectional antennas. However, the PPP fails to reflect the fact that there is a minimum distance restriction between two neighboring UAVs. In this paper, the β-Ginibre point process (β-GPP) is adopted to model the spatial distribution of UAVs, with β representing the repulsion between nearby UAVs. Additionally, a large-scale fading method is used to model the route channel between UAVs equipped with directional antennas, allowing the monitoring of the impact of signal interference on network connectivity. Based on the β-GPP model, an analytical expression for the connectivity probability is derived. Numerical tests are conducted to demonstrate the effects of repulsion factor β, UAV intensity ρ, and beamwidth θ on network connectivity. The results indicate that an increase in UAV intensity decreases network connectivity when the repulsion factor β remains constant. These findings provide valuable insights for enhancing the service quality of the FlyMesh.
1. Introduction
Unmanned aerial vehicles (UAVs) offer numerous unique advantages for providing communication coverage to mobile devices on the ground, including a high probability of establishing line-of-sight (LoS) links and flexible deployment capabilities. UAVs act as flying base stations (FBS) and provide services to terminal equipment on the ground [1]. To enhance the coverage area, multiple UAVs can collaborate by building an aerial network called the flying mesh network, or FlyMesh for short, through aerial links between them. FlyMesh provides several benefits, including rapid deployment of networks in disaster situations, extending wireless network connectivity to sparsely populated areas, collecting and processing data from large mobile IoT devices, and improving overall network resilience [2]. FBS technology enhances wireless communication performance and offers a flexible network architecture that can adapt to real-time traffic changes to provide optimal services. It has been widely used and extensively studied in mobile edge computing [3, 4]. Due to the mobility and flexibility of UAVs [5], the topology of FlyMesh often changes [6]. To ensure a continuous service for mobile devices, maintaining a good connectivity among UAVs is critical for the FlyMesh maintainer. Therefore, it is important to build an analysis model to profile the connectivity probability among UAVs.
The essential part of building an analysis model is sculpting the spatial distribution of the UAVs, which can move at high speeds. Existing efforts typically adopt the Poisson point process (PPP) to achieve this goal [7]. In the PPP-based model, each UAV is treated as an independent point in space, and there is no connection among the positions of UAVs. However, the absence of distance restrictions in PPP model makes it challenging for existing models to account for the fact that UAVs usually maintain a distance from each other to enhance coverage and prevent collisions. Existing work often neglects the directional antennas commonly adopted by UAVs. For example, there is an exclusion (or attraction) between UAVs, which means that the actual deployed UAV location typically exhibits a more regular (or clustered) point pattern than PPP.
In this context, this paper adopts the β-Ginibre point process (β-GPP) to describe the spatial distribution of the UAVs. Compared with PPP, β-GPP restricts the minimum distance between two UAVs using parameter β. When β⟶1, UAVs are uniformly distributed in the GPP model. Thus, by adjusting β in a given environment, the distribution of UAVs can be analyzed more accurately. In other words, we can change the distance restriction in a flexible way by adjusting the value of β without modifying the analysis model. In addition, we assume that each UAV is equipped with a directional antenna to improve its connectivity. Specifically, the positions of UAVs are first modeled using β-GPP. Then, the signal-to-noise ratio (SINR) at the receiver is calculated based on the directional antenna assumption. Subsequently, the analytical expression of the connectivity probability of the wireless link between two UAVs is derived. In comparison with existing efforts, our contributions in this paper are twofold. On one hand, we use β-GPP to model the spatial distribution of UAVs and derive an analytical expression for the connectivity probability. On the other hand, we conduct a series of numerical tests based on the analytical expression to analyze the impacts of the repulsion parameter β, beamwidth θ, and UAV intensity ρ on network connectivity performance.
The rest of this paper is organized as follows: Related Work briefly introduces existing efforts. Mathematical Preliminaries provides the basic characteristics of β-GPP. System Model and Assumptions and Performance Analysis introduce the system model and analyze the network connectivity and network coverage, while Simulation and Result Analysis examines the advantages of the adopted model through experiments and data comparisons. Finally, Conclusion briefly summarizes our work.
2. Related Work
UAVs are one of the most common low-altitude platforms, considered agile, low cost, and easy to deploy [8]. These foreseeable benefits prompt academic and industry associations to recommend the use of drone base stations and evaluate their performance in various applications. For example, Arshad et al. [9] optimized the position of UAVs by utilizing their flexibility in responding to real-time device activity to minimize uplink transmission power. Mozaffari et al. [10] provided downlink services to rural areas without surface base station coverage using UAVs. Bushnaq et al. [11] considered the upstream data aggregation scenario of IoT devices from rural areas. Choi et al. [12] proposed not using a single UAV but letting the UAV collect data from the Internet of Things devices, which transmitted data as long as they were within the coverage area. Research on mobile self-organizing networks has also provided assistance. Cui et al. studied a quantum genetic-based OLSR protocol for mobile self-organizing networks, while Wei et al. analyzed the joint deployment of drones in DRL-based edge computing [13].
Stochastic geometric modeling helped to analyze the topological randomness of network geometry. PPP had been widely utilized in UAV network modeling and analysis due of its ease of handling [13–15]. Numerous theoretical results had been obtained based on the PPP model; however, PPP has certain limitations and cannot adequately describe the independence of node positions in real network deployments. Therefore, the spatial distribution of UAVs in real deployment can be better captured by considering the point process of the spatial correlation. Fang et al. [16] proposed an adaptive deployment-based solution that could effectively mitigate the excessive clustering of UAVs with negligible dispersion. Nakata and Miyoshi [17], Deng et al. [18], and Gomez et al. [19] studied and discussed the cellular network of base station deployment based on the β-GPP model. They further derived a computable integral representation of the coverage probability of typical mobile subscribers. The deterministic point process (DPP) provided a valuable model for describing spatial point pattern datasets in which nearby points repel each other [20]. In addition, they demonstrated an exclusive relationship between the location distribution and corresponding UAVs. The expressions for the DPP concerning LF and PGFL were identified. Therefore, DPP was a preferred performance analysis tool [21]. GPP is a soft-core model, which belongs to a class of DPPs. Each DPP was defined using a core matrix GPP, suitable for simulation between the communication node positions [22, 23]. GPP is more irregular than the lattice but more regular than the PPP. Herein, a more general point process called β-GPP, 0 < β ≤ 1, is introduced. The variation of the repulsion factor β reflects the interrelationship between the nodes. Notably, 1-GPP is GPP, and β-GPP weakly converges to PPP of the same strength as β⟶0. In other words, the β-GPP family generalizes GPP whereas PPP limits FlyMesh network performance. This study found that β⊆(0.2,0.4) is a good fit for rural areas, whereas β⊆(0.6,1) is a good fit for urban areas [24].
The UAVs were equipped with a directional antenna to reduce signal interference. Anisotropic radiation (directional antenna) can better connect UAVs than isotropic radiation (omnidirectional antenna), which is related to the array and design of the directional antenna. Shakhatreh et al. maximized indoor wireless coverage used using drones equipped with directional antennas [25]. Guo et al. effectively covered arbitrary two-dimensional ground areas using directional antennas to achieve efficient and scalable deployment of such flying base stations [26]. Peng et al. and Qin et al. analyzed the modeling and coverage performance of the UAVs under the directional antenna [27, 28]. Beam multiplexing techniques for directional antenna had also been widely used and intensively studied in 4G, 5G, and 6G [29].
UAVs are distributed according to β-GPP. Our study focussed on the network connectivity and coverage of interference in the β-Ginibre wireless network and the fitting of real data. Since the β-GPP family forms an intermediate class between PPP (completely random) and GPP (relatively regular), we can intuitively use β-GPP to simulate a large number of actual UAV networks by modulating the value of β.
3. Mathematical Preliminaries
4. System Model and Assumptions
4.1. Network Model
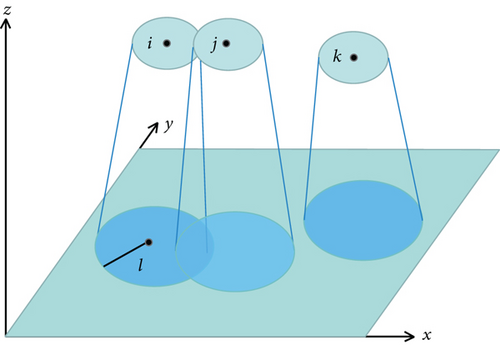
This paper considers the FlyMesh consisting of three types: flying base station (ABS), aerial mobile terminal (AMT), and ground mobile terminal (GMT), as shown in Figure 1.
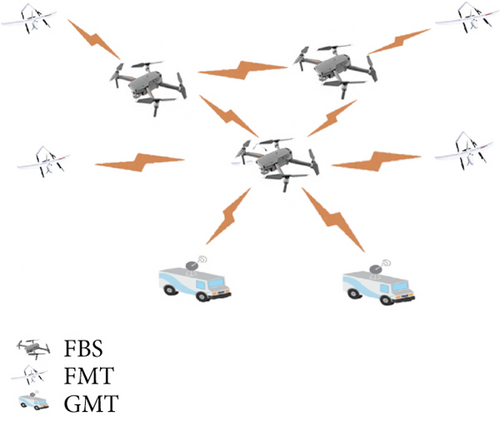
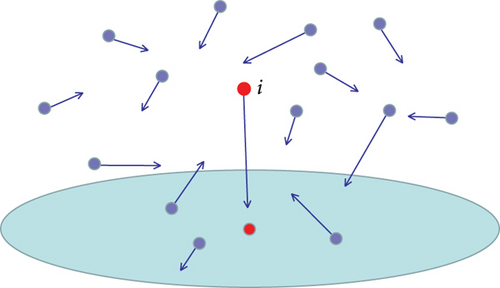
The UAV network is regarded as a FlyMesh, where the flying base stations (FBS) provide information storage and forwarding functions for mobile terminals. In complex electromagnetic environments, UAVs are equipped with directional antennas to reduce interference. The location distribution of drones in space is modeled as β-GPP model. Only the transmission between the transmitter and receiver was considered, and all other signals are considered to have interference, as shown in Figure 2. We also assumed that the receiver was deployed at the origin position of t0(0, 0, 0). The transmitter ti(xi, yi, zi) is away from t0.
4.2. Antenna Gain
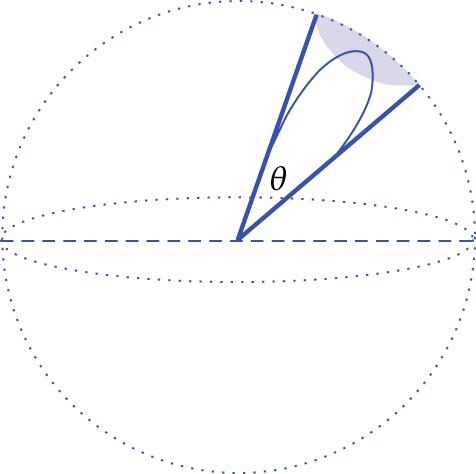
A directional antenna is a phased array antenna. By varying the feed phase of the radiation unit in the array antenna, the direction of the antenna’s maximum range in the antenna map can be changed, thereby altering the direction and range of antenna radiation. The directional antenna is more focused in a specific direction compared to the omnidirectional antenna. It reduces interference between UAVs, improves the transmission distance, and enhances the spatial multiplexing of the channel. The schematic diagram of antenna beamforming is shown in Figure 3.
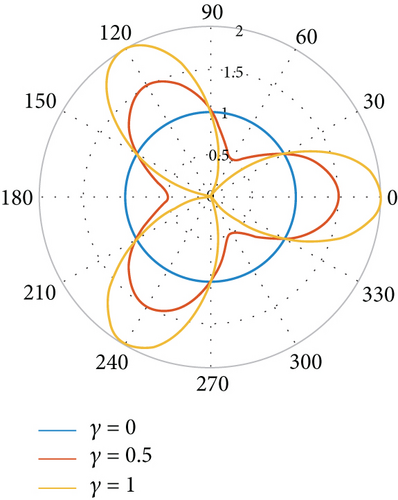
As shown in Figure 4, γ regulates the influence of the main lobe beamwidth on gain, when n represents the number of main lobes of the nodal antenna. Notably, the receive antenna gain Gr of the antenna depends only on the receiver antenna beam angle θ ∈ (0, 2π), while the transmitter gain Gt depends on its transmission antenna angle φ ∈ (0, 2π).
4.3. Path Loss and Fading
5. Performance Analysis
5.1. Network Connectivity
Here, we obtain the approximate expression of the connection probability under the β-GPP model, which can quantitatively analyze the influence of various indicators on the connection probability.
5.2. Upper and Lower Limits of UAV Intensity
In general, FlyMesh provides network services in areas where network coverage is needed. The primary requirement is to ensure continuous and uninterrupted network coverage in the desired area. Therefore, it is crucial to design the strength of key nodes to ensure network coverage. In UAV network engineering, it is a common practice to consider a regular hexagon of circular cells.
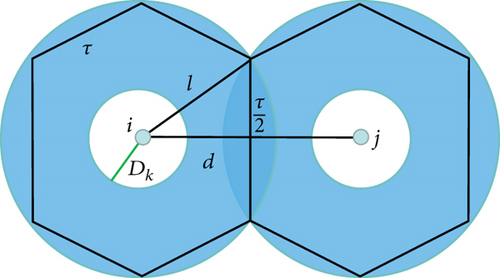
In a limited area, the size of the network coverage area determines the network connectivity. In order to determine the maximum distance between two overlapping UAVs, we must find an approximate overlapping area. A common practice for this in cellular networks is to consider a regular hexagon. In Figure 6, we consider the UAVs to be connected in this region.
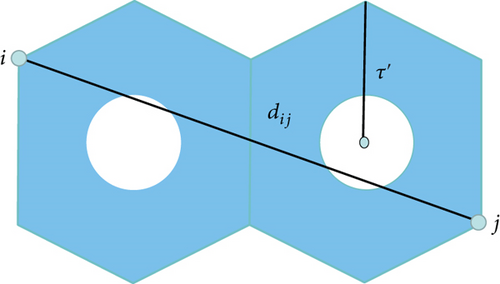
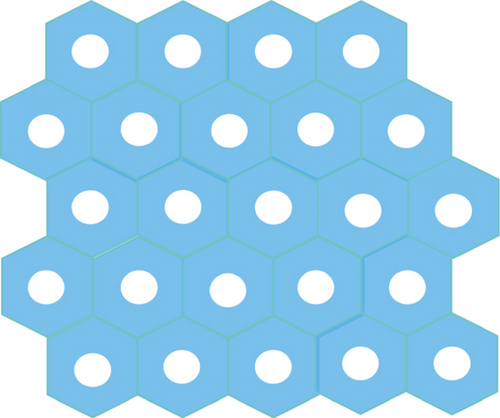
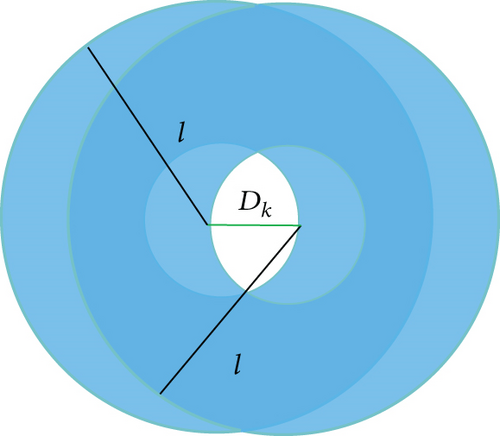
Here, we get the upper and lower limits of the UAV intensity. Within this range, the connectivity of the network coverage is guaranteed.
6. Simulation and Result Analysis
This section and numerical simulations have verified the derived theoretical results. The simulation parameters are shown in Table 1. This section is divided into three parts for simulation. To simulate an infinite domain, we used a three-dimensional hemisphere with a radius of R = 50 km and the receiving UAV was located at the center of the disk. In the simulation, the jamming transmitter was assigned a random orientation angle φk in [0, 2π]. Another transmitter was then placed at ti with the orientation φi in [0, 2π]. The receiver orientation was θ. Channel gain was generated according to a distribution with a mean exponential distribution. The simulation was repeated 3 × 10⁴ times for different UAV positions, beamwidths, beam directions, and channel gains in Monte Carlo simulation.
| Definition | Parameters | Values |
|---|---|---|
| Beamwidth of antenna | θ | Variables |
| Repulsion factor | β | Variables |
| Point intensity | β | Variables |
| Transmitting power | Pt | 1 |
| Beamwidth factor | γ | 0.3 |
| Noise | N0 | 1 |
| Connectivity threshold | Q | 1 |
| Power threshold | λ | 1 |
| Constant | c | 1 |
| Path attenuation factor | α | 4 |
6.1. Antenna Gain Verification
Figure 10 depicts the simulation results of the antenna gain effect under a single beam. The results demonstrate that the directionality of the antenna concentrates the radiation energy, resulting in improved gain. Additionally, the beamwidth factor determines the extent to which changes in angle affect the gain.
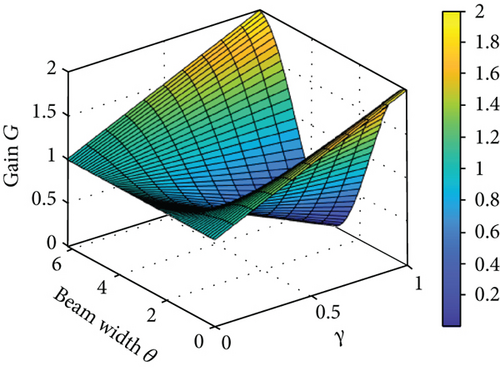
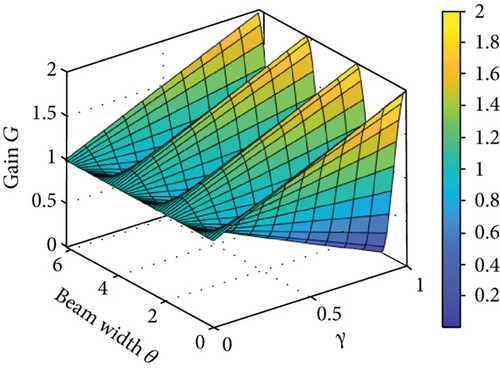
Figure 11 illustrates the simulation results of the antenna diagram with three main lobes. In this configuration, the gain reaches its maximum value in all three directions. The gain varies more rapidly with the beamwidth, while the influence of the side lobes is significantly diminished.
6.2. Verification of Approximate Pcon
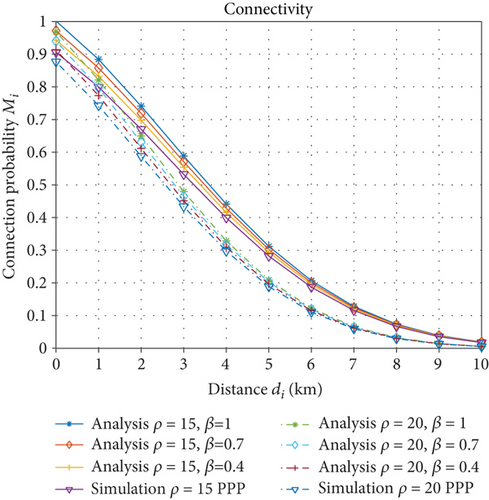
Figure 12 shows the relationship between connection probability and distance. As the distance increases, the connection probability decreases. Meanwhile, the rejection factor β has an impact on the connectivity probability. The magnitude of β represents the relationship between the location distribution of the drones. The connectivity probability is higher when the UAVs are deployed uniformly compared to random deployment. This is attributed to the reduced electromagnetic interference resulting from uniform deployment.
Under the same conditions as described above, Figure 13 shows the effect of different spatial intensities on the connectivity probability. In the PPP model, an increase in UAV intensity enhances the network connectivity probability. However, in the β-GPP model, the opposite effect is observed. The increase in intensity leads to a simultaneous rise in electromagnetic interference, resulting in a decrease in the connectivity probability.
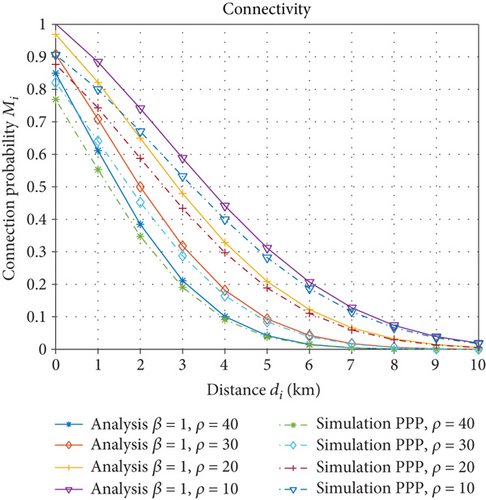
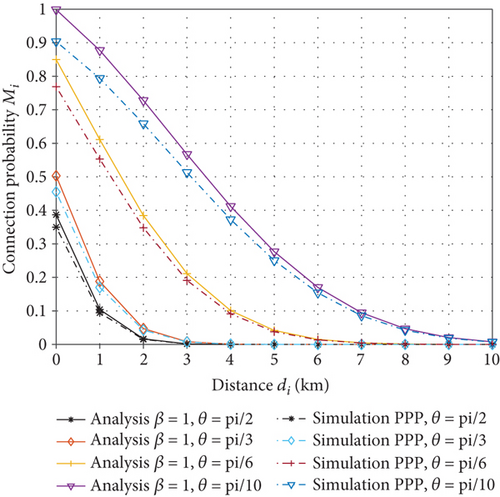
Figure 14 shows the effect of different beamwidths θ on the connectivity probability. The directionality of the antenna aids in concentrating the signal energy and minimizing energy loss during propagation. Furthermore, the narrow beam reduces electromagnetic interference in unmanned networks. Therefore, the utilization of directional antennas enhances the connectivity probability.
6.3. UAV Intensity Verification
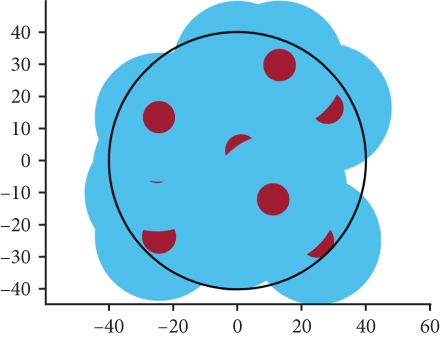
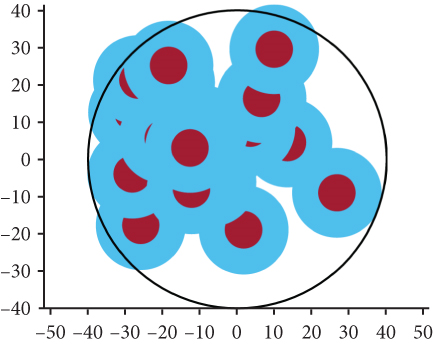
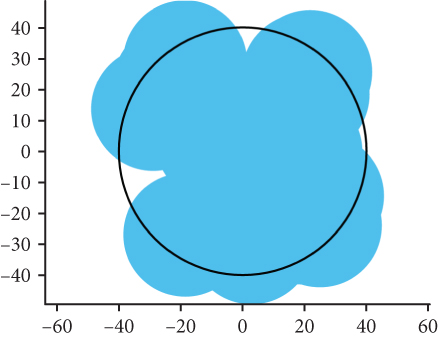
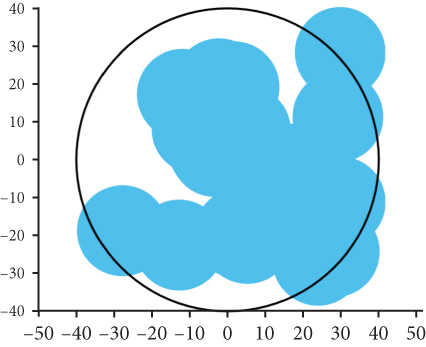
We utilized the network scenario illustrated in Figure 1 to validate our findings regarding network coverage. To simulate the network coverage scenario, we assumed that the directional antenna implemented omnidirectional scanning of 360°, and the UAVs were assumed to follow the β-GPP model. The simulation area was performed using an R = 40 km2 black circle. The covered area was depicted in blue, while the uncovered area remained white. The red portion indicated an exclusion zone where UAV deployment was restricted. All UAVs in the network were initialized with the parameter values specified in Table 1.
Figure 15 shows the simulation results for the coverage effect of UAVs to 40 and comparing the network coverage of UAVs under model β-GPP and model PPP. It is evident that the network coverage effect is generally similar in both models. However, in the β-GPP model, the UAVs exhibit a certain distribution pattern with a repulsive area, effectively reducing signal interference between UAVs. At the same time, decreasing the beamwidth noticeably reduces signal interference and leads to a more regular spatial distribution of the network.
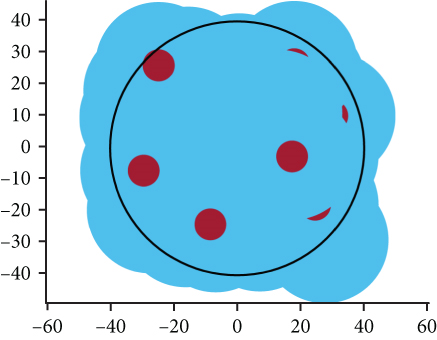
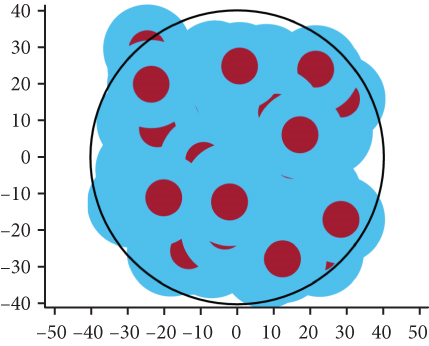
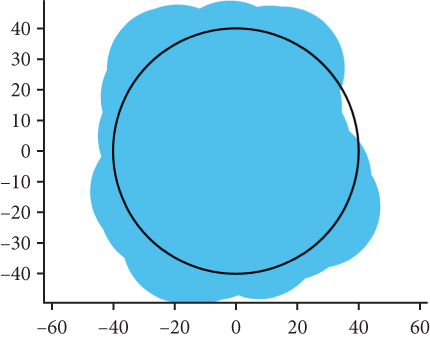
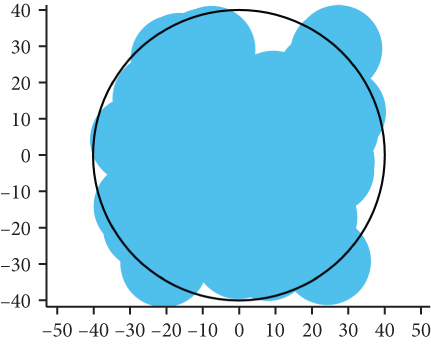
Figure 16 reduces the number of simulated UAVs to 20. As the number of UAVs decreases, the network coverage deteriorates, resulting in the network coverage deteriorates, resulting in the emergence of numerous blank areas. Notably, the network coverage of the β-GPP model exhibits a notably uniform pattern, whereas the coverage in the PPP model is more concentrated. Consequently, the distribution of UAVs in the β-GPP model is more regular compared to that in the PPP model. In this scenario, the analysis demonstrates that the β-GPP model outperforms the PPP model in terms of network coverage performance.
6.4. Discussion
This section is aimed at simulating the impact of the environmental repulsion factor β, node intensity ρ, and beamwidth θ on network connectivity. Based on the simulation results, it can be seen that regular deployment of network nodes can improve the network performance. The intensity of nodes should be within certain upper and lower limits within a finite area. The lower limit ensures network connectivity, while the upper limit helps minimize interference. Additionally, the beamwidth of the directional antenna plays a crucial role in enhancing antenna gain and maintaining stable connections between nodes. In practical applications, the environmental factor β reflects different application environments, enabling engineers to configure network node strength and antenna beamwidth accordingly to optimize network performance.
7. Conclusion
In this paper, we analyze the network performance of FlyMesh. The location distribution of FlyMesh is modeled as β-GPP to represent the spatial exclusion and correlation between these UAVs. The flexibility of the repulsion factor β enables us to adapt the FlyMesh to various engineering environments. We approximate the network model as an inhomogeneous PPP, ignoring the small fading of the wireless links, and employ stochastic geometry tools to derive approximate expressions for connectivity. By applying percolation theory, we determine the lower and upper limits of the critical node density that ensures basic network connectivity and effectively mitigates interference between nodes. Finally, the simulation results verified the correctness of the theoretical derivation and accurately described the performance of the FlyMesh. In practical deployments of FlyMesh in different environments, we optimize the system parameters based on the obtained performance metrics, which helps to improve the network performance and ensure its stability.
Conflicts of Interest
The authors declared no potential conflicts of interest concerning the research, authorship, and/or publication of this article.
Acknowledgments
The authors disclosed receipt of the following financial support for the research, authorship, and/or publication of this article: this work was supported by the National Natural Science Foundation of China (no. 61671471).
Open Research
Data Availability
No underlying data was collected or produced in this study.


