Mid-infrared Spectrally Pure Single-Photon States Generation from 22 Nonlinear Optical Crystals
Abstract
We theoretically investigate the preparation of pure-state single-photon source from 14 birefringent crystals (CMTC, THI, LiIO3, AAS, HGS, CGA, TAS, AGS, AGSe, GaSe, LIS, LISe, LGS, and LGSe) and 8 periodic poling crystals (LT, LN, KTP, KN, BaTiO3, MgBaF4, PMN-0.38PT, and OP-ZnSe) in a wavelength range from 1224 nm to 11650 nm. The three kinds of group-velocity-matching (GVM) conditions, the phase-matching conditions, the spectral purity, and the Hong-Ou-Mandel interference are calculated for each crystal. This study may provide high-quality single-photon sources for quantum sensing, quantum imaging, and quantum communication applications at the mid-infrared wavelength range.
1. Introduction
Single-photon source at the mid-infrared (MIR) wavelength range (approximately 2–20 μm) has important potential applications in quantum sensing, quantum imaging, and quantum communication [1–4]. Firstly, the 3–5 μm band contains absorption peaks of many gases, such as H2O, CO, CO2, SO2, and SO3 [5], so this band is important for sensing of these gases in environmental monitoring [6, 7]; the 7–10 μm band contains absorption peaks of H2, O2, CH4, O3, trinitrotoluene (TNT), acetone, and sarin [5]. Therefore, this band is important for sensing chemical or explosive materials in the applications of industrial production or defense security. The single-photon source in these gas sensing applications may provide ultrahigh sensitivity [8]. Secondly, 3–5 μm and 8–14 μm are two widely used ranges for MIR thermal infrared imaging cameras for medical and forensic usage [9] since the room temperature objects emit light at these wavelength ranges. Also, MIR single-photon sources can provide a diagnosis in a noninvasive manner, which is important for medical or biological samples [10]. Thirdly, 3–5 μm is also an atmospheric transmission window with relatively high transparency, which is useful for large-scale free-space quantum communications, such as entanglement distribution [11], quantum key distribution [12], or quantum direct communication [13].
Spontaneous parametric down-conversion (SPDC) and four-wave mixing (FWM) are two widely used methods to prepare single photons. Many previous works have been dedicated to the development of high-quality single-photon sources or entangled photon sources in the MIR range from an SPDC or FWM process. On the experimental side, periodically poled lithium niobate (PPLN) [14–16], GaP [17], and silicon waveguide [18] have been investigated to prepare a single-photon source; PPLN [19] has been studied for entangled photon source generation. On the theory side, PPLN [20], periodically poled potassium niobate (PPKN) [21], 0.62Pb(Mg1/3Nb2/3)O3 − 0.38PbTiO3 (PMN-0.38PT) [22], etc. have been investigated for single-photon source [23–27]; p-doped semiconductor [28] has been studied for entangled photon source. In addition, some studies explored single-photon detection by superconducting nanowire single-photon detector (SNSPD) [29–31] or by silicon avalanche photodiode (SAPD) in an upconversion configuration [14, 32].
However, the previous studies are still insufficient for the need of MIR applications. On the one hand, the previous experimental work is mainly focused on PPLN crystal, and the wavelength range is below 5 μm. So, the range from 5 to 20 μm still needs further exploration. On the other hand, the spectrally pure single-photon source is proved to be a good resource [33], but this source is still rare because the group-velocity matching (GVM) conditions can only be matched at very limited wavelengths in a crystal. Therefore, it is still necessary to explore more nonlinear optical crystals to fully meet the need of MIR band applications. For this purpose, in this work, we investigate MIR spectrally pure single-photon generation from 14 crystals by the birefringence phase-matching (BPM) method and 8 crystals by the quasi-phase-matching (QPM) method. They can meet three kinds of GVM conditions and prepare spectrally uncorrelated biphotons so as to generate spectrally pure heralded single-photon states.
2. Theory
2.1. The Characteristics of 22 Kinds of Nonlinear Crystals
We investigate 22 kinds of nonlinear crystals in this work. Table 1 summarizes them from several perspectives, name, axial type, point group, transparency range, and the maximal nonlinear coefficient. We separate these crystals into three categories by their axial type or phase-matching form in order to illustrate the result more clearly in the next section. Most Sellmeier equations were obtained from references [34, 35], and we have updated some Sellmeier equations with the latest references and concluded them in Table 1.
| Name (ref.) | Chemical formula | Axis | Point group | λtransp. (μm) | dmax(wavelength)(pm/V) |
|---|---|---|---|---|---|
| CMTC | CdHg(SCN)4 | Uniaxial | 0.40∼2.35 | d31(1.064) = 6.2 ± 1.2 | |
| THI | Tl4HgI6 | Uniaxial | 4mm | 1.00∼60.0 | Unknown |
| LiIO3 [37] | LiIO3 | Uniaxial | 6 | 0.28∼6.00 | d33(1.064) = 4.6 ± 0.3 |
| AAS | Ag3AsS3 | Uniaxial | 3m | 0.61∼13.3 | d22(1.064) = 16.6 ± 2.5 |
| HGS [38] | HgGa2S4 | Uniaxial | 0.55∼13.0 | d36(1.064) = 31.5 ± 4.7 | |
| CGA [39] | CdGeAs2 | Uniaxial | 2m | 2.30∼18.0 | d36(10.6) = 186 ± 16 |
| TAS | Tl3AsSe3 | Uniaxial | 3m | 1.28∼17.0 | d+(10.6) = 68 ± 31 |
| AGS | AgGaS2 | Uniaxial | 2m | 0.47∼13.0 | d36(10.6) = 12.5 ± 2.5 |
| AGSe | AgGaSe2 | Uniaxial | 2m | 0.71∼19.0 | d36(10.591) = 39.5 ± 1.9 |
| GaSe [40] | GaSe | Uniaxial | 2m | 0.62∼20.0 | d22(10.6) = 54 ± 11 [40] |
| LIS [41] | LiInS2 | Biaxial | mm2 | 0.34∼13.2 | d33(2.3) = −16 ± 4 |
| LISe [42] | LiInSe2 | Biaxial | mm2 | 0.46∼14.0 | d31(2.3) = −16 ± 4 [43] |
| LGS [44] | LiGaS2 | Biaxial | mm2 | 0.32∼11.6 | d33(2.3) = −10.7 ± 2.7 [45] |
| LGSe [46] | LiGaSe2 | Biaxial | mm2 | 0.37∼13.2 | d33(2.3) = −18.2 ± 4.6 [45] |
| LT [47] | LiTaO3 | Uniaxial | 3m | 0.28∼5.50 | d33(1.064) = 12.9 |
| LN | LiNbO3 | Uniaxial | 3m | 0.40∼5.50 | d33(1.064) = 25.2 |
| KTP | KTiOPO4 | Biaxial | mm2 | 0.35∼4.50 | d33(1.064) = 14.6 ± 0.7 |
| KN | KNbO3 | Biaxial | mm2 | 0.40∼4.50 | d11(1.064) = 21.9 ± 0.5 [48] |
| BaTiO3 | BaTiO3 | Uniaxial | 4mm (room temp.) | 0.40∼9.00 | d32(1.06) = 14.4 ± 2.5 |
| MgBaF4 | MgBaF4 | Biaxial | mm2 | 0.14∼10.0 | d32(1.064) = 0.039 |
| PMN-0.38PT [49] | Uniaxial | 4mm | 0.3∼11.0 | †d33(1.064) = 12.6 | |
| OP-ZnSe [50] | ZnSe | Isotropic | 3m | 0.45∼18.0 | d36(0.852) = 53.8 |
In the first category, 9 birefringent uniaxial crystals are listed in the table. They have a very large transparency range up to 20 μm except for CMTC and LiIO3. We show 4 birefringent biaxial crystals in the second category, and these four crystals can be written as LiMX (M = In, Ga and X = S, Se). Here, In and Ga are elements of group IIIA in the periodic table; S and Se are elements of group VIA. They are all mm2 point group. With their transparency range up to 14 μm, they have similar properties and can perform many applications in the MIR band. The other 8 periodic poling crystals usually realize their phase-matching by the QPM method, so we discuss them in Sections 3.2 and 4 in detail.
2.2. The GVM Theory of Spectrally Pure Single-Photon States Generation
For ∆λ ≪ λ0, the FWHM of the pump at the intensity level is .
According to the refractive index coordinate in Appendix of reference [52], θ is the polar angle between the optical axis of the crystal and the light propagation direction and φ is the azimuth angle in the xy plane. For uniaxial crystals, θ is the cutting angle of the crystals. For biaxial crystals, when light propagates in the xz plane, φ = 0° and θ is the cutting angle; when light propagates in the yz plane, φ = 90° and θ is the cutting angle; when light propagates in the xy plane, θ = 90° and φ is the cutting angle.
The pure-state not only can be prepared through these three GVM conditions but also all the conditions that the θPMF angles are between 0 and 90° [55, 56]. Since these three GVM conditions are listed in equations (6)–(8), which are the most widely-used cases in the experiment, we mainly consider these three conditions within this work. Besides, the degenerate or nondegenerate case of other θPMF under type-II and type-0 phase-matching conditions will be illustrated in section 3.3.
3. Calculation and Simulation
3.1. Birefringent Crystals
Firstly, we consider the birefringent crystals with the BPM method. We assume that the wavelength has degenerated, i.e., 2λp = λs = λi. For uniaxial crystals, negative uniaxial crystals satisfy the Type-II SPDC with e⟶o + e phase-matching interaction. Here, the pump and idler are extraordinary (e) beams, while the signal is ordinary (o) beam. In contrast, the positive uniaxial crystals can meet the Type-II SPDC with o⟶o + e phase-matching interaction. Note that all the simulations are based on collinear figuration.
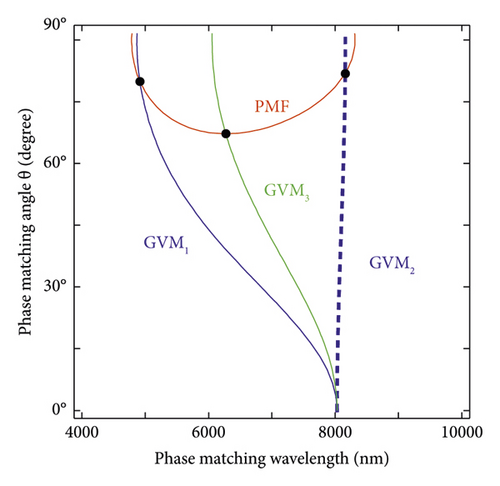
Ten kinds of uniaxial crystals are investigated in this work. Taking AgSe crystal as an example, we plot the PMF and GVM1(2,3) conditions for different wavelengths and phase-matched angles in Figure 1(a). The PMF (red) crosses the GVM1(2,3) (blue and green) at three black points, which meet the PMF and three kinds of GVM conditions simultaneously. The three points are associated with wavelengths of 4,914, 8,158, and 6,272 nm, respectively, and angles of 79.9°, 81.9°, and 67.2°. Furthermore, we calculate the other uniaxial crystals with the same method, and then we summarize the result in Table 2. In Table 2, the down-converted photons have a wavelength range from 1,298 to 11,650 nm, which is in the near-infrared (NIR) and MIR bands. The corresponding spectral purity at GVM1(2,3) wavelengths is 0.97, 0.97, and 0.82, respectively.
| Name | GVM1 (purity≈0.97) | GVM2 (purity≈0.97) | GVM3 (purity≈0.82) |
|---|---|---|---|
| CMTC ∗ | λp = 649 nm, λs,i = 1298 nm | λp = 1156 nm, λs,i = 2312 nm | λp = 829 nm, λs,i = 1658 nm |
| θ = 41.2°, deff = − 4.46 pm/V | θ = 43.6°, deff = − 3.63 pm/V | θ = 38.2°, deff = − 4.13 pm/V | |
| THI† | λp = 2841 nm, λs,i = 5682 nm | λp = 4822 nm, λs,i = 9644 nm | λp = 3705 nm, λs,i = 7410 nm |
| θ = 29.3°, deff = unknown | θ = 29.3°, deff = unknown | θ = 27.2°, deff = unknown | |
| LiIO3 | λp = 835 nm, λs,i = 1670 nm | λp = 1460 nm, λs,i = 2920 nm | λp = 1088 nm, λs,i = 2176 nm |
| θ = 29.3°, deff = 0.09 pm/V | θ = 29.7°, deff = 0.09 pm/V | θ = 27.2°, deff = 0.09 pm/V | |
| AAS | λp = 2151 nm, λs,i = 4302 nm | λp = 3617 nm, λs,i = 7234 nm | λp = 2793 nm, λs,i = 5586 nm |
| θ = 22.3°, deff = 0.16 pm/V | θ = 22.3°, deff = 0.15 pm/V | θ = 20.7°, deff = 0.16 pm/V | |
| HGS | λp = 1704 nm, λs,i = 3408 nm | λp = 2819 nm, λs,i = 5638 nm | λp = 2206 nm, λs,i = 4412 nm |
| θ = 60.1°, deff = 0.29 pm/V | θ = 59.8°, deff = 0.29 pm/V | θ = 54.2°, deff = 0.32 pm/V | |
| CGA | λp = 3692 nm, λs,i = 7384 nm | λp = 5825 nm, λs,i = 11650 nm | λp = 4690 nm, λs,i = 9380 nm |
| θ = 54.6°, deff = 0.02 pm/V | θ = 53.9°, deff = 0.02 pm/V | θ = 49.8°, deff = 0.02 pm/V | |
| TAS | λp = 3620 nm, λs,i = 7240 nm | λp = 5535 nm, λs,i = 11070 nm | λp = 4570 nm, λs,i = 9140 nm |
| θ = 27.5°, deff = 0.24 pm/V | θ = 27.0°, deff = 0.23 pm/V | θ = 25.6°, deff = 0.24 pm/V | |
| AGS | λp = 1688 nm, λs,i = 3376 nm | λp = 2845 nm, λs,i = 5690 nm | λp = 2187 nm, λs,i = 4374 nm |
| θ = 53.7°, deff = 0.14 pm/V | θ = 53.9°, deff = 0.14 pm/V | θ = 48.9°, deff = 0.15 pm/V | |
| AGSe | λp = 2457 nm, λs,i = 4914 nm | λp = 4079 nm, λs,i = 8158 nm | λp = 3136 nm, λs,i = 6272 nm |
| θ = 79.9°, deff = 0.11 pm/V | θ = 81.9°, deff = 0.13 pm/V | θ = 67.2°, deff = 0.25 pm/V | |
| GaSe | λp = 2189 nm, λs,i = 4378 nm | λp = 3657 nm, λs,i = 7314 nm | λp = 2833 nm, λs,i = 5666 nm |
| θ = 16.1°, deff = 0.51 pm/V | θ = 16.1°, deff = 0.49 pm/V | θ = 15.0°, deff = 0.51 pm/V | |
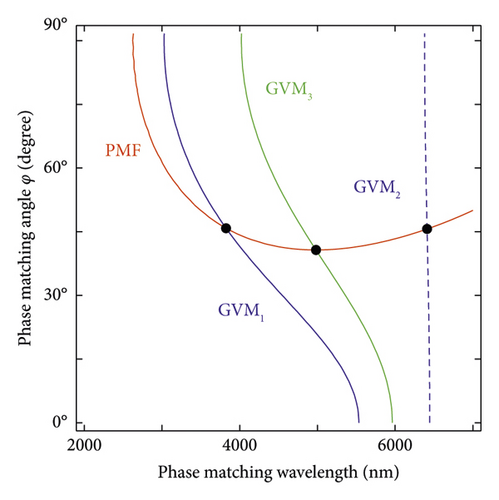
For biaxial crystals, all the crystals we investigated can only satisfy the GVM conditions in the xy plane, with polar angle θ = 90°. We study 4 kinds of biaxial crystals and choose the LISe crystal as an example, which represents the mm2 point group. The assignment of dielectric and crystallographic axes are X, Y, Z ⇒ b, a, c. As shown in Figure 1(b), in the xy plane, the cross points reflect that the GVM condition can be fulfilled at the wavelength of 3,824, 6,410, and 4,982 nm, respectively.
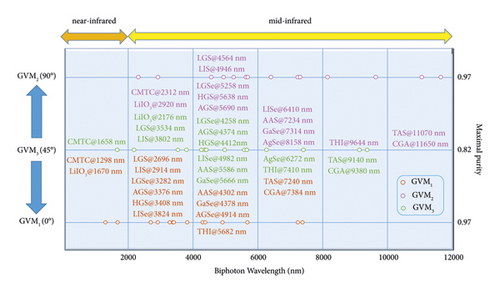
All the biaxial crystals can prepare pure-state in the range from 2,696 to 6,410 nm, as shown in Table 3. We can notice that the wavelength range is from 1,298 to 7,384 nm for the GVM1 condition, from 2,312 to 11,650 nm for the GVM2 condition, and from 1,658 to 9,380 nm for the GVM3 condition (also shown in Figure 2), which can meet the different application demands in NIR, MIR, and telecom wavelengths.
| Name | GVM1 (purity≈0.97) | GVM2 (purity≈0.97) | GVM3 (purity≈0.82) |
|---|---|---|---|
| LIS −xy | λp = 1457 nm, λs,i = 2914 nm | λp = 2473 nm, λs,i = 4946 nm | λp = 1901 nm, λs,i = 3802 nm |
| φ = 56.7°, deff = 6.01 pm/V | φ = 56.7°, deff = 5.74 pm/V | φ = 49.5°, deff = 6.05 pm/V | |
| LISe −xy | λp = 1912 nm, λs,i = 3824 nm | λp = 3205 nm, λs,i = 6410 nm | λp = 2491 nm, λs,i = 4982 nm |
| φ = 45.8°, deff = 9.65 pm/V | φ = 45.6°, deff = 9.31 pm/V | φ = 40.7°, deff = 9.19 pm/V | |
| LGS −xy | λp = 1347 nm, λs,i = 2696 nm | λp = 2282 nm, λs,i = 4564 nm | λp = 1767 nm, λs,i = 3534 nm |
| φ = 55.5°, deff = 5.24 pm/V | φ = 55.1°, deff = 5.02 pm/V | φ = 49.7°, deff = 5.19 pm/V | |
| LGSe −xy | λp = 1641 nm, λs,i = 3282 nm | λp = 2729 nm, λs,i = 5258 nm | λp = 2129 nm, λs,i = 4258 nm |
| φ = 47.8°, deff = 8.37 pm/V | φ = 47.5°, deff = 8.06 pm/V | φ = 43.3°, deff = 8.38 pm/V | |
3.2. Periodic Poling Crystals
In this section, we consider 8 periodic poling crystals with the QPM method, which has several advantages. For example, the largest component of the nonlinear coefficient matrix (usually d33) can be utilized; there is no walk-off angle so as to achieve good spatial mode; it allows phase-matching interaction in isotropic media, in which the BPM is not applicable [59]. The GVM wavelengths, the poling period Λ, and the effective nonlinear coefficient deff are calculated and listed in Table 4. The LT, LN, KTP, and KN crystals are traditionally often-used QPM crystals [21, 60–62]. Here, we find that the GVM2 wavelengths are all above 2 μm.
| Name | GVM1 (purity≈0.97) | GVM2 (purity≈0.97) | GVM3 (purity≈0.82) |
|---|---|---|---|
| LT | λp = 1279 nm, λs,i = 2558 nm | λp = 1320 nm, λs,i = 2640 nm | λp = 1299 nm, λs,i = 2598 nm |
| Λ = 33.7 μm, deff = 0.27 pm/V | Λ = 33.7 μm, deff = 0.27 pm/V | Λ = 33.7 μm, deff = 0.27 pm/V | |
| LN | λp = 1341 nm, λs,i = 2682 nm | λp = 2015 nm, λs,i = 4030 nm | λp = 1709 nm, λs,i = 3418 nm |
| Λ = 14.7 μm, deff = 2.70 pm/V | Λ = 15.2 μm, deff = 2.50 pm/V | Λ = 15.5 μm, deff = 2.60 pm/V | |
| KTP | λp = 613 nm, λs,i = 1224 nm | λp = 1169 nm, λs,i = 2338 nm | λp = 792 nm, λs,i = 1584 nm |
| Λ = 70.2 μm, deff = 2.50 pm/V | Λ = 72.2 μm, deff = 2.40 pm/V | Λ = 45.0 μm, deff = 2.40 pm/V | |
| KN | λp = 1412 nm, λs,i = 2824 nm | λp = 1869 nm, λs,i = 3738 nm | λp = 1605 nm, λs,i = 3210 nm |
| Λ = 6.2 μm, deff = 5.20 pm/V | Λ = 6.1 μm, deff = 5.00 pm/V | Λ = 6.3 μm, deff = 5.10 pm/V | |
| λp = 1518 nm, λs,i = 3036 nm | λp = 1993 nm, λs,i = 3986 nm | λp = 1740 nm, λs,i = 3480 nm | |
| Λ = 23.3 μm, deff = 10.13 pm/V | Λ = 23.3 μm, deff = 9.17 pm/V | Λ = 23.8 μm, deff = 9.69 pm/V | |
| λp = 989 nm, λs,i = 1978 nm | Not satisfied | λp = 1390 nm, λs,i = 2780 nm | |
| Λ = 948.5 μm, deff = 0.04 pm/V | Λ = 680.6 μm, deff = 0.04 pm/V | ||
| PMN-0.38PT† | λp = 2810 nm, λs,i = 5620 nm | Not satisfied | λp = 3972 nm, λs,i = 7944 nm |
| Λ = 1301.38 μm, deff = unknown | Λ = 917.83 μm, deff = unknown | ||
| OP-ZnSe | λp = 3403 nm, λs,i = 6806 nm | ||
| Λ = 262.97 μm, deff = 19.1 pm/V | |||
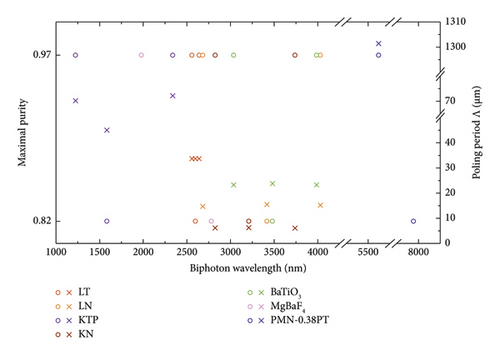
The BaTiO3 crystal shows a low birefringence, thus, only suitable for the QPM method. With its high transmission in the IR range, it is possible to prepare pure-state at 3,036, 3,986, and 3,480 nm, respectively. The MgBaF4 crystal can meet the GVM1 condition at 1,978 nm and the GVM3 condition at 2,780 nm. Note that this crystal does not satisfy the GVM2 condition. The PMN-0.38PT is a functional ferroelectric material. The GVM condition only can be fulfilled at two wavelengths, i.e., 5,620 nm and 7,944 nm for GVM1 and GVM3 conditions. The orientation-patterned zinc selenide (OP–ZnSe) is an isotropic semiconductor material; therefore, the QPM rather than BPM is applicable. OP-ZnSe has extremely high nonlinear coefficients. Since the crystal possesses only one refractive index, it can only perform Type-0 SPDC, i.e., e⟶e + e interaction, which will be discussed in the next section. All the QPM crystals can be prepared in the pure-state at the range from 1,224 to 7944 nm, as listed in Table 4.
3.3. Wavelength Nondegenerate Case
In this section, we focus on the wavelength nondegenerate case using the QPM method. Recently, we have investigated the wavelength nondegenerate case of doped PPLN crystal under type-0, type-I, and type-II conditions [24], and we utilize the same method to take OP-ZnSe as an example and calculate θPMF and the corresponding poling period Λ, as shown in Figure 3. The 50 curves with different colors in Figure 3(a) are based on equation (5) by changing tan(θPMF) from 0 to 90 degrees, and we depict 50 curves of the poling period Λ changing from 145 μm to 262 μm. The dashed black line in Figure 3 indicates the degenerate case, i.e., 2λp = λs. For one fixed pump wavelength, we can find θPMF and Λ of different signal wavelengths.
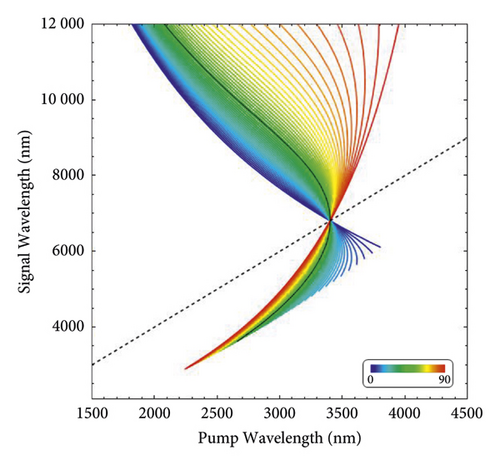
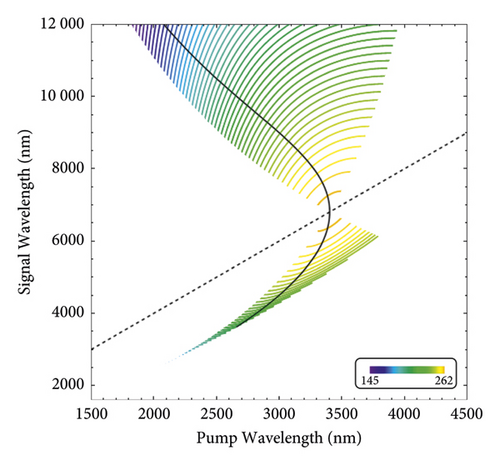
The OP-ZnSe crystal can only perform Type-0 SPDC, i.e., e⟶e + e interaction. Under the degenerate condition, the signal and the idler have the same group velocity, so the pure state cannot be prepared. The lines of all the angles θPMF converge in one point. At this point, all the GVM conditions are satisfied synchronously. Due to the singularity caused by these GVM conditions, the degenerate case at this point does not provide high purity, while the pure state can be prepared in the other area of different θPMF.
3.4. HOM Interference Simulation
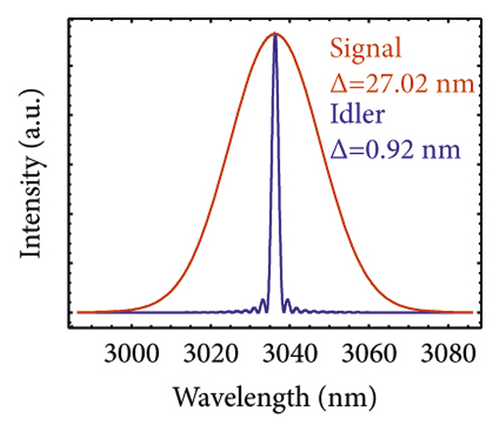
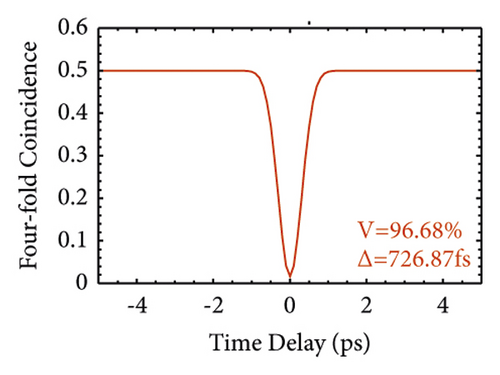
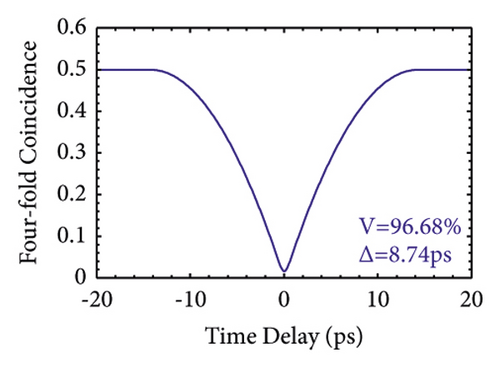
We chose BiTaO3, LGSe, and PMN-0.38PT as examples to test the HOM interference. Figure 4(a) shows that JSA is generated from BiTaO3 crystal, which is under the GVM1 condition. BiTaO3 crystal is a uniaxial QPM crystal. The JSA is obtained by using a pump laser with a bandwidth of ∆λ = 4 nm and a crystal length L of 100 mm. The JSA has a long stripe shape along the horizontal axis. Considering the spectral distributions of the signal and the idler photons, we can obtain them by projecting the joint spectral intensity onto the horizontal and vertical axes. The FWHM of the signal (idler) is 27.02 nm (0.92 nm). Figure 4(c) shows the HOM pattern of two signals heralded by two idlers; the FWHM is 726.87 fs with a visibility of 96.68%. Figure 4(d) shows the HOM pattern of two heralded idlers with an FWHM of 8.74 ps and a visibility of 96.68%.

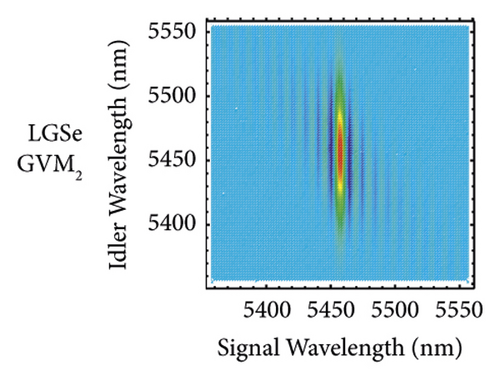
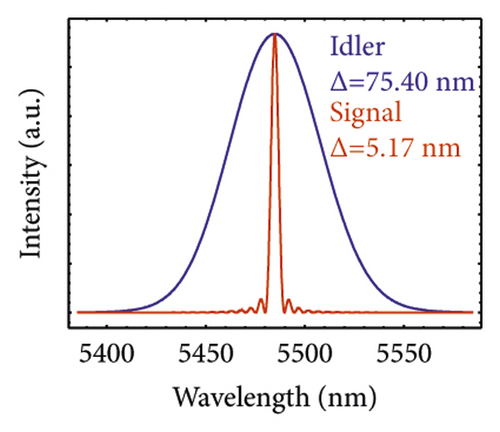
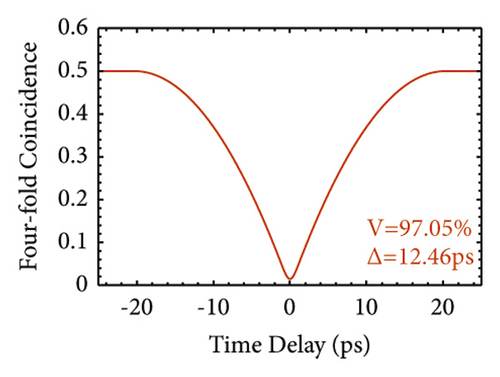
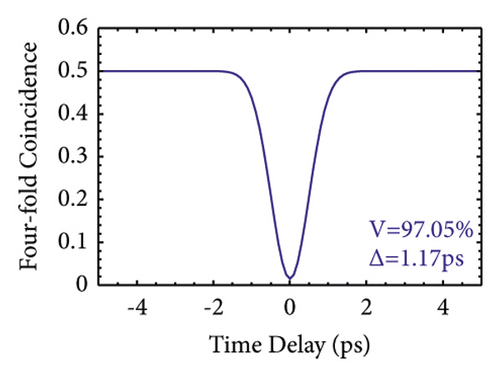
For the GVM2 condition, the result is on the second row of Figure 4. We investigate a biaxial BPM crystal LGSe. The JSA shape is also a long stripe, but it is located along the vertical axis. The pump bandwidth ∆λ and the crystal length L of Figure 4(e) are 8 nm and 200 mm. The FWHM of the signal (idler) is 5.17 nm (75.40 nm) for Figure 4(f). The FWHM of the HOM pattern by two heralded signals (idler) is 12.46 ps (1.17 ps), and the visibility is 97.05%, as shown in Figures 4(g) and 4(h).
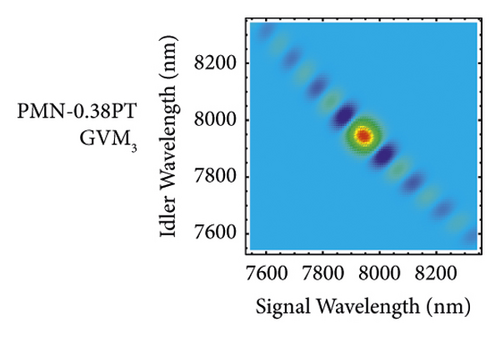
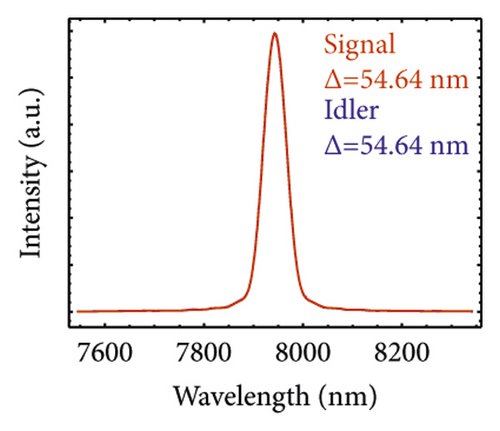
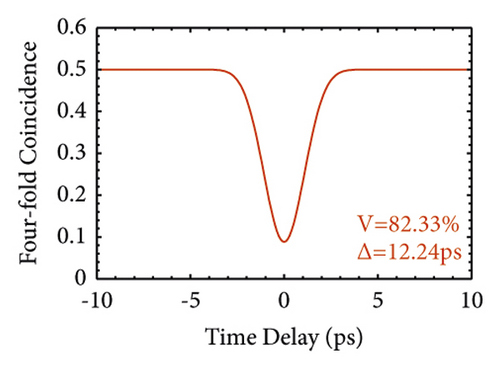
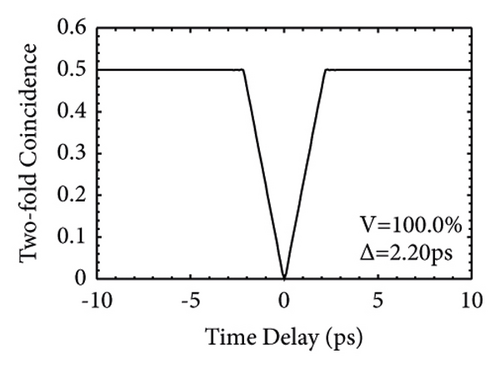
For the GVM3 condition, the result is on the third row of Figure 4. We concentrate on the PMN-0.38PT crystal. This crystal has been studied before; however, it only focuses on the GVM1 and GVM2 conditions [22]. Here, we make a thorough study of the GVM3 condition. In this case, the JSA shape is near-round and the spectra of the signal and idler are almost equal. Figure 4(i) is obtained by using a pump bandwidth of ∆λ = 11 nm and a crystal length L of 100 mm. The spectra of the signal and idler have the same FWHM of 54.64 nm. The HOM interference from two independent signal or idler sources manifests the same performance with the FWHM of 12.24 ps and visibility of 82.33%, which is much lower than the GVM1 and GVM2 cases. In case of the two-fold HOM interference, the visibility is 100% and the FWHM of the HOM pattern is 2.20 ps for Figure 4(l).
4. Discussion
We summarize the result of all the BPM crystals in Figure 2. The left vertical axis of the figure denotes the GVM condition and the corresponding PMF angle θPMF. The right vertical axis shows the maximal purity. The horizontal axis shows a wavelength range from 0 to 12 μm. Most of the crystals are located on the MIR band, from 2 μm to 12 μm. There are three cases on the NIR band. We also conclude the results of QPM crystals in Figure 5, which shows the down-converted wavelength, the poling period, and the maximal purity for all the results we calculated above.
It is important to discuss the detection of single photons in the MIR region. Recent work shows that superconducting nanowire single-photon detectors (SNSPD), which have the best performance (98%) in the NIR band [71], while having a detection efficiency at MIR band of 70% at 2 μm [72], 40% at 2.5 μm and 10% at 3 μm [73], and 1.64% for free-space communication [30]; upconversion detectors module combined with the SAPD method demonstrates the efficiency of 6.5% at room temperature [14]; semiconductor photodiodes such as Cd admixture, graphene, black arsenic phosphorus, black phosphorus carbide, tellurene, PtSe2, and PdSe2 are good candidates for wide detection range [74]. A recent review about MIR single-photon detection is presented in [75]. In the future, developing new material for SNSPD and a more effective nonlinear process of upconversion for MIR detection will be promising [76].
Except for the 22 crystals discussed above, we still find 6 kinds of new crystals in the MIR band, which are as follows: BGS, BGSe, BGGS, BGGSe, BGSS, and BGSSe [77–81]. They can be written as BaGa4X7 (X = S, Se) and BaGa2MX6 (M = Si, Ge; X = S, Se). Since the deff calculated and phase-matched methods of these crystals are complex [82–86], we did not discuss them in this work. deff for BGS and BGSe has been investigated in [87]. d33 for BGGS, BGGSe, BGSS, and BGSSe is −12.0, −23.0, 8.4, and 12.3 pm/V, respectively [88]. Moreover, the doping method can be utilized as a degree of freedom to manipulate the single-photon state at the MIR range [24].
For the GVM3 condition, the purity can be further improved from 0.82 to near 1 using the custom poling crystal scheme, for example, by applying the machine learning method or metaheuristic algorithm [25, 89].
5. Conclusion
In conclusion, we have theoretically investigated 22 nonlinear optical crystals for MIR photon generation. The down-converted photons’ wavelength ranges from 1,298 nm (1,224 nm) to 11,650 nm (7,944 nm) for the BPM (QPM) crystals. The corresponding purity for the three kinds of GVM conditions is around 0.97, 0.97, and 0.82, respectively. The wavelength nondegenerated condition, the 4-fold HOM interference, and the 2-fold HOM interference are calculated in detail. This research study may be helpful in the study of quantum communication, quantum imaging, and quantum metrology at the MIR range.
Disclosure
The preprint has previously been published [90].
Conflicts of Interest
The authors declare that they have no conflicts of interest.
Acknowledgments
We thank Prof. Keiichi Edamatsu for the helpful discussions. This work was supported by the National Natural Science Foundations of China (Grant no. 12074299), the Natural Science Foundation of Hubei Province (Grant no. 2022CFA039), and the JST SPRING (Grant no. JPMJSP2114).
Open Research
Data Availability
The data used to support the findings of this study are available from the corresponding author upon reasonable request.


