FSAS: An IoT-Based Security System for Crop Field Storage
Abstract
Internet of Things abstracts the ability to remotely associate and observe things or objects over the Internet. When it comes to agriculture, this idea has been incorporated to make agriculture-related tasks smart, secure, and automated. Agriculture is vital for economic growth and also for the survival of humans. Farmers living in rural areas of India face a common problem of the theft of equipment like induction motors from small storage houses meant for storing commodities in crop fields. In this study, we present a remote security management framework for monitoring the crop field storage house, known as the farm security alert system (FSAS). FSAS is a small, energy efficient, low cost, and accurate security management system that uses microcontroller-based passive infrared (PIR) sensor and global system for mobile communication (GSM) module to generate an alert to the farm owner if there is an intrusion event at the crop field store. The microcontroller board utilized in the proposed model is the Arduino Uno, and PIR motion sensor is used to recognize the intruder. In addition, FSAS also can be used for monitoring of induction motor by utilizing a similar arrangement of sensors. The sensor signal is transmitted to the cloud whenever the intruder is within the sensing range of the sensor node. Naive Bayes’ prediction model is used to identify the level of encroachment as no (green), mild (yellow), or high (red) threat. The status and the alarms can be received by the farm owners, either on their smartphones as application alerts or as a short message/phone call, at any distance, and independent of whether their cell phones are connected to the Internet.
1. Introduction
- (i)
Energy efficiency: storage houses in the crop fields are frequently out of electric supply due to frequent load shedding in rural India. Hence, FSAS has been supplied with 9 V batteries and designed to function for extended periods of time while consuming minimal power
- (ii)
Portability: FSAS is small, lightweight, and portable, which safeguards it from damage due to animals or children
- (iii)
Low cost: small farmers cannot afford expensive and complex intruder detection systems (IDS) that require high power [8]. The low-cost system proposed in this study is within the reach of small farmers and demands little maintenance
- (iv)
Accuracy: the proposed system is highly accurate and is able to provide precise status of the crop field store at all times
In the proposed system, a PIR sensor is used, which is a low-cost and low-power sensor, often employed in ambient monitoring systems to deliver a simple but reliable trigger signal, when the presence of humans is detected [9]. The sensor node collects and merges fundamental data (passage time, sensor output amplitude, and GPS location) to categorize the passages into three categories based on human position. The naive Bayes classifier [10] is explored as a predictor. The analog output of the PIR sensor is uploaded to the IoT cloud with the help of the GSM module. The real-time analog sensor output is then used in monitoring the farm store. Whenever there is human movement in the vicinity of the sensing node, an analog signal is generated. This signal is analyzed in the IoT cloud to categorize the intruder advance as present, mild alert, and red alert. Naive Bayes model is used to classify human intrusion into three classes. The intruder presence and the level of danger are communicated to the farm owner as a text message, a phone call, and as an intimation on an Android application. FSAS is implemented on low-power, low-cost devices and is able to achieve a prediction accuracy of 93 percent.
This paper presents a novel approach in which a PIR sensor-based sensing node is used in the detection of intrusion in a crop field store. The analog signal received from the sensing node is analyzed in the IoT cloud to determine the extent of intrusion by the human trespasser. Prediction of the intruder distance is made by the naive Bayes method, and the farmer is alerted about the situation. This paper is organized as follows: Section 2 summarises the various work in the same field. Section 3 explains the components of the FSAS intrusion detection system and its components, along with the working principle of the PIR motion sensor and the circuit design of the proposed system. Section 4 provides a detailed methodology of the FSAS. Section 6 comprises the detailed results and discussion of the proposed model. Finally, in Section 7, we have concluded our work and described future work.
2. Related Work
In the literature, IDS have been developed for varied purposes. Jabez and Muthukumar [11] proposed a methodology entitled as outlier detection, where the variance dataset is dignified by the neighborhood outlier factor (NOF). Here, the qualified model comprises large datasets with a storing environment for refining the performance of IDS. They provide the experimental outcomes that substantiate the proposed methodology and recognize the differences more efficiently than any other methodologies. Ferrag et al. [12] provided the implementation methodologies for agricultural security to highlight their practical usage. As per their methodology, an IDS for agricultural security has been implemented that impacts its process and influence on the examined resource significantly. Whether it is network-based or host-based, an IDS should not obstruct the enactment of the network or the host in a method that reduces user dissatisfaction or unhappiness.
Mohamed et al. [13] introduced a critical survey of the IDS methodologies that emerge through its implementation. They also give the constraint in the IDS research activities and projected upcoming work while discovering the development of the topic, the scope of discussion, and the importance and involvement of every research to the domain deliberated. Finally, the researchers were able to differentiate between each subfield of IDS research activities. Yadahalli et al. [14] proposed a system, which detects the intruder, observes any suspicious movement, and gives an alert to the system owner. The system gives flexibility to the farmers for guaranteeing full protection of their farmlands from any suspicious activities or attacks. Mallikarjun et al. [15] implemented an intruder detection system based on long range (LoRa) approach, which marks the usages of PIR sensor to sense the intruder and their nearby environment. They use the LoRa approach to send the information to the control system for further processing, to make an appropriate decision.
Ahanger et al. [16] presented a framework to monitor and detect the intruder for home security based on the foot-mat approach. They have used the fog computing approach for analysis of foot pressure and movement to detect the identity of personnel. Parvin et al. [17] used RFID and GPS for tracking human movement in a corridor within a building. A comparison table between various existing works, based on different parameters like IDS type, system type, range, detection mechanism, and anomaly response, is provided in Table 1.
| Study (year) | IDS type | System type | Range | Detection mechanism | Anomaly response |
|---|---|---|---|---|---|
| [11] | Network-based | Active (detect and defend) or passive | Not available | Anomaly-based methods | Not available |
| [12] | Host-based | Passive (monitor and notify) | Short range | Signature-based methods | Send alert |
| [14] | Host-based | Passive (monitor and notify) | Short range | Specification-based methods | Visual alarm, send message |
| [15] | Network-based | Passive (monitor and notify) | Long range | Specification-based methods | Store the data on the cloud and display on the dashboard |
| [16] | Network-based | Active (detect and defend) or passive | Not available | Signature-based methods | Sending information detection agent |
3. Farm Security Alert System (FSAS)
An energy-efficient, portable, scalable, and low-cost IoT-based farm security system for Indian farmers is proposed in this work. Cost and energy efficiencies are the important considerations that have been taken into account while designing the system for intruder detection. The system consists of a microcontroller-based sensor unit which collects the ambient data, time, and intruder location from the passive IR sensor. The GSM module is used in the transmission of the sensor data to the cloud platform. The architecture and data flow of the proposed system for collection, storage, monitoring, and analysis of data are shown in Figure 1.
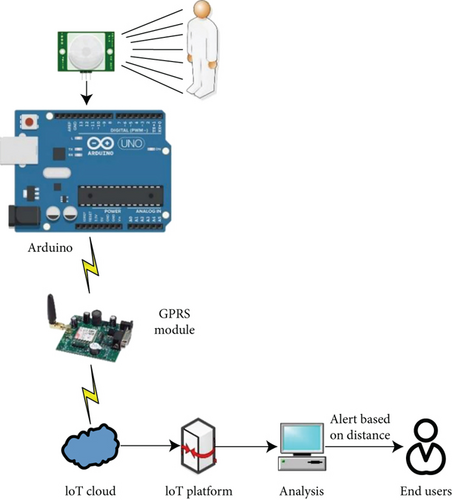
The hardware and the software architectures of the IoT system are discussed in the following passages:
3.1. Hardware Components
The details of the hardware components with type and purpose of the FSAS system are provided in Table 2.
| S. no. | Component | Type | Purpose |
|---|---|---|---|
| 1 | PIR sensor | Motion sensor | Capturing intruder motion |
| 2 | Arduino Uno | Microcontroller board | Converting the analog sensor signal into digital waveform |
| 3 | GSM module | Communication module | Transmission of sensor signal to IoT cloud |
The components required to design the security system for intruder detection in crop field storage houses are discussed in detail in the subsections that follows.
3.1.1. Arduino Uno Microcontroller Board
Arduino Uno is the primary microcontroller board utilized in this model. Arduino [18] receives the input signal from the PIR motion detection sensor and uploads it to the IoT cloud with the help of the GSM module. The microcontroller can process analog as well as digital signals obtained from the sensor.
3.1.2. PIR Motion Detector Sensor
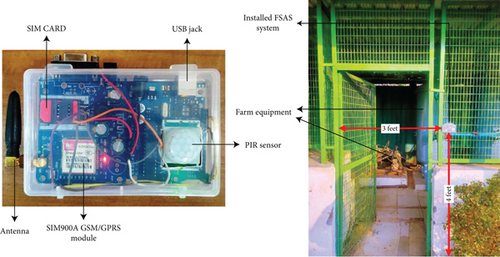
A PIR sensor [19] has been utilized to report the presence of individuals in its vicinity. Fundamentally, movement identification utilizes light sensors to identify the proximity of infrared rays produced by a warm dissenter. As shown in Figure 2, a PIR sensor measures the heat energy being released by a human in the surroundings using a pair of pyroelectric sensors.
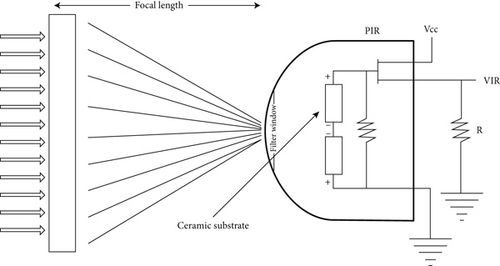
These two sensors are placed next to one other, and the sensor generates a signal when the signal difference between the two sensors changes (for example, if an intruding human enters the scene). A set of lenses in the sensor’s enclosure concentrates IR radiation on each of the two pyroelectric sensors. These lenses increase the sensing area of the device.
3.1.3. GSM/GPRS Module
SIM 900D [20] is a GSM/GPRS module with a Quad-Band framework that takes 850/900/1800/1900 MHz frequencies, built with the support of RS232. SIM 900D module supports voice call, SMS, and Internet facilities. Microphone and speaker connections are embedded in the module to make and receive calls.
3.2. Power Supply
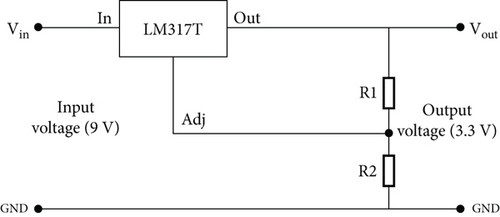
The sensing unit is in sleep mode during the time when there is no intrusion; hence, the power consumption is minimal. Only when an intrusion is detected, the microcontroller wakes up and starts transmitting the sensor signal to the IoT cloud. Figure 3 shows the schematic diagram of the power supply with a voltage controller.
3.3. Circuit Design of Security System
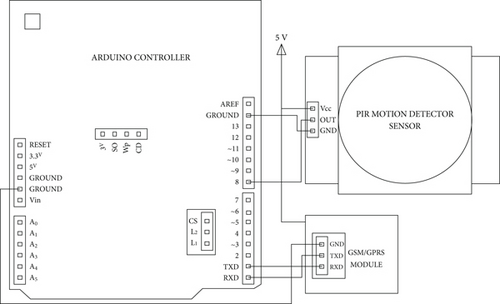
In Figure 4, there are three main components of the system: Arduino, PIR motion detector sensor, and GSM/GPRS module. The PIR motion sensor has a digital output pin, i.e., OUT pin, which is connected to one of the digital input pins of the Arduino board. The GSM/GPRS module connects with the Arduino board in a serial fashion. GSM/GPRS module has TXD and RXD pins on the module, and these pins are connected to the RXD and TXD pins of the Arduino, respectively.
3.4. Software System
The data acquired by the PIR sensor in the sensing system is sent to the Arduino, which then sends it to the IoT cloud through the GSM module. Table 3 shows the details of software components used in the sensing system. Our IoT system’s software consists of (a) an embedded C++ program that is loaded into the memory of the microcontroller used to collect, calibrate, and transmit sensor data to IoT cloud using GSM module and (b) IoT cloud service that receives the data from the Android application.
| S. no. | Component | Software used |
|---|---|---|
| 1 | Arduino Uno | AVR C++ |
| 2 | IoT cloud | IBM Watson |
| 3 | Smartphone application | Android |
IBM Watson cloud service is used in this work for storage and analysis of the uploaded sensor data. IBM Maximo asset monitor cloud service under IBM Maximo APM (asset performance management) empowers the IBM Watson cloud service which is responsible for IoT data flow. We have registered and added our device to the platform service for sending and accessing the data. After this small setup process, we have the device ID, device type, and organization ID for our IoT device, which will further be used at the time of developing the Android application. In the next step, we have generated the “API key” and “authentication token” for sending and accessing the sensor data from the IBM cloud platform service. Here, platform service acts like a message broker, which handles IoT data in real time. IBM Maximo asset monitor cloud service provides a simple and clean UI-based dashboard service from which we can easily access, monitor, control, and manage the services of our IoT device.
An Android application has been developed to convey important updates and alerts related to farm security for those farm owners who are capable of owning and operating smartphones. We have used the Flutter framework to develop our Android application. Flutter is an open-source framework for developing top quality mobile apps for both Android and iOS devices. It offers an easy to understand, robust, effective, and simple SDK that makes it simple to create mobile applications in Dart, Google’s own programming language.
We demonstrate how PIR detectors may be used to estimate an intruder’s location and alarm the farm owner in the following paragraphs.
3.5. Working Principle of PIR Motion Sensor
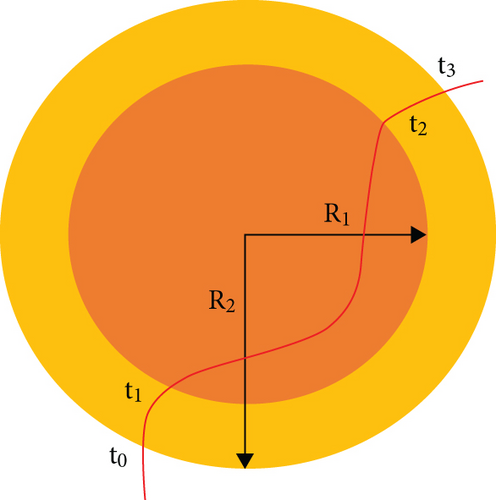
PIR sensor is used for recording human activity in its vicinity, if there is a person (or an intruder) within the sensor detection area, represented as a bounded circle area with radius R1 [22–24]. In a realistic scenario, there is a time delay while a PIR sensor senses the object. A practical model of the PIR sensing work has been shown in Figure 2.
As shown in Figure 5, the intruding human gets detected while moving inside the inner circle of the sensor detection area with R1 radius, and the physical location of sensing for PIR sensor [22, 23] is the outer disk with R2 radius. The PIR sensor records “detected” from time bound t1 to t2, but the time bounds t0-t1 and t2-t3 signify the movement of a person. This constraint of the sensor has been taken into consideration while designing the intrusion detection system.
4. Methodology
The goal of this system is to develop a modest, reasonable, and effective security alert system. The system is designed for detecting intrusion and alerting the farm owner about the distance of the intruder from the farm store. The proposed security system provides effective security from intruders, by providing the date and time as well as the approximate distance of the intruder from the door of the farm store. As seen in Figure 6, the sensing system is installed at a height of four feet above the ground, at the opening side of the door of the store.
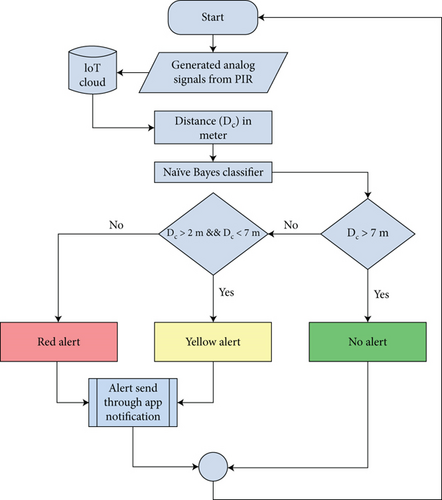
Intimation is provided to the farm owner when the intruder comes in the range of the PIR sensor. The PIR sensor can detect an intruder starting at approximately 7 meters. Hence, the first level of alert is generated when the intruder is detected first. As shown in Table 4, when the intruder is first detected and continues to move towards the door of the farm store, the first level of alert (yellow) is raised.
| Distance (m) | Security level | Alert level |
|---|---|---|
| >07 | Green | No alert |
| 07-02 | Yellow | Alert level 1 |
| <02 | Red | Alert level 2 |
When the intruder is within 2 meters of the sensing system, the higher level of alert (red alert) is generated. PIR sensor recognizes human movement by detecting the distinction in infrared heat levels radiated by encompassing things. The output of the PIR sensor goes high when it recognizes any movement. The coverage area of a PIR motion detection sensor is approx. 7 meters. For the effective use of the PIR sensor, it requires a ready-to-use time of 20-60 seconds because the PIR sensor makes some settling time during which it adjusts its sensor according to the atmosphere and steadies the infrared detector. On the off chance that the sensor is not given enough adjusting time [25], the output of the PIR sensor may not be corrected [26]. This issue must be managed in the programming of Arduino by disregarding the low-yield flags that have a shorter span than a predefined time.
4.1. Determination of Intruder Distance
The microcontroller-based sensing node is in sleep mode when there is no human presence. Whenever the PIR motion sensor identifies any movement, it generates an analog signal proportional to the distance of the human subject from the sensing node. The smoothed and averaged analog output of the PIR sensor corresponding to the intruder distance is shown in Figure 7. It is used in generation of intrusion alerts to avoid farm theft.

As soon as the presence of an intruder is detected, the sensing node starts transmitting an analog signal to the IoT cloud, and the first level (yellow) of alert is generated. If the intruder continues to move towards the sensing node or is detected in greater vicinity of the farm store, the second level (red alert) of alert is generated and the farm owner is notified with the help of simultaneous short message (SMS), phone call, and an Android application alert. The output of the sensor goes low, even when it detects a movement that may deceive the Arduino. This issue should be managed within the embedded program of Arduino by neglecting the low output signal that has a shorter span than a predefined time.
The naive Bayes model comprises the analog signal obtained from the PIR sensor as the explanatory variable the target variables (the level of alert: green, yellow, or red) as model outputs. Table 5 summarises the data sample used in the Bayesian inference process in the form of a data matrix.
| S. no. | Input class | Output class | ||
|---|---|---|---|---|
| PIR sensed value | Corresponding distance (meters) | Level of threat (mild, moderate, severe) | Generated alert (red, yellow, green) | |
| 1 | 12732.28 | 2.2 | Moderate | Yellow |
| 2 | 20082.28 | 3.47 | Moderate | Yellow |
| 3 | 20082.28 | 3.47 | Moderate | Yellow |
| 4 | 8681.10 | 1.5 | Severe | Red |
| 5 | 7523.62 | 1.3 | Severe | Red |
| 6 | 52086.61 | 9 | Mild | Green |
| 7 | 87968.50 | 15.2 | Mild | Green |
| 8 | 41669.29 | 7.2 | Mild | Green |
| 9 | 47456.69 | 8.2 | Mild | Green |
| 10 | 37618.11 | 6.5 | Mild | Green |
As shown in Figure 8, the input sensor signal is constantly being received and analyzed by the microcontroller. The naive Bayes model comprises the analog signal which is proportional to the distance obtained from the PIR sensor as the explanatory variable the target variables (the level of alert: green, yellow, or red) as model outputs. As long as the human intruder is more than 7 meters away from the crop field store, his presence is not intimated to the farm owner. If the intruder moves closer to the door of the crop field store and comes in the field of detection of the sensor node, the microcontroller communicates the intruder distance to the IoT cloud, from where a yellow alert is generated to the farm owner. If the intruder proceeds further and crosses the threshold of 2 meters, the farm owner is communicated a red alert. The use of prediction model to generate alerts using the sensor output is explained in the following section.
5. Intrusion Detection and Prediction Model
The analog signal produced by the sensing node is classified into three classes by the prediction model so that the farmer can be notified about the level of threat. The naive Bayes classification approach is used for this purpose. The Bayes theorem is the foundation of the naive Bayes classification method. Naive Bayes is favoured over all other classification algorithms because of its fast computation and training [28]. The naive Bayes technique is extremely scalable, scaling linearly as the predictor count increases [29]. It is resilient to noisy sensor data since it is unaffected by irrelevant attributes [26].
The parameters of the proposed prediction model, p(TV), p(X), and p(xi|TV), are learned directly from the training samples. The preceding equation yields the conditional probability distribution of TV given X. The value of the independent attribute TV given the values of the dependent attribute X, which is also the output of the prediction model, is the state of TV with the highest likelihood. The results obtained with the prediction model are described in the following section.
6. Results and Discussion
The results are based on a database that was created using FSAS for the purpose of training and testing the prediction model. For training, 400 experimental observations of the occurrence of intrusion were used, with 80 being used to test the model, and the remaining were used for training. F1 score, precision, recall, and the receiver operating character (ROC) curve are used to evaluate the prediction ability of the proposed model.
6.1. Precision
6.2. Recall
6.3. F1 Score
The F1 score is particularly useful when dealing with imbalanced datasets, where the number of instances in one class is significantly higher than the other. In such cases, accuracy alone may be misleading, as a classifier that always predicts the majority class would achieve a high accuracy while performing poorly on the minority class. The F1 score considers both precision and recall, giving equal importance to correctly classifying instances of both classes.
6.4. Area under Receiver Operating Characteristic (ROC)
In an ROC curve, the sensitivity (true-positive rate) is displayed for various parameter threshold values, as a function of (1 - specificity) or the false alarm ratio. The points on the ROC curve [33] reflect a sensitivity/specificity pair according to a specific decision threshold. The area under the curve (AUC) is a measure of a parameter’s ability to distinguish between different types of intrusion classes [34]. Table 6 summarises the intrusion identification and classification performance of the proposed model on the basis of precision, recall, F1 score, and ROC area.
| Intrusion level | TP rate | FP rate | FN rate | Precision | Recall | F1 score | ROC area |
|---|---|---|---|---|---|---|---|
| No threat | 0.98 | 0.02 | 0.02 | 0.96 | 0.97 | 0.97 | 0.98 |
| Mild threat (yellow alert) | 0.97 | 0.03 | 0.03 | 0.95 | 0.96 | 0.95 | 0.96 |
| High threat (red alert) | 0.97 | 0.03 | 0.03 | 0.97 | 0.95 | 0.96 | 0.97 |
A classifier with a higher area under the ROC curve (AUC) generally indicates better performance in distinguishing between the classes. The ROC curve is particularly useful when the class distribution is imbalanced or when the relative costs of false positives and false negatives vary. By examining the ROC curve, one can select an optimal threshold that balances the classifier’s sensitivity and specificity based on the specific requirements of the problem.
The mean accuracy, precision, recall, and F1 scores for the high threat event are 97, 95, and 96 percent, respectively. For mild alert events, the figures are 96, 95, and 95 percent, respectively. The best results are obtained with the no threat event, with a true-positive rate of 98 percent, followed by the mild threat and the high threat incidents. With a mean F1 score of 0.96 for the three classes of intrusion, the present model is quite accurate. The suggested model is very accurate, with a mean F1 score higher than 0.95 for all the 03 categories of human intrusion. The classification accuracy of the proposed model is demonstrated visually with the help of the ROC curve in Figure 9 with different classification outcomes on intrusion.
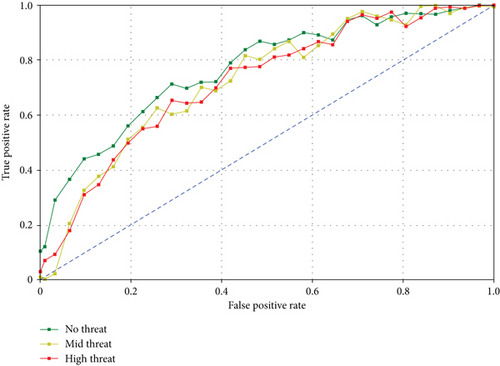
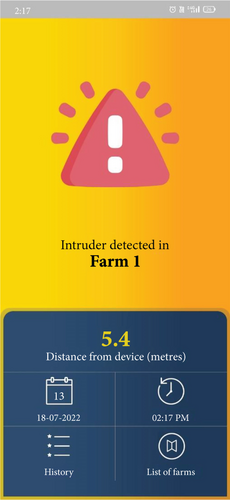
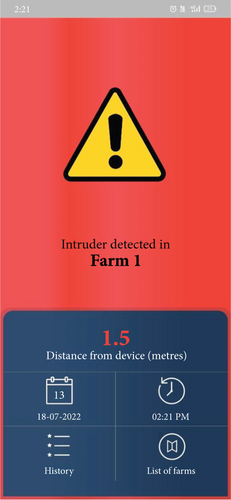
As is evident from the curve, the maximum area is covered by the no-intrusion event, followed by the high threat and the mild threat events. The farm owner receives the intrusion alerts in the form of short messages, phone calls, and application alerts. The farm owners who are capable of owning and operating smartphones receive intrusion alerts on their smartphone screen using the Android application, FSAS (farm security system), which they are required to install. The screenshots of intrusion alerts, as received by the farm owner in case of an intrusion event, on the Android application developed for this study, are shown in Figure 9.
Whenever the PIR sensor identifies any movement, it generates an analog signal proportional to the distance of the human subject from the sensing node, and the sensing node starts transmitting this signal to the IoT cloud. The naive Bayes model comprises the analog signal obtained from the PIR sensor as the explanatory variable and the target variables (the level of alert: green, yellow, or red) as model outputs, and the first level (yellow) of alert is generated. If the intruder continues to move towards the sensing node or is detected in greater vicinity of the farm store, the second level (red alert) of alert is generated and the farm owner is notified with the help of an Android application alert. Figure 10 shows an alert on an Android application when the intrusion is detected at crop field store: (a) yellow alert: the intruder is first detected and is within 7 meters from the farm store door and (b) red alert: the intruder continues to proceed towards the door of the farm store and is within 2 meters.
6.5. Model Validation
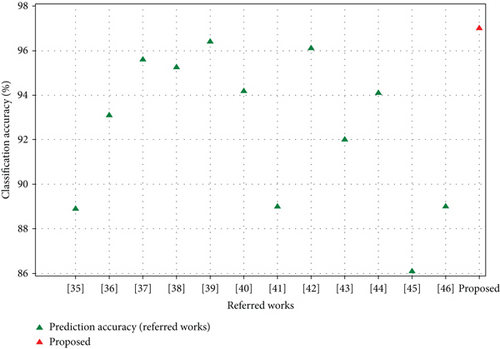
Software-based techniques to analyze and detect intrusion have been demonstrated in several works, but they have not yet been significantly acknowledged as a comprehensive solution. It is feasible to compare the performance of existing techniques with the proposed system by using classification performance parameters. The effectiveness of the prediction model is validated using accuracy. Table 7 shows the model’s validation through comparison of performance metrics with existing systems. Our method performs more effectively than the previous systems, with an accuracy value of 0.97.
Figure 11 demonstrates the simulation graphs related to the comparative study between the proposed model and the existing models.
7. Conclusion
This work describes a security management system that can monitor, detect, and classify human intrusion to prevent farm theft. The proposed system is low cost, energy efficient, easy to use and maintain, accurate, and adaptable to any type of storage house. With the use of a naive Bayes classifier, the system leverages data from sensor node to develop an intrusion detection and classification system. Precision, F1 score, recall, and ROC curve were used to examine the system’s detection and classification accuracy. With the mean F1 score exceeding 0.95, the suggested method is proven to be very accurate in identifying and categorising intrusion events. For the high threat of intrusion event, the average F1 score, precision, and recall values are 96, 97, and 95 percent, respectively. The figures are 95, 96, and 95 percent, respectively, for mild alert events. With a true-positive rate of 98 percent, F1 score of 96 percent, precision and recall values of 96 and 97 percent, and ROC of 98 percent, the no threat event yields the best classification results, followed by the mild and the high threat incidences. The proposed system boasts of being portable, scalable, low cost, energy efficient, simple in design, and accurate. The drawback of the system is that it is unable to distinguish between the farm owner and the intruder. If an alert is generated for an intruder, we may assume that the system is functioning properly; but if it is a frequent visitor, another mechanism to deal with such scenarios should be in place. The identification of specific individuals or objects usually requires additional sensors, input devices, or higher-level software processing.
We propose to use a multisensor fusion approach in the future, where multiple sensors could be simultaneously used in the sensing system, which will improve the accuracy of detecting human intrusion. It is proposed to deploy such sensor nodes over a large number of crop field stores, where each node uploads sensor data to the IoT cloud, so that monitoring and human intrusion detection is performed over a sizable geographical area with a large number of beneficiaries.
Abbreviations
-
- FSAS:
-
- Farm security alert system
-
- PIR:
-
- Passive infrared sensor
-
- GSM:
-
- Global system for mobile communication
-
- IoT:
-
- Internet of Things
-
- SMS:
-
- Short message services
-
- NB:
-
- Naive Bayes
-
- IDS:
-
- Intruder detection systems
-
- GPS:
-
- Global positioning system
-
- NOF:
-
- Neighborhood outlier factor
-
- SDK:
-
- Software development kit
-
- ROC:
-
- Receiver operating characteristic
-
- AUC:
-
- Area under the curve.
Conflicts of Interest
The authors declare that they have no conflict of interest.
Open Research
Data Availability
The dataset used in this study is available with the authors and will be provided upon request.


